70301 Investment Properties for Sale
Browse homes for sale and investment properties in 70301. Refine your search by price, property type, or more.
Best cash flowing properties in 70301
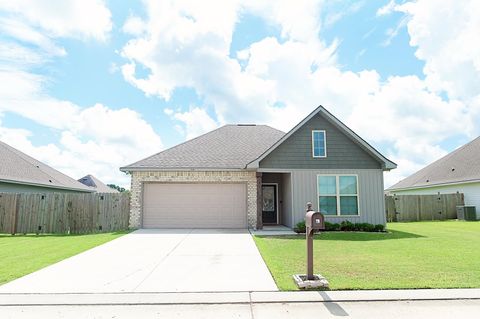
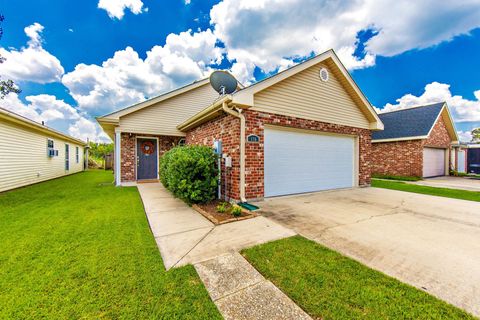
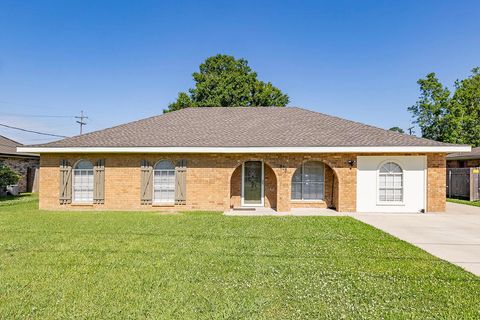
Active
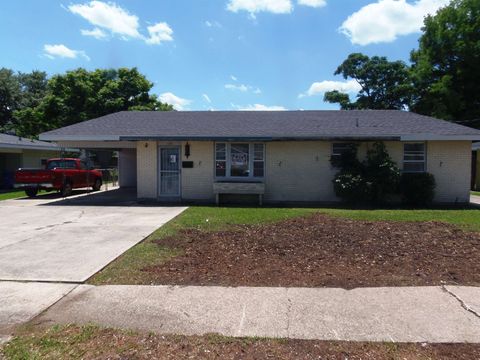
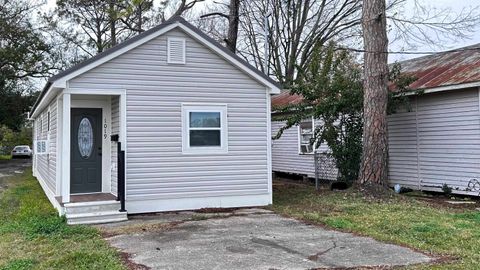
$95,900
3
bds
|
3
ba
|
2,244
sqft
|
built
1960
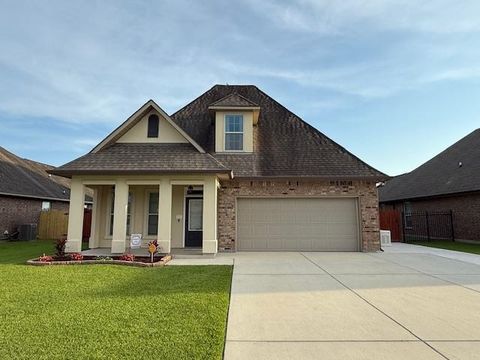
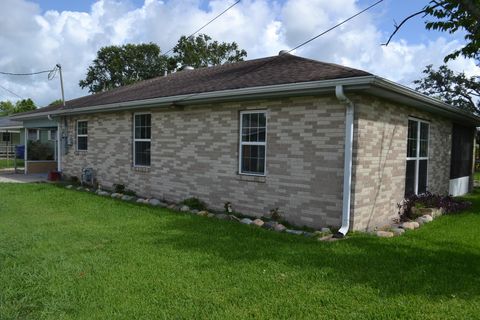
106 Apricot St, Thibodaux, LA 70301
$788
Cash flow
42.9%
Cash-on-Cash Return
15.5%
Cap rate
1.9%
Rent to Value Ratio
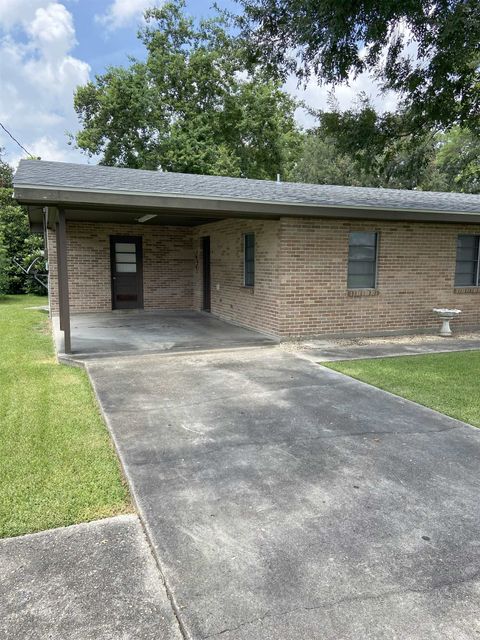
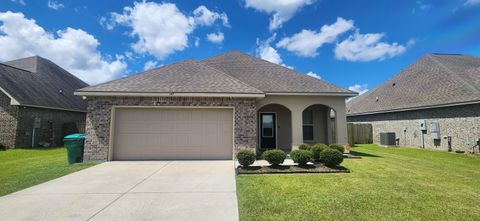
Active
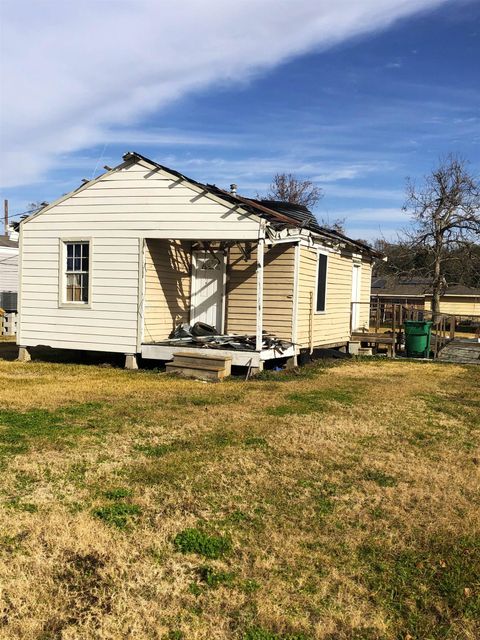
$62,000
2
bds
|
1
ba
|
624
sqft
|
built
1949
2305 Saint Bernard St, Thibodaux, LA 70301
$759
Cash flow
14.3%
Cash-on-Cash Return
14.7%
Cap rate
1.8%
Rent to Value Ratio
86 out of 106 properties for sale in 70301
Limited Results Shown
Create a free account, or log in to reveal all property listings and enjoy the complete experience.
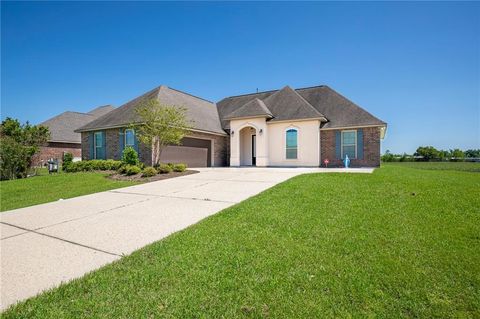
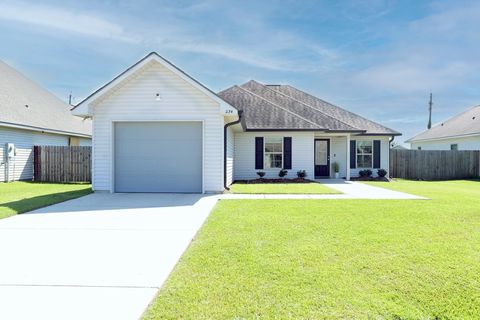
Active
$287,000
4
bds
|
2
ba
|
1,885
sqft
|
built
2016
383 Kleinpeter Dr, Thibodaux, LA 70301
$160
Cash flow
2.9%
Cash-on-Cash Return
6.3%
Cap rate
0.8%
Rent to Value Ratio
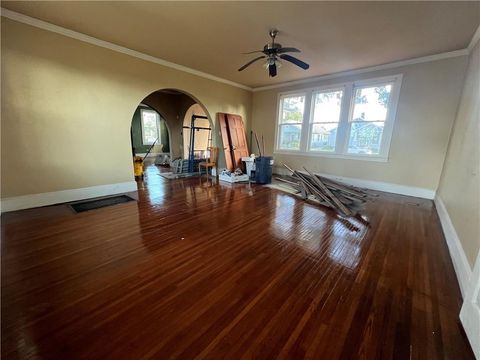
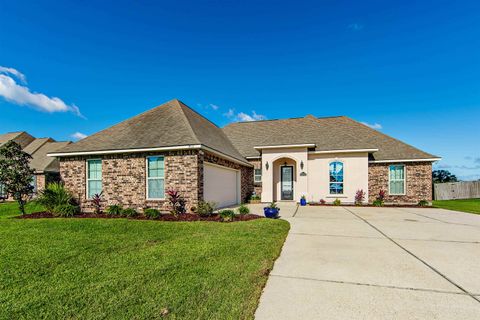
Active
$309,000
3
bds
|
2
ba
|
2,750
sqft
|
built
1925
305 E 2nd St, Thibodaux, LA 70301
$-82
Cash flow
-1.4%
Cash-on-Cash Return
5.4%
Cap rate
0.6%
Rent to Value Ratio
Active
$599,000
3
bds
|
2
ba
|
2,260
sqft
|
built
2007
1294 Burma Rd, Thibodaux, LA 70301
$-1,455
Cash flow
-12.7%
Cash-on-Cash Return
2.8%
Cap rate
0.3%
Rent to Value Ratio
Active
$395,000
4
bds
|
3
ba
|
2,622
sqft
|
built
2020
306 Royal Oak Blvd, Thibodaux, LA 70301
$-330
Cash flow
-4.4%
Cash-on-Cash Return
4.7%
Cap rate
0.6%
Rent to Value Ratio
Active
$173,000
3
bds
|
2
ba
|
1,639
sqft
|
built
1983
251 Bayou Vista Dr, Thibodaux, LA 70301
$423
Cash flow
12.8%
Cash-on-Cash Return
8.6%
Cap rate
1.0%
Rent to Value Ratio
Active
$399,900
4
bds
|
2
ba
|
2,916
sqft
|
built
1975
1611 Saint Mary St, Thibodaux, LA 70301
$-512
Cash flow
-6.7%
Cash-on-Cash Return
4.1%
Cap rate
0.5%
Rent to Value Ratio
Active
$345,000
4
bds
|
3
ba
|
2,424
sqft
|
built
2017
371 Pond Dr, Thibodaux, LA 70301
$-274
Cash flow
-4.1%
Cash-on-Cash Return
4.7%
Cap rate
0.6%
Rent to Value Ratio
Active
$250,000
4
bds
|
2
ba
|
2,110
sqft
|
built
1976
206 Glenn St, Thibodaux, LA 70301
$59
Cash flow
1.2%
Cash-on-Cash Return
6.0%
Cap rate
0.7%
Rent to Value Ratio
Active
$1,100,000
5
bds
|
5
ba
|
4,662
sqft
|
built
2004
205 E Plater Dr, Thibodaux, LA 70301
$-2,998
Cash flow
-14.2%
Cash-on-Cash Return
2.4%
Cap rate
0.3%
Rent to Value Ratio
Active
$247,500
3
bds
|
2
ba
|
1,718
sqft
|
built
2013
258 Harvest Ct, Thibodaux, LA 70301
$71
Cash flow
1.5%
Cash-on-Cash Return
6.0%
Cap rate
0.7%
Rent to Value Ratio
Active
$260,000
4
bds
|
3
ba
|
1,782
sqft
|
built
2021
114 Shadow Pointe Rd, Thibodaux, LA 70301
$-8
Cash flow
-0.2%
Cash-on-Cash Return
5.6%
Cap rate
0.7%
Rent to Value Ratio
Active
$189,000
3
bds
|
2
ba
|
1,692
sqft
|
built
1959
204 Tiger Dr, Thibodaux, LA 70301
$210
Cash flow
5.8%
Cash-on-Cash Return
7.0%
Cap rate
0.8%
Rent to Value Ratio
Active
$289,000
4
bds
|
3
ba
|
1,851
sqft
|
built
2022
155 Magazine Loop, Thibodaux, LA 70301
$-105
Cash flow
-1.9%
Cash-on-Cash Return
5.2%
Cap rate
0.7%
Rent to Value Ratio
Active
$255,000
3
bds
|
2
ba
|
1,481
sqft
|
built
2006
139 Natchez Dr, Thibodaux, LA 70301
$35
Cash flow
0.7%
Cash-on-Cash Return
5.8%
Cap rate
0.7%
Rent to Value Ratio
Active
$179,900
3
bds
|
2
ba
|
1,384
sqft
|
built
2004
176 Jolie Oaks Blvd, Thibodaux, LA 70301
$253
Cash flow
7.3%
Cash-on-Cash Return
7.4%
Cap rate
0.9%
Rent to Value Ratio
Active
$247,000
3
bds
|
2
ba
|
1,613
sqft
|
built
2020
147 Cesare Dr, Thibodaux, LA 70301
$52
Cash flow
1.1%
Cash-on-Cash Return
5.9%
Cap rate
0.7%
Rent to Value Ratio
Active
$350,000
3
bds
|
2
ba
|
1,732
sqft
|
built
2018
261 Marmande Ave, Thibodaux, LA 70301
$-192
Cash flow
-2.9%
Cash-on-Cash Return
5.0%
Cap rate
0.6%
Rent to Value Ratio
Active
$740,000
3
bds
|
5
ba
|
3,398
sqft
|
built
1980
525 Supercharge Dr, Thibodaux, LA 70301
$-1,570
Cash flow
-11.1%
Cash-on-Cash Return
3.1%
Cap rate
0.4%
Rent to Value Ratio
Active
$175,400
2
bds
|
1
ba
|
1,216
sqft
|
built
1975
702 Coulon Rd, Thibodaux, LA 70301
$136
Cash flow
4.0%
Cash-on-Cash Return
6.6%
Cap rate
0.8%
Rent to Value Ratio
Active
$389,000
3
bds
|
2
ba
|
2,029
sqft
|
built
2005
435 Glenwild Dr, Thibodaux, LA 70301
$-185
Cash flow
-2.5%
Cash-on-Cash Return
5.1%
Cap rate
0.6%
Rent to Value Ratio
Active
$255,000
3
bds
|
2
ba
|
1,756
sqft
|
built
2002
109 Rosedown Dr, Thibodaux, LA 70301
$35
Cash flow
0.7%
Cash-on-Cash Return
5.8%
Cap rate
0.7%
Rent to Value Ratio
Active
$125,000
bds
|
0
ba
|
1,200
sqft
|
built
722 Bayou Rd, Thibodaux, LA 70301
$305
Cash flow
12.7%
Cash-on-Cash Return
8.6%
Cap rate
1.0%
Rent to Value Ratio
Active
$286,000
3
bds
|
2
ba
|
2,097
sqft
|
built
1978
304 Winder Rd, Thibodaux, LA 70301
$-111
Cash flow
-2.0%
Cash-on-Cash Return
5.2%
Cap rate
0.6%
Rent to Value Ratio
Active
$220,000
3
bds
|
2
ba
|
1,351
sqft
|
built
2022
317 Outpost Way, Thibodaux, LA 70301
$44
Cash flow
1.0%
Cash-on-Cash Return
5.9%
Cap rate
0.7%
Rent to Value Ratio
Active
$185,000
3
bds
|
2
ba
|
1,150
sqft
|
built
2011
109 Sagewood Dr, Thibodaux, LA 70301
$91
Cash flow
2.6%
Cash-on-Cash Return
6.3%
Cap rate
0.8%
Rent to Value Ratio
Active
$242,000
3
bds
|
2
ba
|
1,551
sqft
|
built
2022
270 Shadow Pointe Rd, Thibodaux, LA 70301
$78
Cash flow
1.7%
Cash-on-Cash Return
6.1%
Cap rate
0.7%
Rent to Value Ratio
Active
$315,000
3
bds
|
3
ba
|
2,597
sqft
|
built
1977
200 Wintergreen St, Thibodaux, LA 70301
$234
Cash flow
3.9%
Cash-on-Cash Return
6.6%
Cap rate
0.8%
Rent to Value Ratio
Active
$225,000
3
bds
|
2
ba
|
1,483
sqft
|
built
2018
2584 Pineridge St, Thibodaux, LA 70301
$39
Cash flow
0.9%
Cash-on-Cash Return
5.9%
Cap rate
0.7%
Rent to Value Ratio
Active
$221,000
3
bds
|
2
ba
|
1,356
sqft
|
built
2015
150 Petal Ave, Thibodaux, LA 70301
$58
Cash flow
1.4%
Cash-on-Cash Return
6.0%
Cap rate
0.7%
Rent to Value Ratio
Active
$675,000
4
bds
|
4
ba
|
4,270
sqft
|
built
1998
200 Rienzi Dr, Thibodaux, LA 70301
$-1,193
Cash flow
-9.2%
Cash-on-Cash Return
3.6%
Cap rate
0.4%
Rent to Value Ratio
Active
$299,000
4
bds
|
3
ba
|
2,235
sqft
|
built
1974
818 Oak Ln, Thibodaux, LA 70301
$-311
Cash flow
-5.4%
Cash-on-Cash Return
4.4%
Cap rate
0.5%
Rent to Value Ratio
Active
$229,500
3
bds
|
2
ba
|
1,478
sqft
|
built
1949
131 Pecan St, Thibodaux, LA 70301
$18
Cash flow
0.4%
Cash-on-Cash Return
5.8%
Cap rate
0.7%
Rent to Value Ratio
Active
$228,000
3
bds
|
2
ba
|
1,438
sqft
|
built
2019
234 Colony Station St, Thibodaux, LA 70301
$143
Cash flow
3.3%
Cash-on-Cash Return
6.4%
Cap rate
0.8%
Rent to Value Ratio
Active
$290,000
4
bds
|
2
ba
|
1,885
sqft
|
built
2015
366 Crossing North St, Thibodaux, LA 70301
$146
Cash flow
2.6%
Cash-on-Cash Return
6.3%
Cap rate
0.8%
Rent to Value Ratio
Active
$147,000
2
bds
|
1
ba
|
772
sqft
|
built
1930
1019 Ridgefield Rd, Thibodaux, LA 70301
$201
Cash flow
7.1%
Cash-on-Cash Return
7.3%
Cap rate
0.9%
Rent to Value Ratio
Active
$299,000
4
bds
|
3
ba
|
1,689
sqft
|
built
2009
176 Lake Howard Ave, Thibodaux, LA 70301
$-68
Cash flow
-1.2%
Cash-on-Cash Return
5.4%
Cap rate
0.7%
Rent to Value Ratio
Active
$205,000
3
bds
|
2
ba
|
1,356
sqft
|
built
2014
198 Southern Cir, Thibodaux, LA 70301
$272
Cash flow
6.9%
Cash-on-Cash Return
7.3%
Cap rate
0.9%
Rent to Value Ratio
Active
$190,000
3
bds
|
2
ba
|
1,684
sqft
|
built
1972
2540 Highway 1, Thibodaux, LA 70301
$67
Cash flow
1.8%
Cash-on-Cash Return
6.1%
Cap rate
0.7%
Rent to Value Ratio