70435 Investment Properties for Sale
Browse homes for sale and investment properties in 70435. Refine your search by price, property type, or more.
Best cash flowing properties in 70435
Active
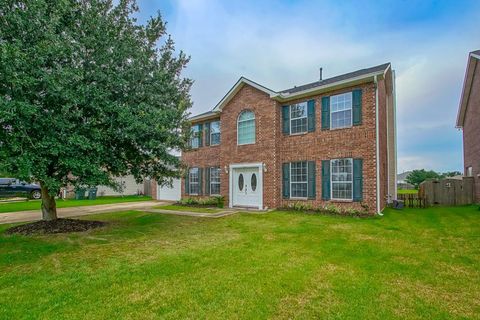
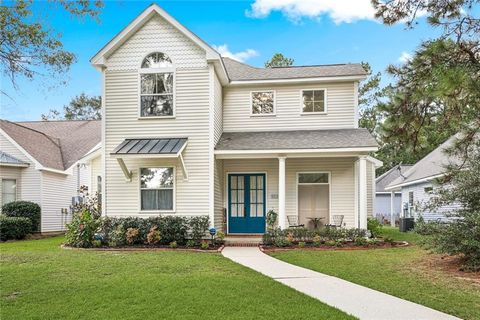
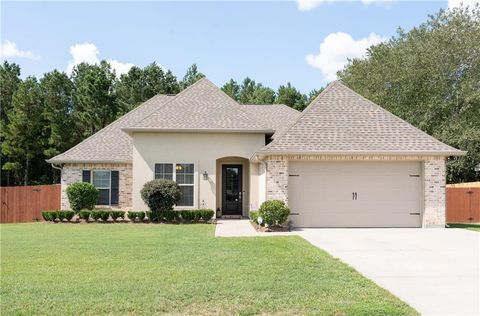
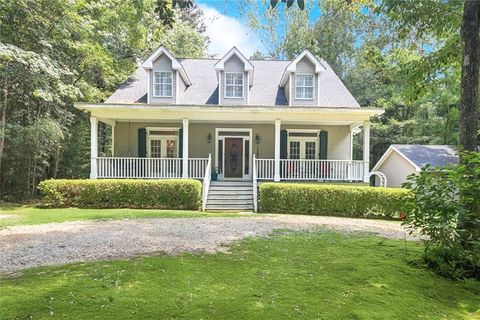
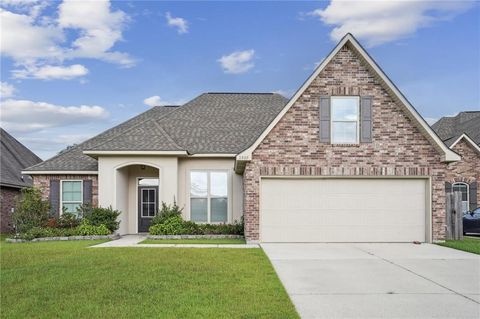
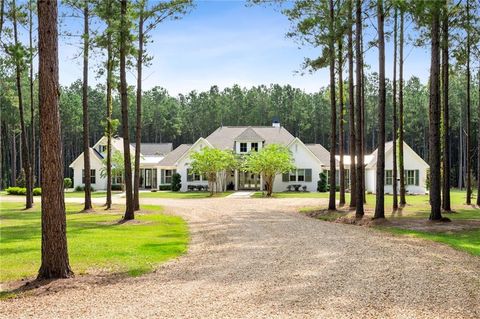
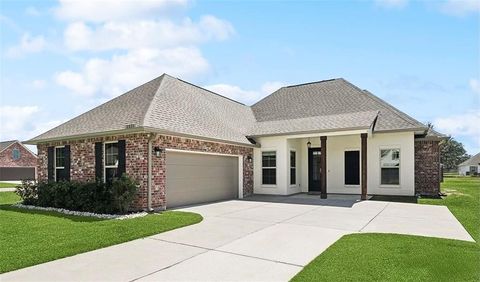
$315,000
4
bds
|
3
ba
|
2,662
sqft
|
built
2007
784 Lakeview Ln, Covington, LA 70435
$403
Cash flow
6.7%
Cash-on-Cash Return
7.2%
Cap rate
0.9%
Rent to Value Ratio
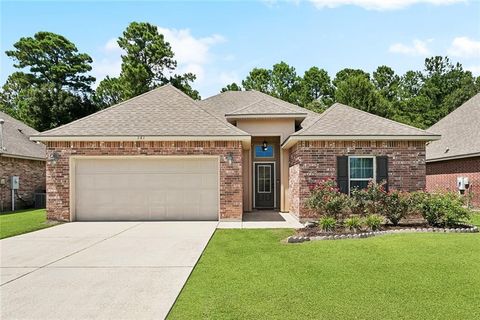
Active
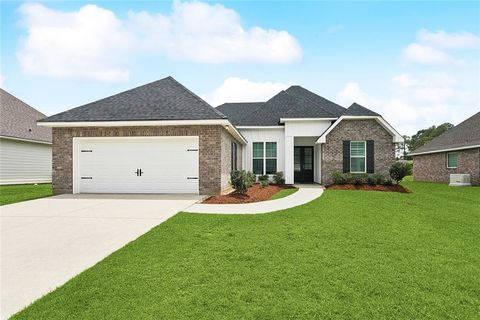
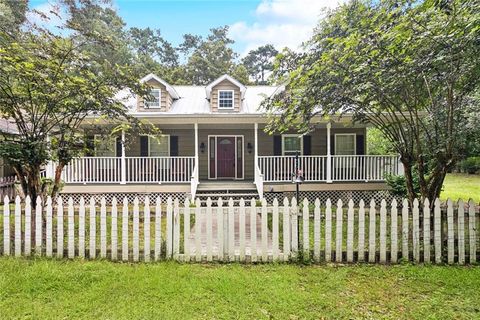
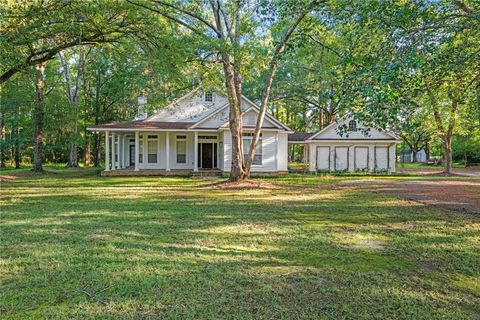
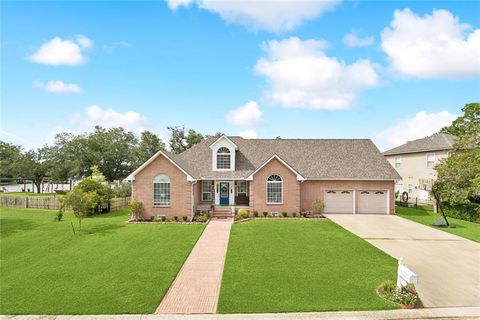
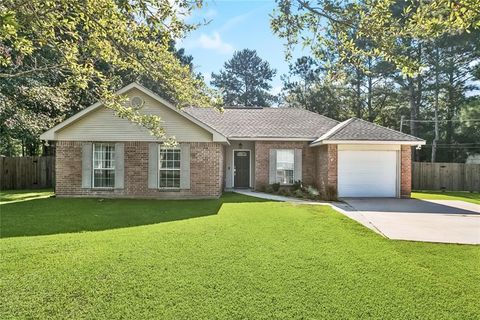
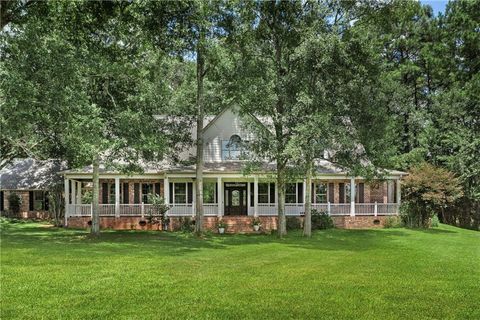
$339,900
4
bds
|
2
ba
|
1,844
sqft
|
built
2022
72372 Homestead St, Covington, LA 70435
$377
Cash flow
5.8%
Cash-on-Cash Return
7.0%
Cap rate
0.9%
Rent to Value Ratio
86 out of 94 properties for sale in 70435
Limited Results Shown
Create a free account, or log in to reveal all property listings and enjoy the complete experience.
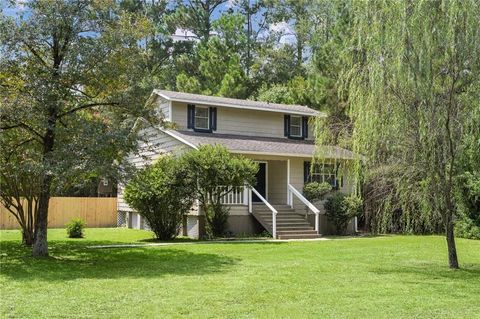
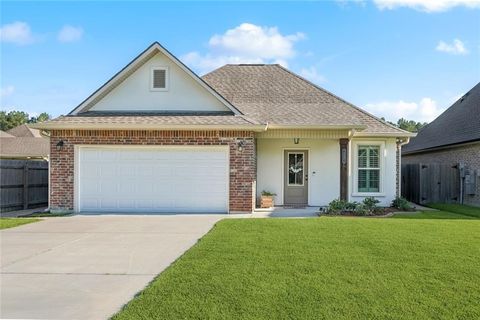
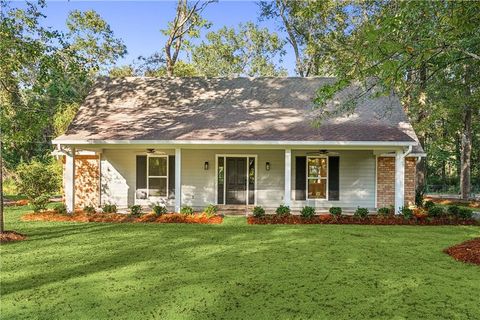
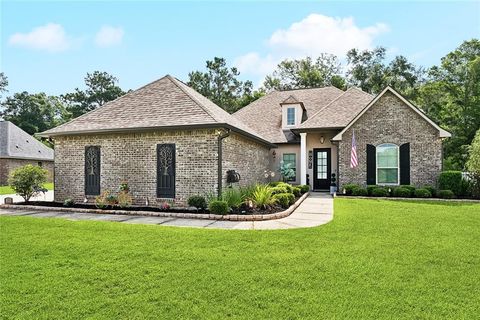
Active
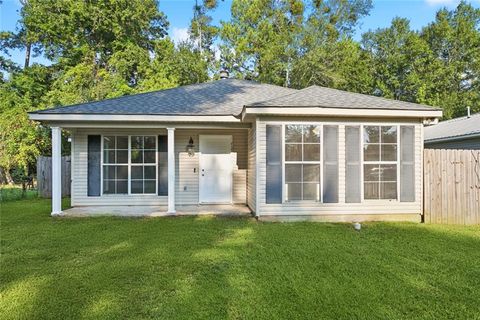
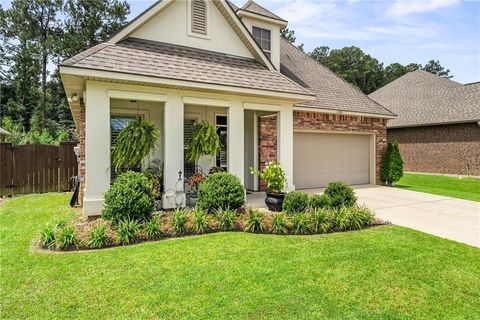
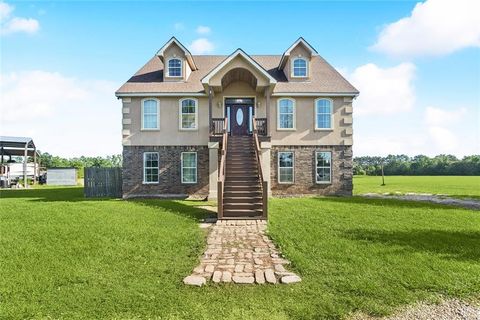
$245,000
3
bds
|
3
ba
|
1,454
sqft
|
built
1986
22040 Nolan Rd, Covington, LA 70435
$221
Cash flow
4.7%
Cash-on-Cash Return
6.8%
Cap rate
0.8%
Rent to Value Ratio
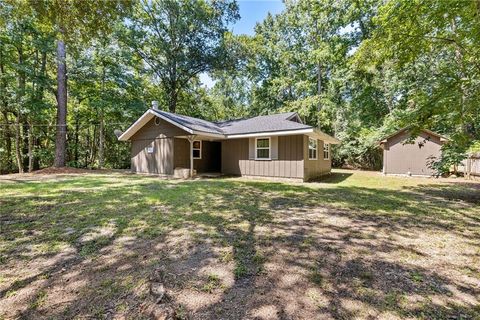
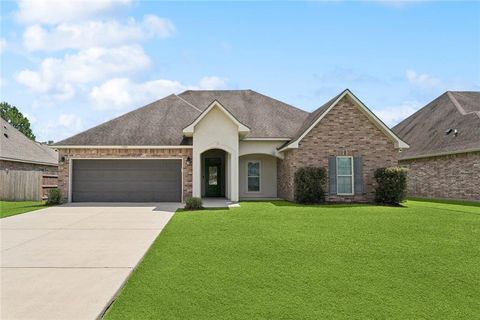
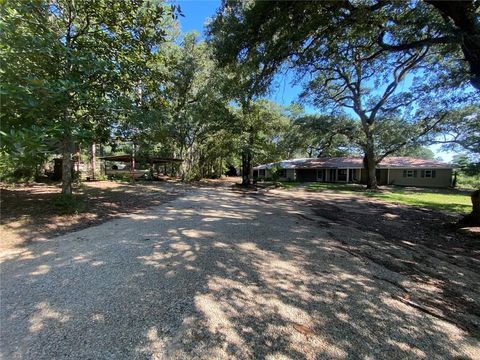
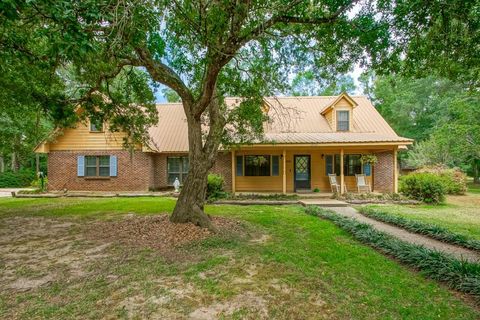
Active
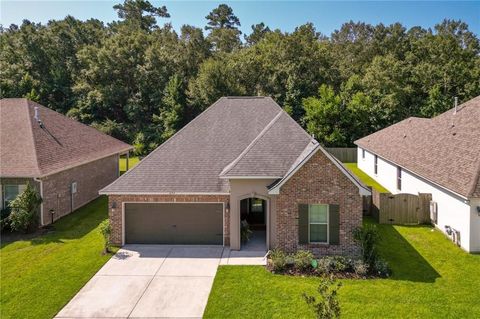
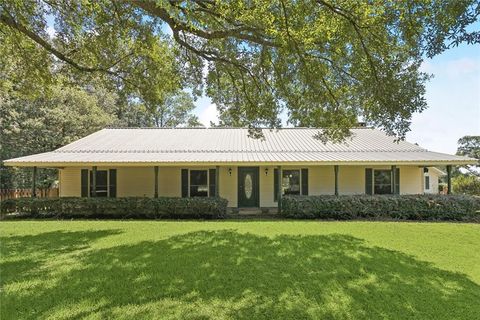
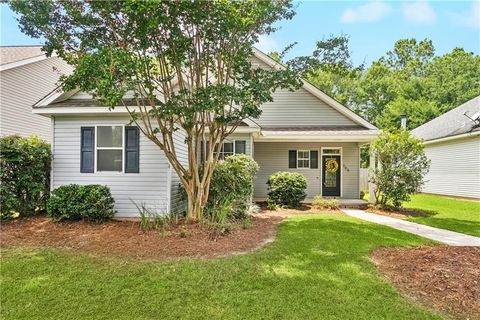
$208,000
2
bds
|
1
ba
|
1,100
sqft
|
built
1978
74413 Delta Ave, Covington, LA 70435
$120
Cash flow
3.0%
Cash-on-Cash Return
6.4%
Cap rate
0.8%
Rent to Value Ratio
Active
$310,000
3
bds
|
3
ba
|
1,825
sqft
|
built
2004
501 Branch Crossing Dr, Covington, LA 70435
$88
Cash flow
1.5%
Cash-on-Cash Return
6.0%
Cap rate
0.7%
Rent to Value Ratio
Active
$339,900
3
bds
|
3
ba
|
2,205
sqft
|
built
1998
12145 Jones Rd, Covington, LA 70435
$116
Cash flow
1.8%
Cash-on-Cash Return
6.1%
Cap rate
0.7%
Rent to Value Ratio
Active
$180,000
3
bds
|
2
ba
|
1,309
sqft
|
built
2006
72433 Dahlia St, Covington, LA 70435
$45
Cash flow
1.3%
Cash-on-Cash Return
6.0%
Cap rate
0.7%
Rent to Value Ratio
Active
$315,000
3
bds
|
2
ba
|
1,825
sqft
|
built
2018
653 Terrace Lake Dr, Covington, LA 70435
$-63
Cash flow
-1.0%
Cash-on-Cash Return
5.4%
Cap rate
0.7%
Rent to Value Ratio
Active
$329,900
3
bds
|
2
ba
|
1,638
sqft
|
built
2019
20111 Walden St, Covington, LA 70435
$164
Cash flow
2.6%
Cash-on-Cash Return
6.3%
Cap rate
0.8%
Rent to Value Ratio
Active
$428,000
4
bds
|
2
ba
|
2,208
sqft
|
built
1999
18063 Pheasant Ln, Covington, LA 70435
$-93
Cash flow
-1.1%
Cash-on-Cash Return
5.4%
Cap rate
0.7%
Rent to Value Ratio
Active
$310,000
4
bds
|
3
ba
|
1,953
sqft
|
built
2020
12521 Parma Cir, Covington, LA 70435
$65
Cash flow
1.1%
Cash-on-Cash Return
5.9%
Cap rate
0.7%
Rent to Value Ratio
Active
$370,000
4
bds
|
2
ba
|
2,239
sqft
|
built
2013
1504 Dominic Dr, Covington, LA 70435
$-55
Cash flow
-0.8%
Cash-on-Cash Return
5.5%
Cap rate
0.7%
Rent to Value Ratio
Active
$399,999
3
bds
|
7
ba
|
2,686
sqft
|
built
1996
9 Glen Loop, Covington, LA 70435
$-168
Cash flow
-2.2%
Cash-on-Cash Return
5.2%
Cap rate
0.6%
Rent to Value Ratio
Active
$535,000
4
bds
|
3
ba
|
2,775
sqft
|
built
1995
14253 S Lakeshore Dr, Covington, LA 70435
$-162
Cash flow
-1.6%
Cash-on-Cash Return
5.3%
Cap rate
0.7%
Rent to Value Ratio
Active
$359,900
3
bds
|
3
ba
|
2,093
sqft
|
built
1982
34 Glen Loop, Covington, LA 70435
$91
Cash flow
1.3%
Cash-on-Cash Return
6.0%
Cap rate
0.7%
Rent to Value Ratio
Active
$358,000
3
bds
|
3
ba
|
2,773
sqft
|
built
1976
20213 Narrow Rd, Covington, LA 70435
$-314
Cash flow
-4.6%
Cash-on-Cash Return
4.6%
Cap rate
0.6%
Rent to Value Ratio
Active
$368,900
3
bds
|
3
ba
|
2,236
sqft
|
built
2001
76333 Highway 1083, Covington, LA 70435
$-21
Cash flow
-0.3%
Cash-on-Cash Return
5.6%
Cap rate
0.7%
Rent to Value Ratio
Active
$245,000
3
bds
|
2
ba
|
1,648
sqft
|
built
1994
18165 Pheasant Ln, Covington, LA 70435
$-124
Cash flow
-2.6%
Cash-on-Cash Return
5.1%
Cap rate
0.6%
Rent to Value Ratio
Active
$269,900
3
bds
|
2
ba
|
1,352
sqft
|
built
2009
132 Eagle Landing Dr, Covington, LA 70435
$78
Cash flow
1.5%
Cash-on-Cash Return
6.0%
Cap rate
0.7%
Rent to Value Ratio
Active
$550,000
4
bds
|
3
ba
|
2,914
sqft
|
built
2003
17 Terrace Dr, Covington, LA 70435
$-188
Cash flow
-1.8%
Cash-on-Cash Return
5.3%
Cap rate
0.6%
Rent to Value Ratio
Active
$345,000
3
bds
|
2
ba
|
1,887
sqft
|
built
2017
2505 Sam Ct, Covington, LA 70435
$-6
Cash flow
-0.1%
Cash-on-Cash Return
5.7%
Cap rate
0.7%
Rent to Value Ratio
Active
$260,000
3
bds
|
2
ba
|
1,487
sqft
|
built
2001
75522 Beverly Dr, Covington, LA 70435
$12
Cash flow
0.2%
Cash-on-Cash Return
5.7%
Cap rate
0.7%
Rent to Value Ratio
Active
$413,000
4
bds
|
3
ba
|
2,397
sqft
|
built
2017
2261 Darlene Dr, Covington, LA 70435
$-256
Cash flow
-3.2%
Cash-on-Cash Return
4.9%
Cap rate
0.6%
Rent to Value Ratio
Active
$495,000
3
bds
|
2
ba
|
2,554
sqft
|
built
1985
81170 Section Rd, Covington, LA 70435
$-962
Cash flow
-10.1%
Cash-on-Cash Return
3.3%
Cap rate
0.4%
Rent to Value Ratio
Active
$1,750,000
4
bds
|
4
ba
|
3,936
sqft
|
built
2021
291 Shenandoah Ln, Covington, LA 70435
$-6,176
Cash flow
-18.4%
Cash-on-Cash Return
1.4%
Cap rate
0.2%
Rent to Value Ratio
Active
$1,298,000
5
bds
|
4
ba
|
4,112
sqft
|
built
2008
85312 Highway 437, Covington, LA 70435
$-3,107
Cash flow
-12.5%
Cash-on-Cash Return
2.8%
Cap rate
0.3%
Rent to Value Ratio
Active
$495,000
4
bds
|
4
ba
|
2,890
sqft
|
built
2007
17359 Handsome Meadow Ln, Covington, LA 70435
$-410
Cash flow
-4.3%
Cash-on-Cash Return
4.7%
Cap rate
0.6%
Rent to Value Ratio
Active
$250,000
3
bds
|
3
ba
|
1,569
sqft
|
built
2005
309 Branch Crossing Dr, Covington, LA 70435
$165
Cash flow
3.4%
Cash-on-Cash Return
6.5%
Cap rate
0.8%
Rent to Value Ratio
Active
$375,000
4
bds
|
3
ba
|
2,372
sqft
|
built
2022
2031 Gabriel Dr, Covington, LA 70435
$-90
Cash flow
-1.3%
Cash-on-Cash Return
5.4%
Cap rate
0.7%
Rent to Value Ratio
Active
$489,000
4
bds
|
3
ba
|
2,471
sqft
|
built
2020
327 Saw Grass Loop, Covington, LA 70435
$-189
Cash flow
-2.0%
Cash-on-Cash Return
5.2%
Cap rate
0.7%
Rent to Value Ratio
Active
$273,500
3
bds
|
2
ba
|
1,689
sqft
|
built
2013
261 Knoll Pine Cir, Covington, LA 70435
$54
Cash flow
1.0%
Cash-on-Cash Return
5.9%
Cap rate
0.7%
Rent to Value Ratio
Active
$465,000
4
bds
|
4
ba
|
2,902
sqft
|
built
1979
20300 Brunning Rd, Covington, LA 70435
$-269
Cash flow
-3.0%
Cash-on-Cash Return
5.0%
Cap rate
0.6%
Rent to Value Ratio
Active
$284,000
3
bds
|
2
ba
|
1,498
sqft
|
built
2014
552 Bateleur Way, Covington, LA 70435
$214
Cash flow
3.9%
Cash-on-Cash Return
6.6%
Cap rate
0.8%
Rent to Value Ratio

Active
$299,000
4
bds
|
3
ba
|
2,733
sqft
|
built
2005
312 Colt Ct, Covington, LA 70435
$340
Cash flow
5.9%
Cash-on-Cash Return
7.0%
Cap rate
0.9%
Rent to Value Ratio
Active
$525,000
4
bds
|
3
ba
|
3,200
sqft
|
built
2007
76163 Louis Quave Rd, Covington, LA 70435
$-345
Cash flow
-3.4%
Cash-on-Cash Return
4.9%
Cap rate
0.6%
Rent to Value Ratio
Active
$399,000
3
bds
|
2
ba
|
1,875
sqft
|
built
1999
72688 Military Rd, Covington, LA 70435
$-508
Cash flow
-6.6%
Cash-on-Cash Return
4.2%
Cap rate
0.5%
Rent to Value Ratio
Active
$239,900
3
bds
|
2
ba
|
1,326
sqft
|
built
1985
21238 Shady Ln, Covington, LA 70435
$245
Cash flow
5.3%
Cash-on-Cash Return
6.9%
Cap rate
0.8%
Rent to Value Ratio
Active
$434,900
4
bds
|
3
ba
|
3,389
sqft
|
built
2007
457 Steeple Chase Rd, Covington, LA 70435
$-174
Cash flow
-2.1%
Cash-on-Cash Return
5.2%
Cap rate
0.6%
Rent to Value Ratio
Active
$369,900
4
bds
|
3
ba
|
2,084
sqft
|
built
1996
14380 S Lakeshore Dr, Covington, LA 70435
$-216
Cash flow
-3.0%
Cash-on-Cash Return
5.0%
Cap rate
0.6%
Rent to Value Ratio
Active
$425,000
3
bds
|
3
ba
|
2,400
sqft
|
built
1986
20200 Narrow Rd, Covington, LA 70435
$-838
Cash flow
-10.3%
Cash-on-Cash Return
3.3%
Cap rate
0.4%
Rent to Value Ratio