70809 Investment Properties for Sale
Browse homes for sale and investment properties in 70809. Refine your search by price, property type, or more.
Best cash flowing properties in 70809
Active
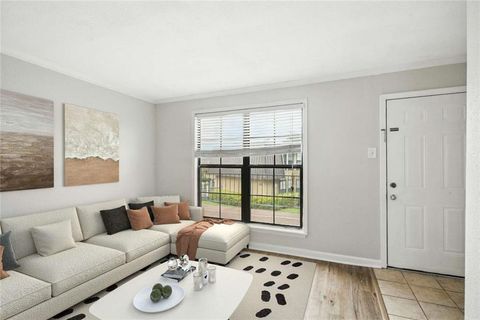
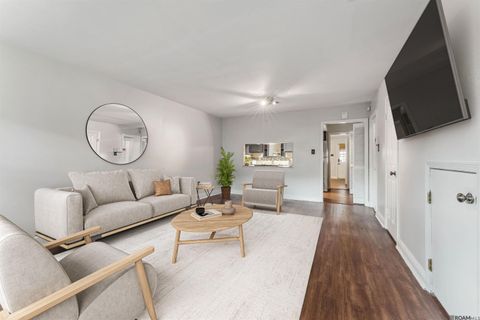
$84,900
2
bds
|
3
ba
|
1,136
sqft
|
built
1980
10286 W Winston Ave, Baton Rouge, LA 70809
$564
Cash flow
34.7%
Cash-on-Cash Return
13.7%
Cap rate
1.6%
Rent to Value Ratio
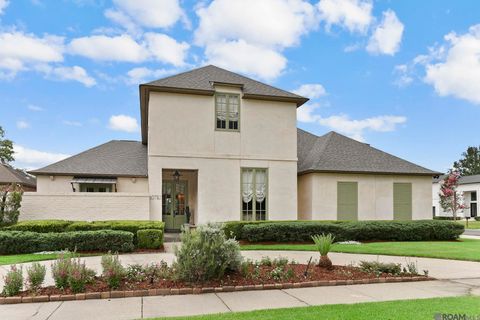
Active
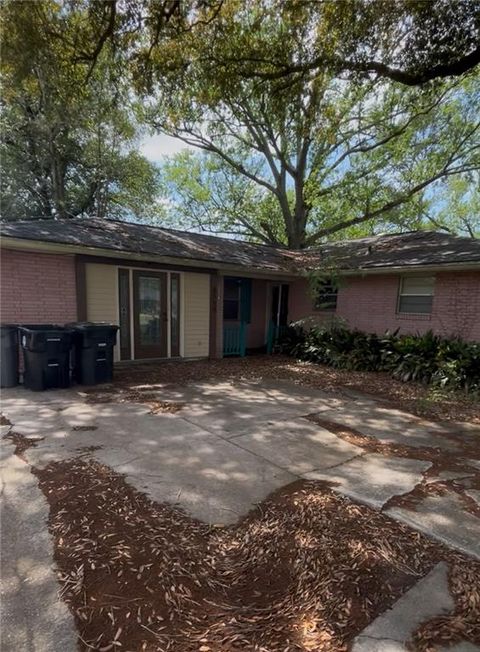
$195,000
3
bds
|
2
ba
|
1,656
sqft
|
built
1970
8554 S Essen Heights Ct, Baton Rouge, LA 70809
$388
Cash flow
10.4%
Cash-on-Cash Return
8.1%
Cap rate
1.0%
Rent to Value Ratio
56 out of 106 properties for sale in 70809
Limited Results Shown
Create a free account, or log in to reveal all property listings and enjoy the complete experience.
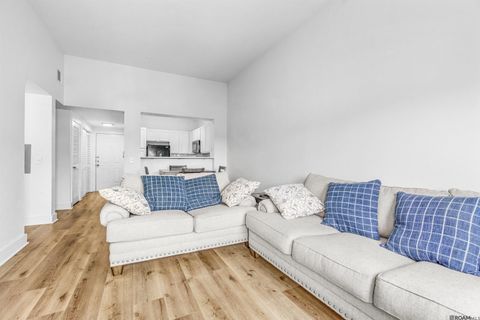
Active
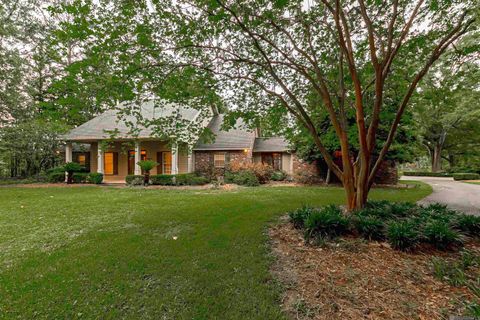
$615,000
3
bds
|
3
ba
|
3,158
sqft
|
built
2001
9611 Barringer Foreman Rd, Baton Rouge, LA 70809
$-978
Cash flow
-8.3%
Cash-on-Cash Return
3.8%
Cap rate
0.5%
Rent to Value Ratio
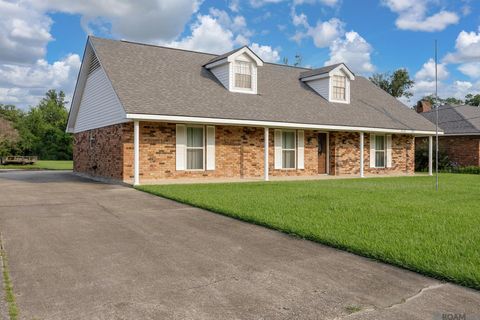
Active
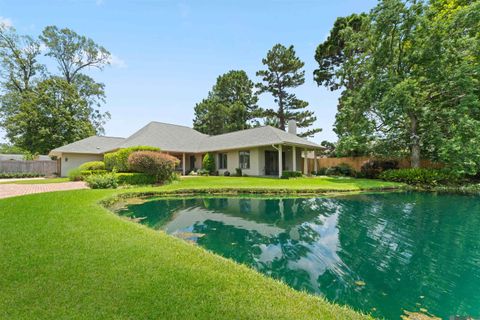
$780,000
3
bds
|
3
ba
|
3,956
sqft
|
built
1987
2141 Cove Ct, Baton Rouge, LA 70809
$-962
Cash flow
-6.4%
Cash-on-Cash Return
4.2%
Cap rate
0.5%
Rent to Value Ratio
Active
$178,500
2
bds
|
2
ba
|
1,357
sqft
|
built
1983
4151 Jefferson Woods Dr, Baton Rouge, LA 70809
$31
Cash flow
0.9%
Cash-on-Cash Return
5.9%
Cap rate
0.8%
Rent to Value Ratio
Active
$750,000
4
bds
|
3
ba
|
3,526
sqft
|
built
2005
10753 Oakline Dr, Baton Rouge, LA 70809
$-1,548
Cash flow
-10.8%
Cash-on-Cash Return
3.2%
Cap rate
0.4%
Rent to Value Ratio

Active
$1,350,000
3
bds
|
3
ba
|
4,204
sqft
|
built
1975
14 Stones Throw, Baton Rouge, LA 70809
$-3,948
Cash flow
-15.3%
Cash-on-Cash Return
2.2%
Cap rate
0.3%
Rent to Value Ratio
Active
$165,900
1
bds
|
1
ba
|
763
sqft
|
built
2005
6765 Corporate Blvd, Baton Rouge, LA 70809
$-247
Cash flow
-7.8%
Cash-on-Cash Return
3.9%
Cap rate
0.7%
Rent to Value Ratio
Active
$275,000
3
bds
|
3
ba
|
1,889
sqft
|
built
1973
5236 Floynell Dr, Baton Rouge, LA 70809
$79
Cash flow
1.5%
Cash-on-Cash Return
6.0%
Cap rate
0.7%
Rent to Value Ratio

Active
$675,000
3
bds
|
3
ba
|
2,470
sqft
|
built
2018
8741 Marques Ln, Baton Rouge, LA 70809
$-377
Cash flow
-2.9%
Cash-on-Cash Return
5.0%
Cap rate
0.6%
Rent to Value Ratio
Active
$1,295,000
4
bds
|
5
ba
|
4,464
sqft
|
built
2007
4509 Bluebonnet Rd, Baton Rouge, LA 70809
$-1,850
Cash flow
-7.5%
Cash-on-Cash Return
4.0%
Cap rate
0.5%
Rent to Value Ratio

Active
$389,500
4
bds
|
3
ba
|
2,283
sqft
|
built
1973
8932 Norfolk Dr, Baton Rouge, LA 70809
$-118
Cash flow
-1.6%
Cash-on-Cash Return
5.3%
Cap rate
0.6%
Rent to Value Ratio
Active
$599,000
4
bds
|
3
ba
|
3,279
sqft
|
built
2011
9050 Spring Grove Dr, Baton Rouge, LA 70809
$-177
Cash flow
-1.5%
Cash-on-Cash Return
5.3%
Cap rate
0.7%
Rent to Value Ratio

Active
$405,000
4
bds
|
3
ba
|
2,612
sqft
|
built
1978
3715 Pine Park Dr, Baton Rouge, LA 70809
$-123
Cash flow
-1.6%
Cash-on-Cash Return
5.3%
Cap rate
0.6%
Rent to Value Ratio

Active
$915,000
4
bds
|
4
ba
|
3,642
sqft
|
built
2006
19452 Oak Park Ct, Baton Rouge, LA 70809
$-1,896
Cash flow
-10.8%
Cash-on-Cash Return
3.2%
Cap rate
0.4%
Rent to Value Ratio

Active
$990,000
5
bds
|
6
ba
|
4,939
sqft
|
built
2006
19728 Southern Hills Ave, Baton Rouge, LA 70809
$-388
Cash flow
-2.0%
Cash-on-Cash Return
5.2%
Cap rate
0.6%
Rent to Value Ratio
Active
$599,999
2
bds
|
3
ba
|
3,252
sqft
|
built
2003
67 Jamestowne Ct, Baton Rouge, LA 70809
$-1,161
Cash flow
-10.1%
Cash-on-Cash Return
3.4%
Cap rate
0.5%
Rent to Value Ratio

Active
$1,235,000
4
bds
|
5
ba
|
3,942
sqft
|
built
1997
7027 Woodstock Dr, Baton Rouge, LA 70809
$-1,982
Cash flow
-8.4%
Cash-on-Cash Return
3.8%
Cap rate
0.5%
Rent to Value Ratio

Active
$925,000
3
bds
|
3
ba
|
2,755
sqft
|
built
1965
7160 Richards Dr, Baton Rouge, LA 70809
$-1,962
Cash flow
-11.1%
Cash-on-Cash Return
3.1%
Cap rate
0.4%
Rent to Value Ratio
Active
$220,000
3
bds
|
3
ba
|
1,521
sqft
|
built
1985
8416 E Cypress Point Ct, Baton Rouge, LA 70809
$151
Cash flow
3.6%
Cash-on-Cash Return
6.5%
Cap rate
0.8%
Rent to Value Ratio

Active
$449,000
4
bds
|
3
ba
|
2,446
sqft
|
built
2002
10417 Oakline Dr, Baton Rouge, LA 70809
$-429
Cash flow
-5.0%
Cash-on-Cash Return
4.5%
Cap rate
0.6%
Rent to Value Ratio
Active
$1,290,000
3
bds
|
5
ba
|
4,830
sqft
|
built
2010
10 Country Club Pl, Baton Rouge, LA 70809
$-4,096
Cash flow
-16.6%
Cash-on-Cash Return
1.9%
Cap rate
0.3%
Rent to Value Ratio

Active
$382,500
4
bds
|
3
ba
|
3,160
sqft
|
built
2005
10151 Sandhill Ct, Baton Rouge, LA 70809
$-248
Cash flow
-3.4%
Cash-on-Cash Return
4.9%
Cap rate
0.6%
Rent to Value Ratio

Active
$300,000
3
bds
|
3
ba
|
2,250
sqft
|
built
1987
4009 Downing Dr, Baton Rouge, LA 70809
$-178
Cash flow
-3.1%
Cash-on-Cash Return
5.0%
Cap rate
0.6%
Rent to Value Ratio

Active
$995,000
5
bds
|
6
ba
|
5,689
sqft
|
built
1992
2237 Dove Hollow Dr, Baton Rouge, LA 70809
$-391
Cash flow
-2.1%
Cash-on-Cash Return
5.2%
Cap rate
0.6%
Rent to Value Ratio

Active
$899,900
5
bds
|
4
ba
|
3,930
sqft
|
built
1967
3100 Fairway Dr, Baton Rouge, LA 70809
$-740
Cash flow
-4.3%
Cash-on-Cash Return
4.7%
Cap rate
0.6%
Rent to Value Ratio
Active
$694,500
4
bds
|
3
ba
|
3,555
sqft
|
built
1978
9302 Hilltrace Ave, Baton Rouge, LA 70809
$-1,198
Cash flow
-9.0%
Cash-on-Cash Return
3.6%
Cap rate
0.4%
Rent to Value Ratio

Active
$699,900
3
bds
|
3
ba
|
2,738
sqft
|
built
2005
2508 Bocage Lake Dr, Baton Rouge, LA 70809
$-719
Cash flow
-5.4%
Cash-on-Cash Return
4.4%
Cap rate
0.6%
Rent to Value Ratio

Active
$398,500
3
bds
|
3
ba
|
2,099
sqft
|
built
2006
8946 Fox Gate Dr, Baton Rouge, LA 70809
$-324
Cash flow
-4.2%
Cash-on-Cash Return
4.7%
Cap rate
0.6%
Rent to Value Ratio

Active
$599,000
3
bds
|
3
ba
|
2,951
sqft
|
built
2006
11011 Shoreline Dr, Baton Rouge, LA 70809
$-936
Cash flow
-8.2%
Cash-on-Cash Return
3.8%
Cap rate
0.5%
Rent to Value Ratio
Active
$230,000
3
bds
|
2
ba
|
1,502
sqft
|
built
1958
8261 Sholar Dr, Baton Rouge, LA 70809
$16
Cash flow
0.4%
Cash-on-Cash Return
5.8%
Cap rate
0.7%
Rent to Value Ratio
Active
$2,475,000
5
bds
|
6
ba
|
5,616
sqft
|
built
2007
6752 Fountain Ln, Baton Rouge, LA 70809
$-5,137
Cash flow
-10.8%
Cash-on-Cash Return
3.2%
Cap rate
0.4%
Rent to Value Ratio

Active
$2,595,000
6
bds
|
6
ba
|
5,822
sqft
|
built
2017
2930 Svendson Dr, Baton Rouge, LA 70809
$-6,091
Cash flow
-12.2%
Cash-on-Cash Return
2.9%
Cap rate
0.3%
Rent to Value Ratio
Active
$379,000
3
bds
|
2
ba
|
2,160
sqft
|
built
2004
11015 N Shoreline Ave, Baton Rouge, LA 70809
$-102
Cash flow
-1.4%
Cash-on-Cash Return
5.4%
Cap rate
0.7%
Rent to Value Ratio

Active
$496,000
3
bds
|
2
ba
|
2,439
sqft
|
built
2006
19405 Kelly Wood Ct, Baton Rouge, LA 70809
$-667
Cash flow
-7.0%
Cash-on-Cash Return
4.1%
Cap rate
0.5%
Rent to Value Ratio
Active
$409,500
3
bds
|
3
ba
|
2,179
sqft
|
built
2011
13322 Quail Grove Ave, Baton Rouge, LA 70809
$-238
Cash flow
-3.0%
Cash-on-Cash Return
5.0%
Cap rate
0.6%
Rent to Value Ratio
Active
$1,050,000
4
bds
|
3
ba
|
3,256
sqft
|
built
1956
7375 Boyce Dr, Baton Rouge, LA 70809
$-693
Cash flow
-3.4%
Cash-on-Cash Return
4.9%
Cap rate
0.6%
Rent to Value Ratio
Active
$216,000
3
bds
|
3
ba
|
1,569
sqft
|
built
1995
9827 E Groner Ave, Baton Rouge, LA 70809
$-99
Cash flow
-2.4%
Cash-on-Cash Return
5.1%
Cap rate
0.8%
Rent to Value Ratio

Active
$185,000
2
bds
|
2
ba
|
1,018
sqft
|
built
2005
6765 Corporate Blvd, Baton Rouge, LA 70809
$-222
Cash flow
-6.3%
Cash-on-Cash Return
4.2%
Cap rate
0.8%
Rent to Value Ratio
Active
$819,900
4
bds
|
4
ba
|
3,958
sqft
|
built
2005
19027 Spyglass Hill Dr, Baton Rouge, LA 70809
$-1,454
Cash flow
-9.3%
Cash-on-Cash Return
3.6%
Cap rate
0.4%
Rent to Value Ratio