70810 Investment Properties for Sale
Browse homes for sale and investment properties in 70810. Refine your search by price, property type, or more.
Best cash flowing properties in 70810
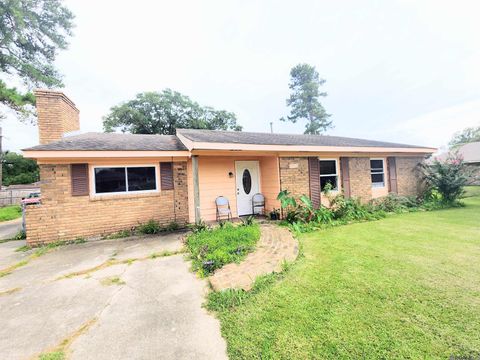
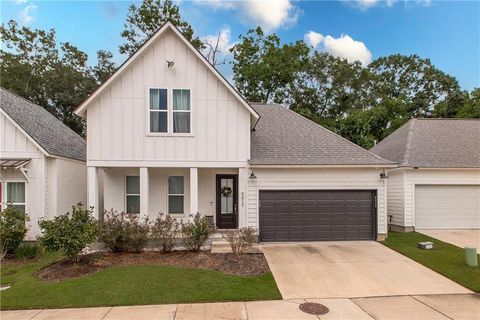
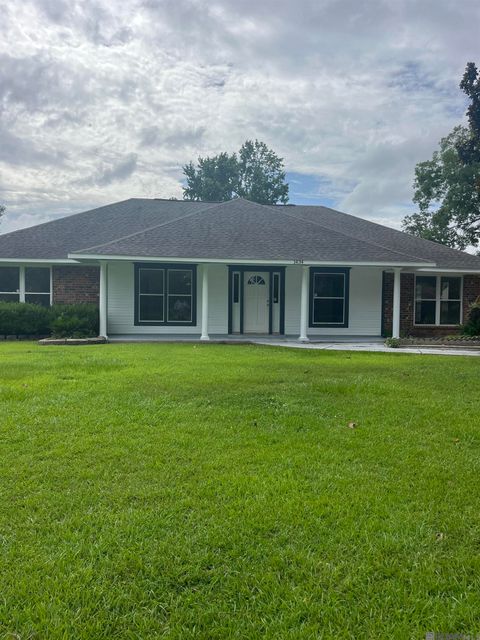
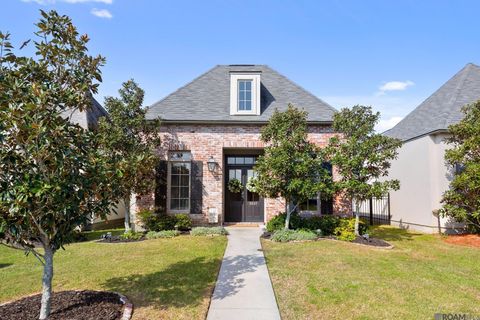
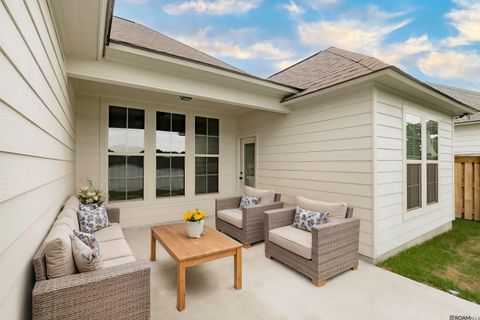
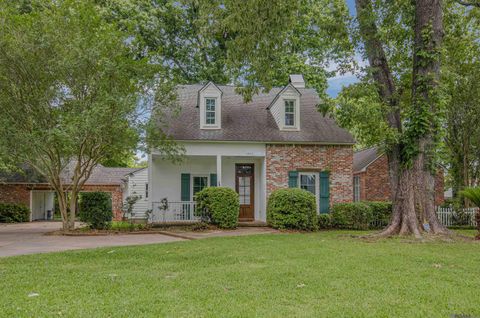
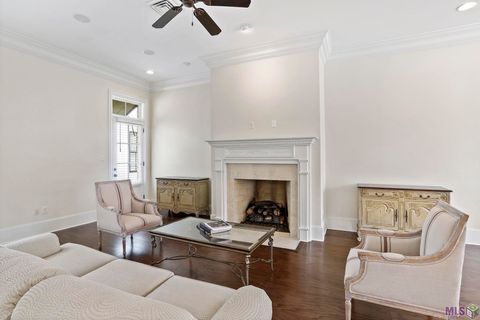
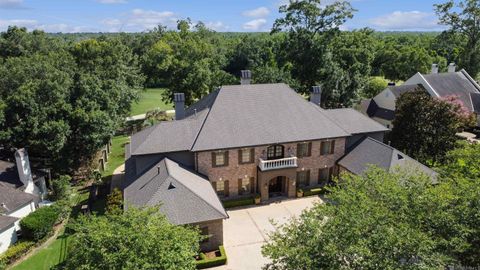
Active
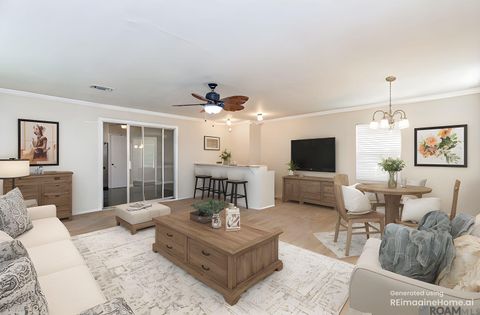
$170,000
3
bds
|
3
ba
|
1,717
sqft
|
built
1970
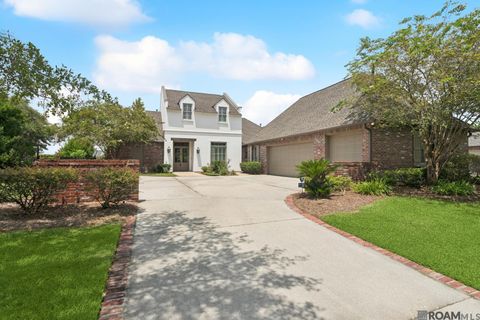
1220 Doolittle Dr, Baton Rouge, LA 70810
$300
Cash flow
9.2%
Cash-on-Cash Return
7.8%
Cap rate
0.9%
Rent to Value Ratio
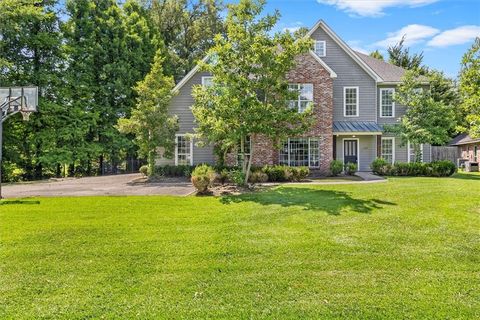
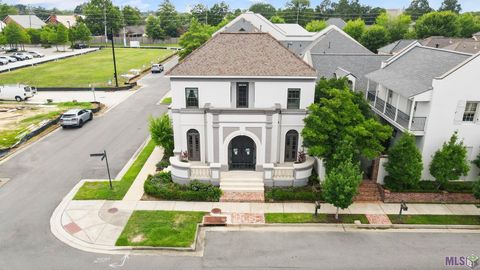
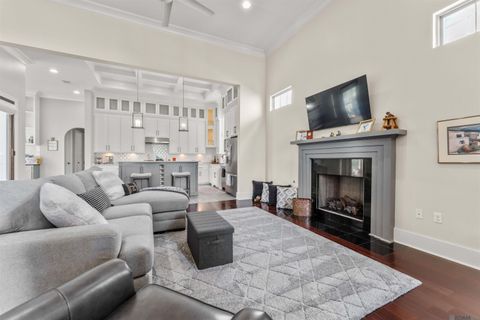
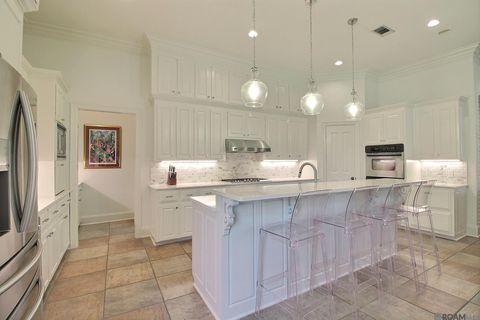
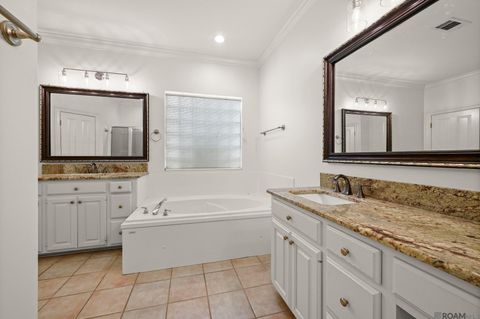
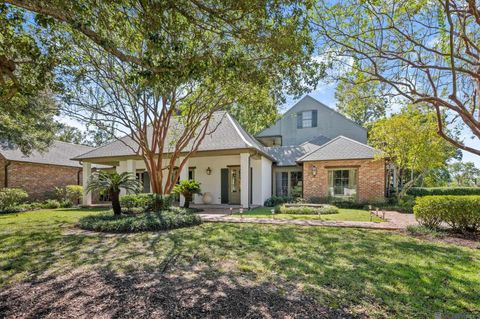
Active
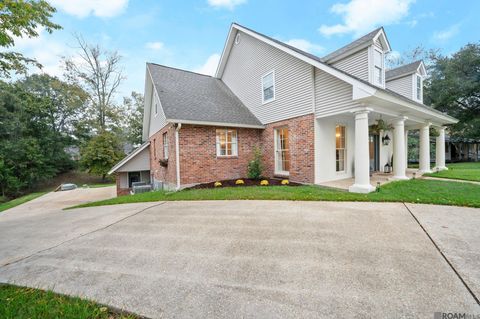
$670,000
4
bds
|
3
ba
|
3,714
sqft
|
built
1989
433 Jean Lafitte Ave, Baton Rouge, LA 70810
$279
Cash flow
2.2%
Cash-on-Cash Return
6.2%
Cap rate
0.7%
Rent to Value Ratio
150 out of 173 properties for sale in 70810
Limited Results Shown
Create a free account, or log in to reveal all property listings and enjoy the complete experience.
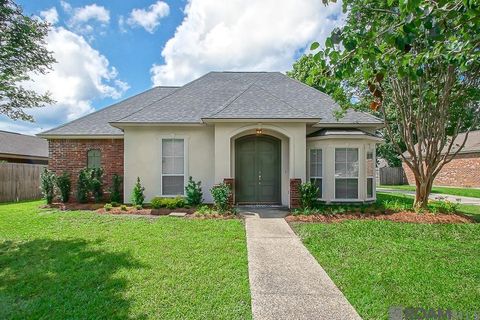
Active
$580,000
3
bds
|
3
ba
|
2,273
sqft
|
built
2017
10723 Turning Leaf Dr, Baton Rouge, LA 70810
$-662
Cash flow
-6.0%
Cash-on-Cash Return
4.3%
Cap rate
0.6%
Rent to Value Ratio
Active
$185,000
3
bds
|
3
ba
|
1,449
sqft
|
built
2006
10600 Lakes Blvd, Baton Rouge, LA 70810
$229
Cash flow
6.5%
Cash-on-Cash Return
7.2%
Cap rate
0.9%
Rent to Value Ratio
Active
$399,900
4
bds
|
3
ba
|
2,342
sqft
|
built
2019
9017 Stonecroft Ave, Baton Rouge, LA 70810
$-10
Cash flow
-0.1%
Cash-on-Cash Return
5.6%
Cap rate
0.7%
Rent to Value Ratio
Active
$650,000
4
bds
|
4
ba
|
3,149
sqft
|
built
1993
647 Highland Oaks Dr, Baton Rouge, LA 70810
$-686
Cash flow
-5.5%
Cash-on-Cash Return
4.4%
Cap rate
0.5%
Rent to Value Ratio
Active
$275,000
4
bds
|
2
ba
|
1,633
sqft
|
built
2006
3346 Southlake Ave, Baton Rouge, LA 70810
$37
Cash flow
0.7%
Cash-on-Cash Return
5.8%
Cap rate
0.7%
Rent to Value Ratio
Active
$345,000
4
bds
|
3
ba
|
2,011
sqft
|
built
2022
10810 Maitland Ave, Baton Rouge, LA 70810
$114
Cash flow
1.7%
Cash-on-Cash Return
6.1%
Cap rate
0.8%
Rent to Value Ratio
Active
$210,000
4
bds
|
2
ba
|
2,049
sqft
|
built
1974
1814 Mc Quaid Dr, Baton Rouge, LA 70810
$110
Cash flow
2.7%
Cash-on-Cash Return
6.3%
Cap rate
0.8%
Rent to Value Ratio
Active
$649,900
6
bds
|
5
ba
|
3,539
sqft
|
built
1994
10813 N Oak Hills Pkwy, Baton Rouge, LA 70810
$-406
Cash flow
-3.3%
Cash-on-Cash Return
4.9%
Cap rate
0.6%
Rent to Value Ratio
Active
$824,900
4
bds
|
3
ba
|
3,500
sqft
|
built
1990
18040 Cascades Ave, Baton Rouge, LA 70810
$-1,695
Cash flow
-10.7%
Cash-on-Cash Return
3.2%
Cap rate
0.4%
Rent to Value Ratio
Active
$174,900
3
bds
|
2
ba
|
1,381
sqft
|
built
1975
1837 General Mouton Ave, Baton Rouge, LA 70810
$138
Cash flow
4.1%
Cash-on-Cash Return
6.6%
Cap rate
0.8%
Rent to Value Ratio
Active
$329,500
4
bds
|
2
ba
|
2,106
sqft
|
built
1984
1434 Charing Cross Dr, Baton Rouge, LA 70810
$-179
Cash flow
-2.8%
Cash-on-Cash Return
5.0%
Cap rate
0.6%
Rent to Value Ratio
Active
$745,000
3
bds
|
3
ba
|
3,201
sqft
|
built
2016
8164 Willow Grove Blvd, Baton Rouge, LA 70810
$-822
Cash flow
-5.8%
Cash-on-Cash Return
4.4%
Cap rate
0.6%
Rent to Value Ratio
Active
$340,500
3
bds
|
2
ba
|
1,784
sqft
|
built
2015
3127 Cypress View Ln, Baton Rouge, LA 70810
$39
Cash flow
0.6%
Cash-on-Cash Return
5.8%
Cap rate
0.7%
Rent to Value Ratio
Active
$819,000
4
bds
|
4
ba
|
3,530
sqft
|
built
2019
13621 Brook Point Dr, Baton Rouge, LA 70810
$-53
Cash flow
-0.3%
Cash-on-Cash Return
5.6%
Cap rate
0.7%
Rent to Value Ratio
Active
$321,900
3
bds
|
2
ba
|
1,782
sqft
|
built
2017
2637 Cresthaven Ave, Baton Rouge, LA 70810
$-494
Cash flow
-8.0%
Cash-on-Cash Return
3.8%
Cap rate
0.5%
Rent to Value Ratio
Active
$459,000
4
bds
|
4
ba
|
2,687
sqft
|
built
1981
435 Corsair Dr, Baton Rouge, LA 70810
$-240
Cash flow
-2.7%
Cash-on-Cash Return
5.1%
Cap rate
0.6%
Rent to Value Ratio
Active
$659,000
4
bds
|
4
ba
|
3,619
sqft
|
built
2004
14923 Memorial Tower Dr, Baton Rouge, LA 70810
$-507
Cash flow
-4.0%
Cash-on-Cash Return
4.8%
Cap rate
0.6%
Rent to Value Ratio
Active
$970,000
5
bds
|
4
ba
|
4,139
sqft
|
built
2005
10321 N Lake Estates Ave, Baton Rouge, LA 70810
$-2,175
Cash flow
-11.7%
Cash-on-Cash Return
3.0%
Cap rate
0.4%
Rent to Value Ratio
Active
$395,000
4
bds
|
3
ba
|
2,038
sqft
|
built
2018
12503 Great Tern Ave, Baton Rouge, LA 70810
$30
Cash flow
0.4%
Cash-on-Cash Return
5.8%
Cap rate
0.7%
Rent to Value Ratio
Active
$574,000
4
bds
|
3
ba
|
2,775
sqft
|
built
1996
8540 Mosswood Ave, Baton Rouge, LA 70810
$-805
Cash flow
-7.3%
Cash-on-Cash Return
4.0%
Cap rate
0.5%
Rent to Value Ratio
Active
$237,500
2
bds
|
3
ba
|
1,440
sqft
|
built
2005
1329 Bromley Park Dr, Baton Rouge, LA 70810
$-57
Cash flow
-1.3%
Cash-on-Cash Return
5.4%
Cap rate
0.8%
Rent to Value Ratio
Active
$340,000
4
bds
|
2
ba
|
1,828
sqft
|
built
2017
14056 Park Terrace Dr, Baton Rouge, LA 70810
$83
Cash flow
1.3%
Cash-on-Cash Return
6.0%
Cap rate
0.7%
Rent to Value Ratio
Active
$530,000
4
bds
|
4
ba
|
3,004
sqft
|
built
1990
14513 N Majestic Oaks Pl, Baton Rouge, LA 70810
$-377
Cash flow
-3.7%
Cash-on-Cash Return
4.8%
Cap rate
0.6%
Rent to Value Ratio
Active
$539,500
3
bds
|
2
ba
|
2,130
sqft
|
built
2014
10726 Preservation Way, Baton Rouge, LA 70810
$-746
Cash flow
-7.2%
Cash-on-Cash Return
4.0%
Cap rate
0.5%
Rent to Value Ratio
Active
$949,000
5
bds
|
4
ba
|
4,375
sqft
|
built
2003
413 Longmeadow Dr, Baton Rouge, LA 70810
$-608
Cash flow
-3.3%
Cash-on-Cash Return
4.9%
Cap rate
0.6%
Rent to Value Ratio
Active
$359,900
3
bds
|
3
ba
|
1,909
sqft
|
built
1999
10673 Hillshire Ave, Baton Rouge, LA 70810
$-218
Cash flow
-3.2%
Cash-on-Cash Return
5.0%
Cap rate
0.6%
Rent to Value Ratio
Active
$1,250,000
4
bds
|
4
ba
|
5,180
sqft
|
built
2010
11447 Center Court Blvd, Baton Rouge, LA 70810
$-2,038
Cash flow
-8.5%
Cash-on-Cash Return
3.7%
Cap rate
0.5%
Rent to Value Ratio
Active
$405,000
4
bds
|
3
ba
|
2,160
sqft
|
built
2003
10721 Hillmont Ave, Baton Rouge, LA 70810
$-360
Cash flow
-4.6%
Cash-on-Cash Return
4.6%
Cap rate
0.6%
Rent to Value Ratio
Active
$935,000
5
bds
|
5
ba
|
4,220
sqft
|
built
1998
13415 Highland Rd, Baton Rouge, LA 70810
$-578
Cash flow
-3.2%
Cash-on-Cash Return
4.9%
Cap rate
0.6%
Rent to Value Ratio
Active
$368,000
3
bds
|
2
ba
|
2,037
sqft
|
built
2010
2145 Hillridge Ave, Baton Rouge, LA 70810
$158
Cash flow
2.2%
Cash-on-Cash Return
6.2%
Cap rate
0.8%
Rent to Value Ratio
Active
$884,900
4
bds
|
3
ba
|
3,985
sqft
|
built
2008
14628 Memorial Tower Dr, Baton Rouge, LA 70810
$-541
Cash flow
-3.2%
Cash-on-Cash Return
4.9%
Cap rate
0.6%
Rent to Value Ratio
Active
$407,000
4
bds
|
3
ba
|
2,076
sqft
|
built
2014
14536 Market North Dr, Baton Rouge, LA 70810
$25
Cash flow
0.3%
Cash-on-Cash Return
5.8%
Cap rate
0.7%
Rent to Value Ratio
Active
$236,900
4
bds
|
2
ba
|
1,640
sqft
|
built
1979
1638 Mary Ellen Dr, Baton Rouge, LA 70810
$52
Cash flow
1.1%
Cash-on-Cash Return
5.9%
Cap rate
0.7%
Rent to Value Ratio
Active
$669,900
4
bds
|
4
ba
|
2,947
sqft
|
built
2017
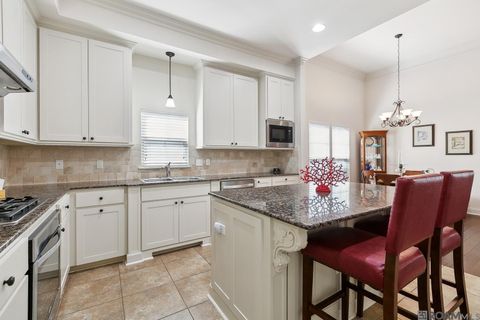
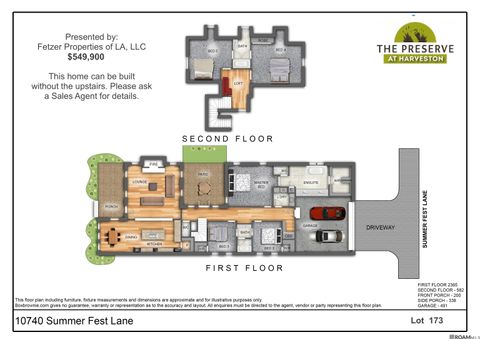
10740 Summer Fest Ln, Baton Rouge, LA 70810
$-880
Cash flow
-6.9%
Cash-on-Cash Return
4.1%
Cap rate
0.5%
Rent to Value Ratio
Active
$2,995,000
6
bds
|
8
ba
|
8,434
sqft
|
built
1999
18424 S Mission Hills Ave, Baton Rouge, LA 70810
$-12,861
Cash flow
-22.4%
Cash-on-Cash Return
0.5%
Cap rate
0.1%
Rent to Value Ratio
Active
$399,900
4
bds
|
4
ba
|
3,110
sqft
|
built
1977
12037 Oak Haven Ave, Baton Rouge, LA 70810
$40
Cash flow
0.5%
Cash-on-Cash Return
5.8%
Cap rate
0.7%
Rent to Value Ratio
Active
$1,950,000
4
bds
|
5
ba
|
6,067
sqft
|
built
2001
16026 Highland Bluff Ct, Baton Rouge, LA 70810
$-6,558
Cash flow
-17.5%
Cash-on-Cash Return
1.6%
Cap rate
0.2%
Rent to Value Ratio
Active
$1,100,000
5
bds
|
5
ba
|
3,765
sqft
|
built
2016
11682 Silo Dr, Baton Rouge, LA 70810
$-1,053
Cash flow
-5.0%
Cash-on-Cash Return
4.5%
Cap rate
0.6%
Rent to Value Ratio