72205 Investment Properties for Sale
Browse homes for sale and investment properties in 72205. Refine your search by price, property type, or more.
Best cash flowing properties in 72205
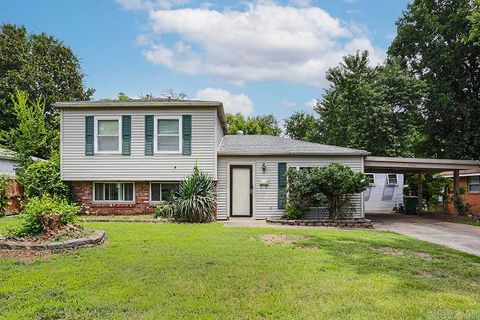
Active
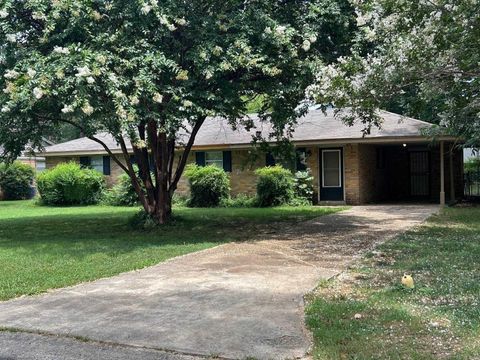
$165,000
3
bds
|
2
ba
|
1,620
sqft
|
built
1960
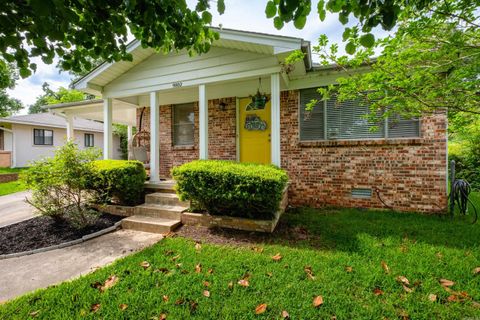
8806 Mayflower Rd, Little Rock, AR 72205
$176
Cash flow
5.6%
Cash-on-Cash Return
7.0%
Cap rate
1.0%
Rent to Value Ratio

Active
$149,900
3
bds
|
1
ba
|
1,008
sqft
|
built
1960
323 Santa Fe Trl, Little Rock, AR 72205
$147
Cash flow
5.1%
Cash-on-Cash Return
6.9%
Cap rate
0.9%
Rent to Value Ratio
60 out of 71 properties for sale in 72205
Limited Results Shown
Create a free account, or log in to reveal all property listings and enjoy the complete experience.

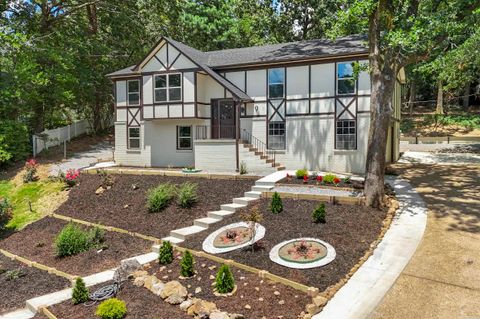
Active
$459,500
3
bds
|
2
ba
|
2,236
sqft
|
built
1930
118 N Pine St, Little Rock, AR 72205
$-1,266
Cash flow
-14.4%
Cash-on-Cash Return
2.4%
Cap rate
0.4%
Rent to Value Ratio
Active
$179,000
3
bds
|
2
ba
|
1,622
sqft
|
built
1964
618 S Mississippi St, Little Rock, AR 72205
$144
Cash flow
4.2%
Cash-on-Cash Return
6.6%
Cap rate
0.9%
Rent to Value Ratio
Active
$255,000
2
bds
|
1
ba
|
1,192
sqft
|
built
1928
223 S Maple St, Little Rock, AR 72205
$-234
Cash flow
-4.8%
Cash-on-Cash Return
4.6%
Cap rate
0.6%
Rent to Value Ratio

Active
$574,900
4
bds
|
3
ba
|
2,908
sqft
|
built
1920
102 Midland St, Little Rock, AR 72205
$-1,602
Cash flow
-14.5%
Cash-on-Cash Return
2.3%
Cap rate
0.5%
Rent to Value Ratio
Active
$299,000
3
bds
|
3
ba
|
1,952
sqft
|
built
1920
100 Rice St, Little Rock, AR 72205
$-407
Cash flow
-7.1%
Cash-on-Cash Return
4.0%
Cap rate
0.6%
Rent to Value Ratio

Active
$219,000
3
bds
|
3
ba
|
1,860
sqft
|
built
1960
9605 Brooks Ct, Little Rock, AR 72205
$-75
Cash flow
-1.8%
Cash-on-Cash Return
5.3%
Cap rate
0.7%
Rent to Value Ratio
Active
$161,000
3
bds
|
2
ba
|
1,118
sqft
|
built
1963
9802 Temple Dr, Little Rock, AR 72205
$78
Cash flow
2.5%
Cash-on-Cash Return
6.3%
Cap rate
0.9%
Rent to Value Ratio

Active
$179,000
2
bds
|
1
ba
|
1,192
sqft
|
built
1950
515 N Fillmore St, Little Rock, AR 72205
$-11
Cash flow
-0.3%
Cash-on-Cash Return
5.6%
Cap rate
0.9%
Rent to Value Ratio

Active
$225,000
3
bds
|
2
ba
|
1,750
sqft
|
built
1961
7517 Apache Rd, Little Rock, AR 72205
$-150
Cash flow
-3.5%
Cash-on-Cash Return
4.9%
Cap rate
0.7%
Rent to Value Ratio

Active
$399,000
3
bds
|
2
ba
|
1,700
sqft
|
built
1950
5124 Woodlawn Dr, Little Rock, AR 72205
$-1,306
Cash flow
-17.1%
Cash-on-Cash Return
1.8%
Cap rate
0.3%
Rent to Value Ratio

Active
$250,000
4
bds
|
2
ba
|
1,900
sqft
|
built
1963
112 Fountain Ave, Little Rock, AR 72205
$-453
Cash flow
-9.5%
Cash-on-Cash Return
3.5%
Cap rate
0.5%
Rent to Value Ratio
Active
$395,000
3
bds
|
3
ba
|
1,906
sqft
|
built
1923
1000 N Tyler St, Little Rock, AR 72205
$-738
Cash flow
-9.7%
Cash-on-Cash Return
3.4%
Cap rate
0.5%
Rent to Value Ratio

Active
$399,900
4
bds
|
4
ba
|
3,580
sqft
|
built
1963
7011 W Markham St, Little Rock, AR 72205
$-824
Cash flow
-10.8%
Cash-on-Cash Return
3.2%
Cap rate
0.5%
Rent to Value Ratio

Active
$395,000
4
bds
|
4
ba
|
2,169
sqft
|
built
1959
212 N Jackson St, Little Rock, AR 72205
$-622
Cash flow
-8.2%
Cash-on-Cash Return
3.8%
Cap rate
0.5%
Rent to Value Ratio

Active
$199,000
3
bds
|
2
ba
|
1,255
sqft
|
built
1966
5 Kordsmeier Ct, Little Rock, AR 72205
$-65
Cash flow
-1.7%
Cash-on-Cash Return
5.3%
Cap rate
0.7%
Rent to Value Ratio

Active
$299,000
4
bds
|
2
ba
|
2,021
sqft
|
built
1961
7 Brookfield Cv, Little Rock, AR 72205
$-491
Cash flow
-8.6%
Cash-on-Cash Return
3.7%
Cap rate
0.5%
Rent to Value Ratio

Active
$150,000
3
bds
|
2
ba
|
1,256
sqft
|
built
1966
1515 E Twin Lakes Dr, Little Rock, AR 72205
$21
Cash flow
0.7%
Cash-on-Cash Return
5.8%
Cap rate
0.8%
Rent to Value Ratio

Active
$214,900
3
bds
|
3
ba
|
1,811
sqft
|
built
1965
1720 Glenda Dr, Little Rock, AR 72205
$-41
Cash flow
-1.0%
Cash-on-Cash Return
5.4%
Cap rate
0.7%
Rent to Value Ratio

Active
$699,900
4
bds
|
4
ba
|
3,163
sqft
|
built
2016
1017 N Fillmore St, Little Rock, AR 72205
$-1,569
Cash flow
-11.7%
Cash-on-Cash Return
3.0%
Cap rate
0.5%
Rent to Value Ratio

Active
$145,000
3
bds
|
1
ba
|
988
sqft
|
built
1962
5 Laurice Cir, Little Rock, AR 72205
$15
Cash flow
0.5%
Cash-on-Cash Return
5.8%
Cap rate
0.8%
Rent to Value Ratio

Active
$317,000
3
bds
|
2
ba
|
1,976
sqft
|
built
1977
508 N Coolidge St, Little Rock, AR 72205
$-539
Cash flow
-8.9%
Cash-on-Cash Return
3.6%
Cap rate
0.5%
Rent to Value Ratio

Active
$300,000
3
bds
|
2
ba
|
1,750
sqft
|
built
1945
1100 N Polk St, Little Rock, AR 72205
$-324
Cash flow
-5.6%
Cash-on-Cash Return
4.4%
Cap rate
0.7%
Rent to Value Ratio

Active
$273,000
3
bds
|
1
ba
|
1,372
sqft
|
built
1934
110 N Cedar St, Little Rock, AR 72205
$-311
Cash flow
-5.9%
Cash-on-Cash Return
4.3%
Cap rate
0.7%
Rent to Value Ratio

Active
$163,000
3
bds
|
2
ba
|
1,513
sqft
|
built
1955
6900 W Markham St, Little Rock, AR 72205
$97
Cash flow
3.1%
Cash-on-Cash Return
6.4%
Cap rate
0.9%
Rent to Value Ratio

Active
$229,000
3
bds
|
2
ba
|
1,628
sqft
|
built
1950
107 N Summit St, Little Rock, AR 72205
$146
Cash flow
3.3%
Cash-on-Cash Return
6.4%
Cap rate
0.8%
Rent to Value Ratio

Active
$597,500
3
bds
|
3
ba
|
2,448
sqft
|
built
1912
5216 I St, Little Rock, AR 72205
$-1,765
Cash flow
-15.4%
Cash-on-Cash Return
2.1%
Cap rate
0.4%
Rent to Value Ratio
Active
$299,950
3
bds
|
3
ba
|
2,046
sqft
|
built
1964
22 Nob View Cir, Little Rock, AR 72205
$-430
Cash flow
-7.5%
Cash-on-Cash Return
4.0%
Cap rate
0.6%
Rent to Value Ratio

Active
$218,500
3
bds
|
1
ba
|
1,450
sqft
|
built
1953
201 Dennison St, Little Rock, AR 72205
$-186
Cash flow
-4.4%
Cash-on-Cash Return
4.7%
Cap rate
0.7%
Rent to Value Ratio

Active
$239,500
4
bds
|
2
ba
|
2,064
sqft
|
built
1963
8304 Red Oak Ln, Little Rock, AR 72205
$-79
Cash flow
-1.7%
Cash-on-Cash Return
5.3%
Cap rate
0.8%
Rent to Value Ratio

Active
$440,000
4
bds
|
3
ba
|
2,324
sqft
|
built
1925
4119 Lee Ave, Little Rock, AR 72205
$-720
Cash flow
-8.5%
Cash-on-Cash Return
3.7%
Cap rate
0.6%
Rent to Value Ratio

Active
$239,900
3
bds
|
1
ba
|
1,460
sqft
|
built
1934
104 N Cedar St, Little Rock, AR 72205
$-156
Cash flow
-3.4%
Cash-on-Cash Return
4.9%
Cap rate
0.8%
Rent to Value Ratio
Active
$314,500
4
bds
|
3
ba
|
2,218
sqft
|
built
1964
516 N Coolidge St, Little Rock, AR 72205
$-563
Cash flow
-9.3%
Cash-on-Cash Return
3.5%
Cap rate
0.5%
Rent to Value Ratio
Active
$169,900
3
bds
|
2
ba
|
1,404
sqft
|
built
1959
409 Sunnymeade Dr, Little Rock, AR 72205
$129
Cash flow
4.0%
Cash-on-Cash Return
6.6%
Cap rate
0.9%
Rent to Value Ratio

Active
$179,000
3
bds
|
2
ba
|
1,466
sqft
|
built
1962
4 Brookridge Cv, Little Rock, AR 72205
$102
Cash flow
3.0%
Cash-on-Cash Return
6.4%
Cap rate
0.9%
Rent to Value Ratio

Active
$289,900
4
bds
|
3
ba
|
2,116
sqft
|
built
1959
618 Hall Dr, Little Rock, AR 72205
$-342
Cash flow
-6.2%
Cash-on-Cash Return
4.3%
Cap rate
0.6%
Rent to Value Ratio

Active
$281,990
4
bds
|
2
ba
|
2,650
sqft
|
built
1964
323 Auburn Dr, Little Rock, AR 72205
$-385
Cash flow
-7.1%
Cash-on-Cash Return
4.0%
Cap rate
0.6%
Rent to Value Ratio

Active
$162,500
3
bds
|
2
ba
|
1,519
sqft
|
built
1960
423 Brookside Dr, Little Rock, AR 72205
$54
Cash flow
1.7%
Cash-on-Cash Return
6.1%
Cap rate
0.9%
Rent to Value Ratio
Active
$374,900
5
bds
|
3
ba
|
2,486
sqft
|
built
1970
9 Brookfield Cv, Little Rock, AR 72205
$-1,023
Cash flow
-14.2%
Cash-on-Cash Return
2.4%
Cap rate
0.4%
Rent to Value Ratio