73103 Investment Properties for Sale
Browse homes for sale and investment properties in 73103. Refine your search by price, property type, or more.
Best cash flowing properties in 73103
Active
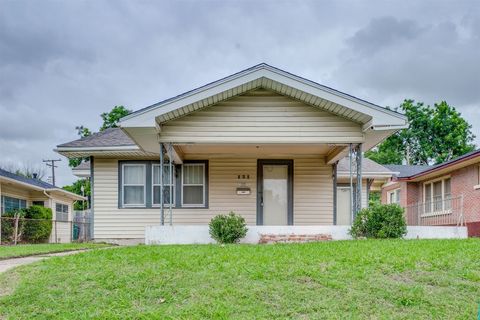
$167,000
1
bds
|
1
ba
|
0
sqft
|
built
1921
121 NW 26th St, Oklahoma City, OK 73103
$82
Cash flow
2.6%
Cash-on-Cash Return
6.3%
Cap rate
0.8%
Rent to Value Ratio
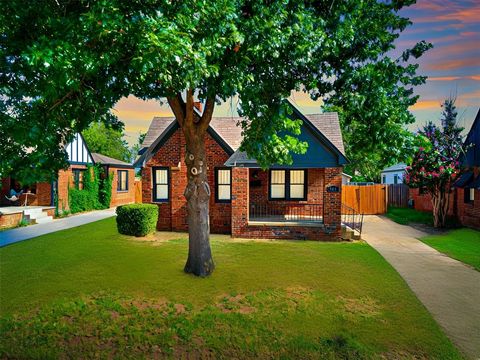
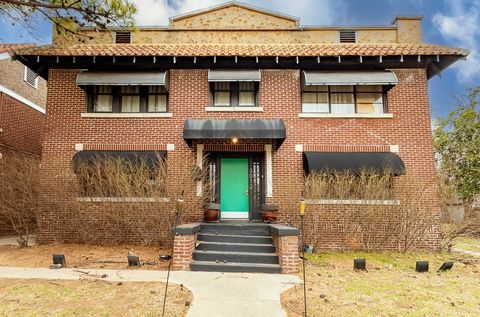
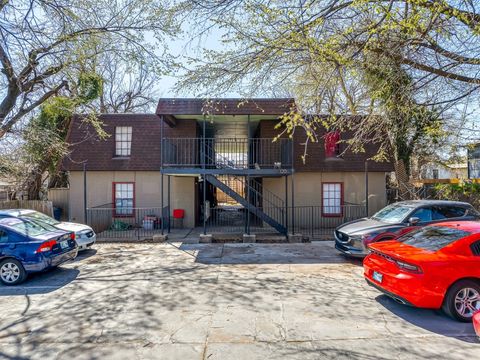
Active
$275,000
2
bds
|
1
ba
|
0
sqft
|
built
1929
721 NW 26th St, Oklahoma City, OK 73103
$-199
Cash flow
-3.8%
Cash-on-Cash Return
4.8%
Cap rate
0.7%
Rent to Value Ratio
23 out of 34 properties for sale in 73103
Limited Results Shown
Create a free account, or log in to reveal all property listings and enjoy the complete experience.
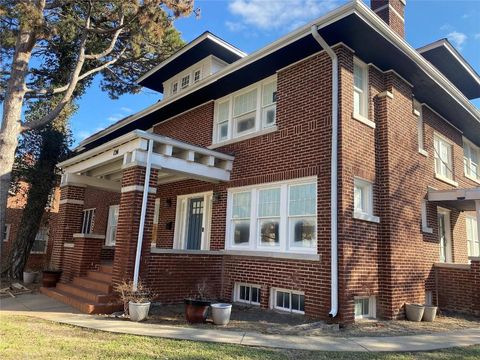
Active
$1,325,000
9
bds
|
11
ba
|
0
sqft
|
built
1902
124 NW 15th St, Oklahoma City, OK 73103
$-4,014
Cash flow
-15.8%
Cash-on-Cash Return
2.0%
Cap rate
0.3%
Rent to Value Ratio
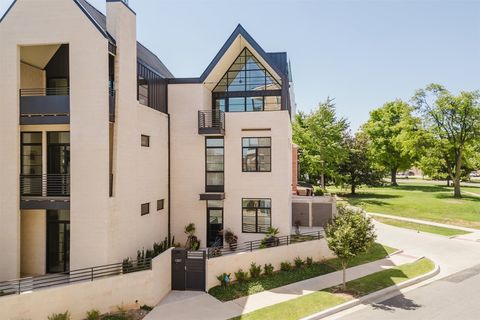
Active
$1,049,000
3
bds
|
4
ba
|
0
sqft
|
built
2021
1327 N Dewey Ave, Oklahoma City, OK 73103
$-4,018
Cash flow
-20.0%
Cash-on-Cash Return
1.1%
Cap rate
0.3%
Rent to Value Ratio
Active
$889,000
6
bds
|
4
ba
|
0
sqft
|
built
1910
720 NW 16th St, Oklahoma City, OK 73103
$-1,199
Cash flow
-7.0%
Cash-on-Cash Return
4.1%
Cap rate
0.6%
Rent to Value Ratio
Active
$1,095,000
3
bds
|
3
ba
|
0
sqft
|
built
1922
401 NW 20th St, Oklahoma City, OK 73103
$-4,072
Cash flow
-19.4%
Cash-on-Cash Return
1.2%
Cap rate
0.3%
Rent to Value Ratio
Active
$469,900
3
bds
|
3
ba
|
0
sqft
|
built
1925
121 NW 27th St, Oklahoma City, OK 73103
$-605
Cash flow
-6.7%
Cash-on-Cash Return
4.1%
Cap rate
0.6%
Rent to Value Ratio

Active
$1,995,000
5
bds
|
6
ba
|
0
sqft
|
built
1905
1415 N Hudson Ave, Oklahoma City, OK 73103
$-8,465
Cash flow
-22.1%
Cash-on-Cash Return
0.6%
Cap rate
0.2%
Rent to Value Ratio
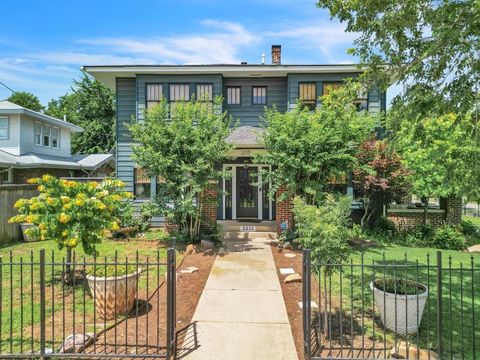
Active
$519,000
3
bds
|
3
ba
|
0
sqft
|
built
1923
427 NW 22nd St, Oklahoma City, OK 73103
$-1,257
Cash flow
-12.6%
Cash-on-Cash Return
2.8%
Cap rate
0.4%
Rent to Value Ratio

Active
$499,000
4
bds
|
4
ba
|
0
sqft
|
built
1909
601 NW 17th St, Oklahoma City, OK 73103
$-646
Cash flow
-6.8%
Cash-on-Cash Return
4.1%
Cap rate
0.6%
Rent to Value Ratio
Active
$698,500
1
bds
|
3
ba
|
0
sqft
|
built
1925
3012 N Robinson Ave, Oklahoma City, OK 73103
$-2,109
Cash flow
-15.8%
Cash-on-Cash Return
2.1%
Cap rate
0.4%
Rent to Value Ratio
Active
$419,000
3
bds
|
4
ba
|
0
sqft
|
built
1920
200 NW 21st St, Oklahoma City, OK 73103
$-704
Cash flow
-8.8%
Cash-on-Cash Return
3.7%
Cap rate
0.6%
Rent to Value Ratio
Active
$838,000
3
bds
|
3
ba
|
0
sqft
|
built
1922
201 NW 18th St, Oklahoma City, OK 73103
$-1,776
Cash flow
-11.1%
Cash-on-Cash Return
3.1%
Cap rate
0.5%
Rent to Value Ratio

Active
$1,300,000
3
bds
|
4
ba
|
0
sqft
|
built
2024
1303 N Dewey Ave, Oklahoma City, OK 73103
$-4,940
Cash flow
-19.8%
Cash-on-Cash Return
1.1%
Cap rate
0.3%
Rent to Value Ratio

Active
$1,300,000
2
bds
|
4
ba
|
0
sqft
|
built
2024
1201 N Dewey Ave, Oklahoma City, OK 73103
$-3,327
Cash flow
-13.4%
Cash-on-Cash Return
2.6%
Cap rate
0.4%
Rent to Value Ratio
Active
$999,900
14
bds
|
14
ba
|
0
sqft
|
built
1924
225 NW 24th St, Oklahoma City, OK 73103
$-4,379
Cash flow
-22.8%
Cash-on-Cash Return
0.4%
Cap rate
0.2%
Rent to Value Ratio
Active
$725,000
8
bds
|
8
ba
|
0
sqft
|
built
1968
120 NW 17th St, Oklahoma City, OK 73103
$-2,546
Cash flow
-18.3%
Cash-on-Cash Return
1.5%
Cap rate
0.2%
Rent to Value Ratio
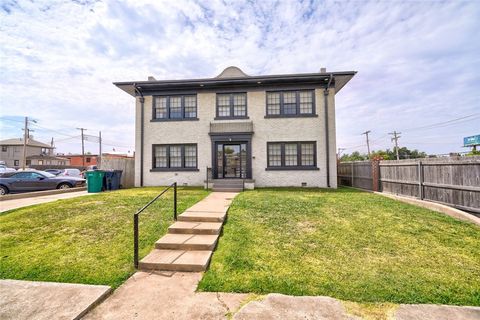
Active
$549,000
3
bds
|
3
ba
|
0
sqft
|
built
1917
2215 N Shartel Ave, Oklahoma City, OK 73103
$-586
Cash flow
-5.6%
Cash-on-Cash Return
4.4%
Cap rate
0.6%
Rent to Value Ratio

Active
$995,000
2
bds
|
2
ba
|
0
sqft
|
built
2021
1200 Classen Dr, Oklahoma City, OK 73103
$-4,145
Cash flow
-21.7%
Cash-on-Cash Return
0.7%
Cap rate
0.4%
Rent to Value Ratio
Active
$850,000
4
bds
|
4
ba
|
0
sqft
|
built
1925
324 NW 24th St, Oklahoma City, OK 73103
$-2,435
Cash flow
-14.9%
Cash-on-Cash Return
2.2%
Cap rate
0.3%
Rent to Value Ratio
Active
$385,000
3
bds
|
2
ba
|
0
sqft
|
built
1930
631 NW 26th St, Oklahoma City, OK 73103
$-587
Cash flow
-8.0%
Cash-on-Cash Return
3.8%
Cap rate
0.5%
Rent to Value Ratio
Active
$550,000
3
bds
|
3
ba
|
0
sqft
|
built
1919
208 NW 20th St, Oklahoma City, OK 73103
$-1,064
Cash flow
-10.1%
Cash-on-Cash Return
3.4%
Cap rate
0.6%
Rent to Value Ratio
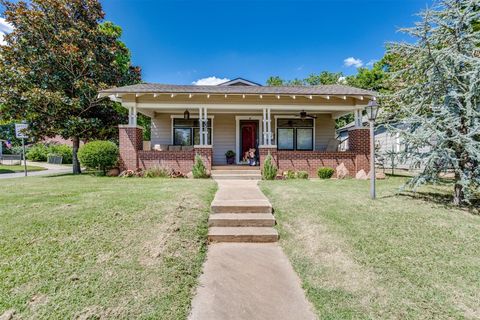
Active
$589,333
3
bds
|
2
ba
|
0
sqft
|
built
1915
615 NW 18th St, Oklahoma City, OK 73103
$-943
Cash flow
-8.3%
Cash-on-Cash Return
3.8%
Cap rate
0.5%
Rent to Value Ratio