73112 Investment Properties for Sale
Browse homes for sale and investment properties in 73112. Refine your search by price, property type, or more.
Best cash flowing properties in 73112
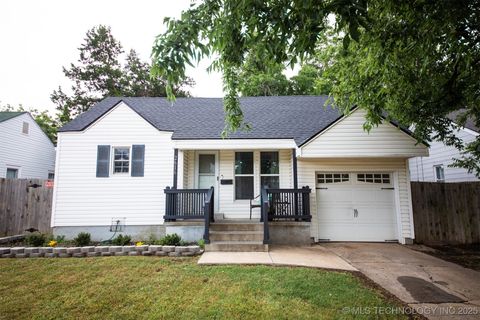
Active
$229,900
3
bds
|
2
ba
|
1,474
sqft
|
built
1949
2616 NW 33rd St, Oklahoma City, OK 73112
$-197
Cash flow
-4.5%
Cash-on-Cash Return
4.7%
Cap rate
0.7%
Rent to Value Ratio
Active
$571,500
3
bds
|
5
ba
|
4,755
sqft
|
built
1980
2202 NW 45th St, Oklahoma City, OK 73112
$-1,439
Cash flow
-13.1%
Cash-on-Cash Return
2.7%
Cap rate
0.4%
Rent to Value Ratio
2 out of 2 properties for sale in 73112
Limited Results Shown
Create a free account, or log in to reveal all property listings and enjoy the complete experience.