73116 Investment Properties for Sale
Browse homes for sale and investment properties in 73116. Refine your search by price, property type, or more.
Best cash flowing properties in 73116
Active
$95,000
2
bds
|
2
ba
|
0
sqft
|
built
1975
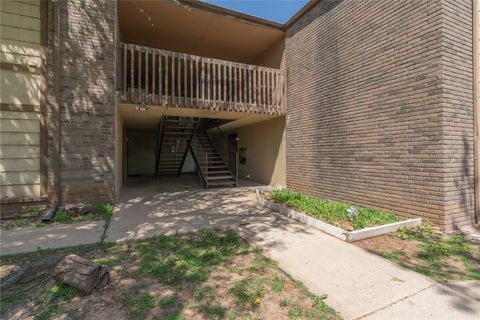
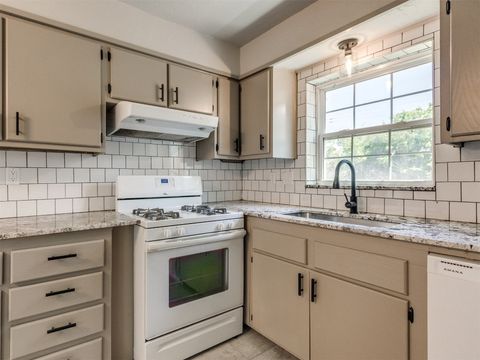
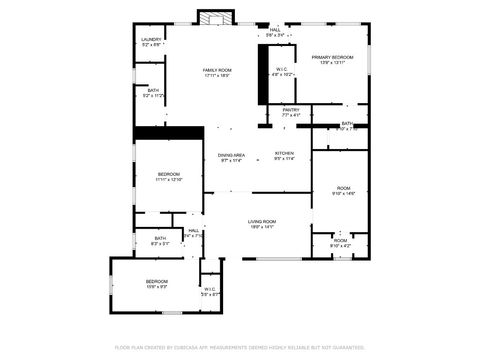
6554 N Meridian Ave, Oklahoma City, OK 73116
$25
Cash flow
1.4%
Cash-on-Cash Return
6.0%
Cap rate
1.2%
Rent to Value Ratio

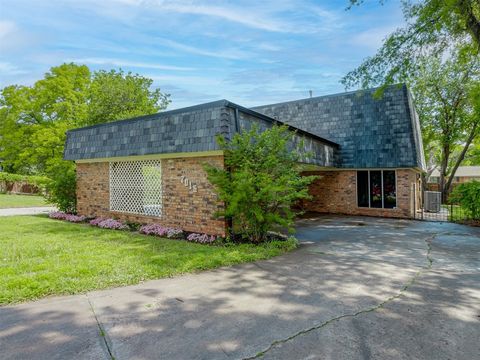
Active
$188,000
2
bds
|
1
ba
|
0
sqft
|
built
1954
3029 NW 65th St, Oklahoma City, OK 73116
$-8
Cash flow
-0.2%
Cash-on-Cash Return
5.6%
Cap rate
0.9%
Rent to Value Ratio
54 out of 63 properties for sale in 73116
Limited Results Shown
Create a free account, or log in to reveal all property listings and enjoy the complete experience.
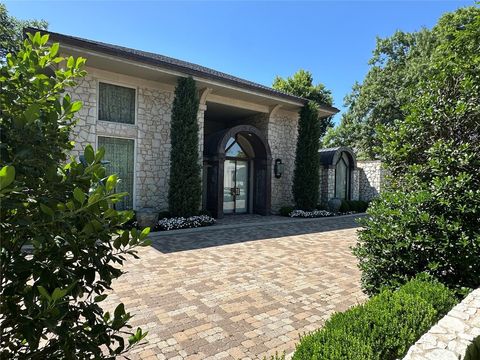
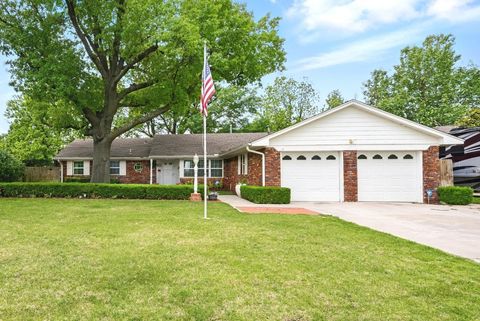
Active
$323,000
3
bds
|
3
ba
|
0
sqft
|
built
1964
6708 Pendell Dr, Oklahoma City, OK 73116
$-313
Cash flow
-5.1%
Cash-on-Cash Return
4.5%
Cap rate
0.7%
Rent to Value Ratio
Active
$1,875,000
4
bds
|
5
ba
|
0
sqft
|
built
2025
2716 W Country Club Dr, Oklahoma City, OK 73116
$-7,590
Cash flow
-21.1%
Cash-on-Cash Return
0.8%
Cap rate
0.1%
Rent to Value Ratio
Active
$200,000
3
bds
|
1
ba
|
0
sqft
|
built
1952
3020 NW 71st St, Oklahoma City, OK 73116
$-126
Cash flow
-3.3%
Cash-on-Cash Return
4.9%
Cap rate
0.7%
Rent to Value Ratio
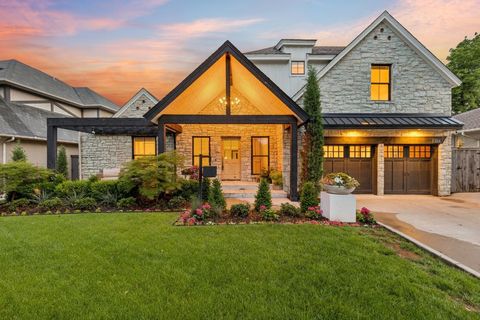
Active
$1,495,000
4
bds
|
6
ba
|
0
sqft
|
built
1967
7201 N Country Club Dr, Oklahoma City, OK 73116
$-5,483
Cash flow
-19.1%
Cash-on-Cash Return
1.3%
Cap rate
0.3%
Rent to Value Ratio
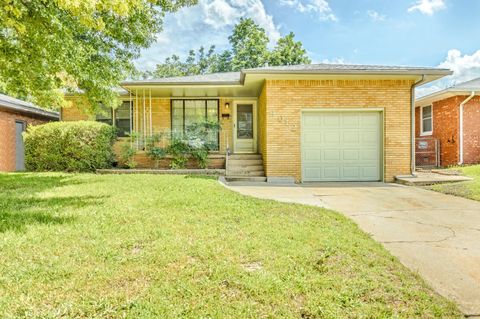
Active
$185,000
3
bds
|
1
ba
|
0
sqft
|
built
1954
3012 NW 67th St, Oklahoma City, OK 73116
$-79
Cash flow
-2.2%
Cash-on-Cash Return
5.2%
Cap rate
0.8%
Rent to Value Ratio

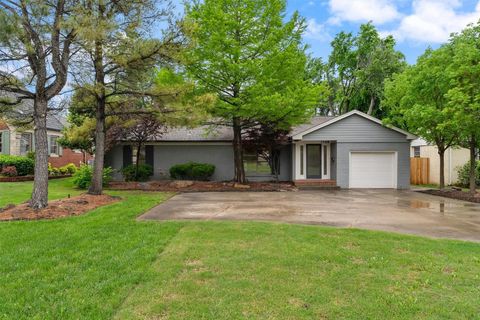
Active
$205,999
2
bds
|
3
ba
|
0
sqft
|
built
1978
7817 Old Hickory Ln, Oklahoma City, OK 73116
$-254
Cash flow
-6.4%
Cash-on-Cash Return
4.2%
Cap rate
0.8%
Rent to Value Ratio
Active
$188,000
2
bds
|
1
ba
|
0
sqft
|
built
1954
3029 NW 65th St, Oklahoma City, OK 73116
$-8
Cash flow
-0.2%
Cash-on-Cash Return
5.6%
Cap rate
0.9%
Rent to Value Ratio
Active
$1,250,000
4
bds
|
4
ba
|
0
sqft
|
built
1940
1204 Belford Ave, Nichols Hills, OK 73116
$-2,509
Cash flow
-10.5%
Cash-on-Cash Return
3.3%
Cap rate
0.5%
Rent to Value Ratio
Active
$550,000
3
bds
|
3
ba
|
0
sqft
|
built
1985
2825 NW Grand Blvd, Oklahoma City, OK 73116
$-1,683
Cash flow
-16.0%
Cash-on-Cash Return
2.0%
Cap rate
0.5%
Rent to Value Ratio
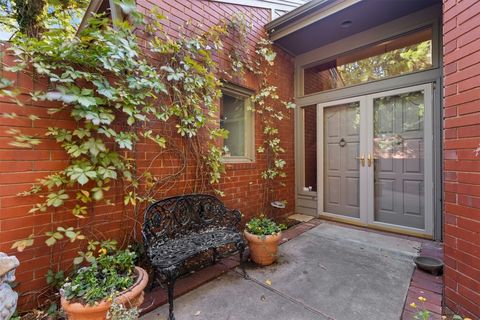
Active
$995,000
3
bds
|
4
ba
|
0
sqft
|
built
1988
1409 Glenbrook Ter, Nichols Hills, OK 73116
$-3,159
Cash flow
-16.6%
Cash-on-Cash Return
1.9%
Cap rate
0.4%
Rent to Value Ratio
Active
$344,500
4
bds
|
3
ba
|
0
sqft
|
built
1964
6509 N Shawnee Ave, Oklahoma City, OK 73116
$-342
Cash flow
-5.2%
Cash-on-Cash Return
4.5%
Cap rate
0.6%
Rent to Value Ratio
Active
$2,590,000
5
bds
|
7
ba
|
0
sqft
|
built
1937
6638 Avondale Dr, Nichols Hills, OK 73116
$-10,487
Cash flow
-21.1%
Cash-on-Cash Return
0.8%
Cap rate
0.2%
Rent to Value Ratio
Active
$1,250,000
4
bds
|
5
ba
|
0
sqft
|
built
1937
1707 Pennington Way, Nichols Hills, OK 73116
$-4,091
Cash flow
-17.1%
Cash-on-Cash Return
1.8%
Cap rate
0.3%
Rent to Value Ratio

Active
$190,000
2
bds
|
3
ba
|
0
sqft
|
built
1974
3009 W Wilshire Blvd, Oklahoma City, OK 73116
$-86
Cash flow
-2.4%
Cash-on-Cash Return
5.1%
Cap rate
0.7%
Rent to Value Ratio
Active
$199,900
2
bds
|
1
ba
|
0
sqft
|
built
1949
2748 Lancaster Ln, Oklahoma City, OK 73116
$-173
Cash flow
-4.5%
Cash-on-Cash Return
4.6%
Cap rate
0.7%
Rent to Value Ratio
Active
$1,575,000
5
bds
|
7
ba
|
0
sqft
|
built
1951
1725 Huntington Ave, Nichols Hills, OK 73116
$-5,268
Cash flow
-17.5%
Cash-on-Cash Return
1.7%
Cap rate
0.3%
Rent to Value Ratio

Active
$189,900
3
bds
|
2
ba
|
0
sqft
|
built
1954
3032 NW 67th St, Oklahoma City, OK 73116
$-72
Cash flow
-2.0%
Cash-on-Cash Return
5.2%
Cap rate
0.8%
Rent to Value Ratio
Active
$595,000
2
bds
|
3
ba
|
0
sqft
|
built
1947
1109 Tedford Way, Nichols Hills, OK 73116
$-1,548
Cash flow
-13.6%
Cash-on-Cash Return
2.6%
Cap rate
0.5%
Rent to Value Ratio

Active
$365,000
3
bds
|
3
ba
|
0
sqft
|
built
1965
6709 Reed Dr, Oklahoma City, OK 73116
$-559
Cash flow
-8.0%
Cash-on-Cash Return
3.8%
Cap rate
0.6%
Rent to Value Ratio

Active
$383,000
4
bds
|
3
ba
|
0
sqft
|
built
1962
3804 NW 66th St, Oklahoma City, OK 73116
$-215
Cash flow
-2.9%
Cash-on-Cash Return
5.0%
Cap rate
0.7%
Rent to Value Ratio

Active
$334,990
2
bds
|
3
ba
|
0
sqft
|
built
1974
1110 Sherwood Ln, Nichols Hills, OK 73116
$-927
Cash flow
-14.4%
Cash-on-Cash Return
2.4%
Cap rate
0.6%
Rent to Value Ratio
Active
$424,900
3
bds
|
2
ba
|
0
sqft
|
built
1954
2813 Clermont Pl, Oklahoma City, OK 73116
$-743
Cash flow
-9.1%
Cash-on-Cash Return
3.6%
Cap rate
0.5%
Rent to Value Ratio
Active
$270,000
3
bds
|
2
ba
|
0
sqft
|
built
1959
3222 Wilshire Ter, Oklahoma City, OK 73116
$-288
Cash flow
-5.6%
Cash-on-Cash Return
4.4%
Cap rate
0.7%
Rent to Value Ratio

Active
$285,000
2
bds
|
3
ba
|
0
sqft
|
built
1981
3107 NW 63rd St, Oklahoma City, OK 73116
$-823
Cash flow
-15.1%
Cash-on-Cash Return
2.2%
Cap rate
0.8%
Rent to Value Ratio
Active
$625,000
3
bds
|
2
ba
|
0
sqft
|
built
1948
1108 Glenwood Ave, Nichols Hills, OK 73116
$-1,797
Cash flow
-15.0%
Cash-on-Cash Return
2.2%
Cap rate
0.4%
Rent to Value Ratio
Active
$184,000
2
bds
|
3
ba
|
0
sqft
|
built
1979
6500 N Grand Blvd, Oklahoma City, OK 73116
$-333
Cash flow
-9.4%
Cash-on-Cash Return
3.5%
Cap rate
0.9%
Rent to Value Ratio
Active
$295,000
3
bds
|
2
ba
|
0
sqft
|
built
1946
1733 NW 63rd St, Nichols Hills, OK 73116
$-540
Cash flow
-9.6%
Cash-on-Cash Return
3.5%
Cap rate
0.5%
Rent to Value Ratio
Active
$299,900
4
bds
|
3
ba
|
0
sqft
|
built
1967
7016 N Roff Ave, Oklahoma City, OK 73116
$-378
Cash flow
-6.6%
Cash-on-Cash Return
4.2%
Cap rate
0.6%
Rent to Value Ratio
Active
$365,000
3
bds
|
3
ba
|
0
sqft
|
built
1956
1315 W Wilshire Blvd, Oklahoma City, OK 73116
$-289
Cash flow
-4.1%
Cash-on-Cash Return
4.7%
Cap rate
0.7%
Rent to Value Ratio
Active
$1,395,000
5
bds
|
5
ba
|
0
sqft
|
built
2014
1422 Glenbrook Ter, Nichols Hills, OK 73116
$-4,875
Cash flow
-18.2%
Cash-on-Cash Return
1.5%
Cap rate
0.4%
Rent to Value Ratio
Active
$555,000
3
bds
|
3
ba
|
0
sqft
|
built
1948
1105 Belford Ave, Nichols Hills, OK 73116
$-1,078
Cash flow
-10.1%
Cash-on-Cash Return
3.3%
Cap rate
0.5%
Rent to Value Ratio
Active
$95,000
2
bds
|
2
ba
|
0
sqft
|
built
1975
6554 N Meridian Ave, Oklahoma City, OK 73116
$25
Cash flow
1.4%
Cash-on-Cash Return
6.0%
Cap rate
1.2%
Rent to Value Ratio
Active
$419,999
3
bds
|
3
ba
|
0
sqft
|
built
1950
2736 Pembroke Ter, Oklahoma City, OK 73116
$-703
Cash flow
-8.7%
Cash-on-Cash Return
3.7%
Cap rate
0.6%
Rent to Value Ratio
Active
$223,000
2
bds
|
1
ba
|
0
sqft
|
built
1951
2837 Cambridge Ct, Oklahoma City, OK 73116
$-58
Cash flow
-1.4%
Cash-on-Cash Return
5.4%
Cap rate
0.7%
Rent to Value Ratio
Active
$195,000
2
bds
|
1
ba
|
0
sqft
|
built
1949
2757 Lancaster Ln, Oklahoma City, OK 73116
$-96
Cash flow
-2.6%
Cash-on-Cash Return
5.1%
Cap rate
0.7%
Rent to Value Ratio

Active
$595,000
2
bds
|
3
ba
|
0
sqft
|
built
1975
6448 Brandywine Ln, Oklahoma City, OK 73116
$-930
Cash flow
-8.2%
Cash-on-Cash Return
3.8%
Cap rate
0.7%
Rent to Value Ratio
Active
$3,350,000
3
bds
|
5
ba
|
0
sqft
|
built
1954
6802 NW Grand Blvd, Nichols Hills, OK 73116
$-14,672
Cash flow
-22.9%
Cash-on-Cash Return
0.4%
Cap rate
0.1%
Rent to Value Ratio

Active
$499,000
3
bds
|
4
ba
|
0
sqft
|
built
2002
3113 Hickory Sign Post Rd, Oklahoma City, OK 73116
$-936
Cash flow
-9.8%
Cash-on-Cash Return
3.4%
Cap rate
0.6%
Rent to Value Ratio
Active
$360,000
2
bds
|
2
ba
|
0
sqft
|
built
1956
3101 NW 70th St, Oklahoma City, OK 73116
$-75
Cash flow
-1.1%
Cash-on-Cash Return
5.4%
Cap rate
0.7%
Rent to Value Ratio

Active
$410,000
2
bds
|
3
ba
|
0
sqft
|
built
1974
1110 Sherwood Ln, Nichols Hills, OK 73116
$-978
Cash flow
-12.4%
Cash-on-Cash Return
2.8%
Cap rate
0.6%
Rent to Value Ratio