74008 Investment Properties for Sale
Browse homes for sale and investment properties in 74008. Refine your search by price, property type, or more.
Best cash flowing properties in 74008
Active
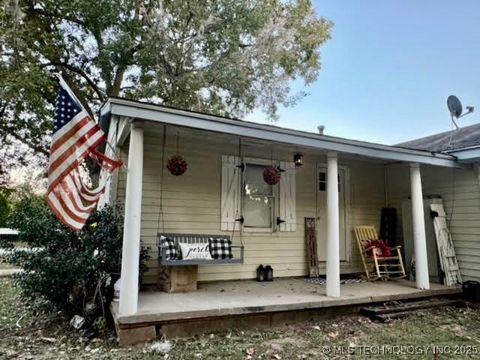
$185,000
2
bds
|
1
ba
|
940
sqft
|
built
1940
16510 E 165th St S, Bixby, OK 74008
$-32
Cash flow
-0.9%
Cash-on-Cash Return
5.5%
Cap rate
0.7%
Rent to Value Ratio
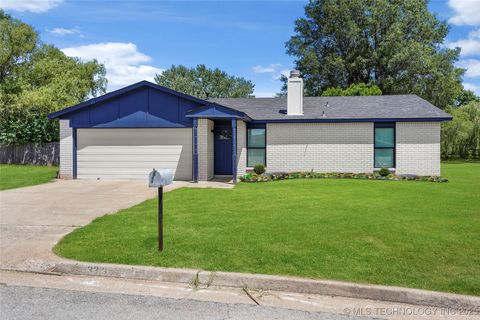
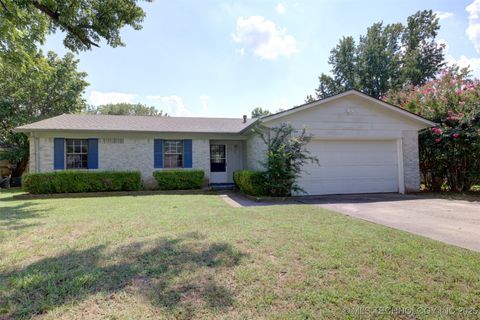
Active
$229,500
3
bds
|
2
ba
|
1,251
sqft
|
built
1979
13313 S 85th East Ave, Bixby, OK 74008
$-70
Cash flow
-1.6%
Cash-on-Cash Return
5.3%
Cap rate
0.7%
Rent to Value Ratio
122 out of 209 properties for sale in 74008
Limited Results Shown
Create a free account, or log in to reveal all property listings and enjoy the complete experience.
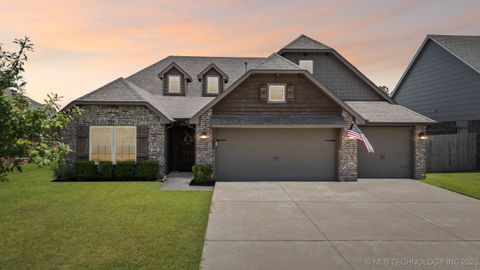
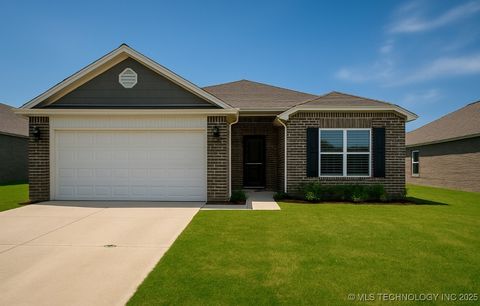
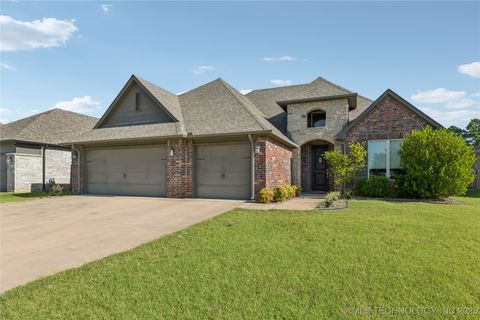
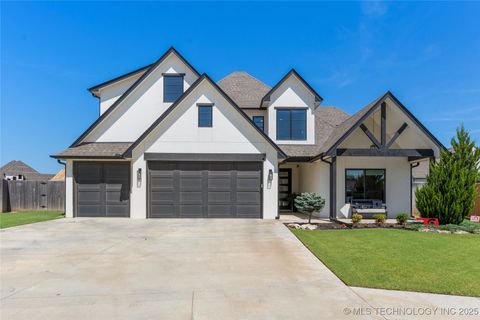
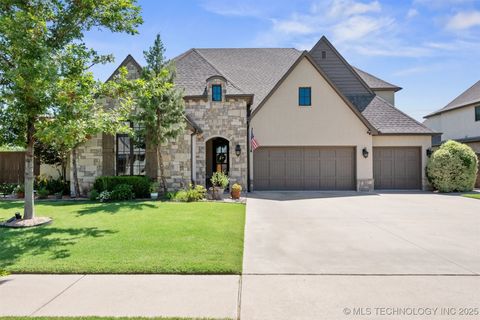
Active
$349,000
4
bds
|
3
ba
|
1,850
sqft
|
built
2019
9016 E 132nd St S, Bixby, OK 74008
$-476
Cash flow
-7.1%
Cash-on-Cash Return
4.0%
Cap rate
0.7%
Rent to Value Ratio
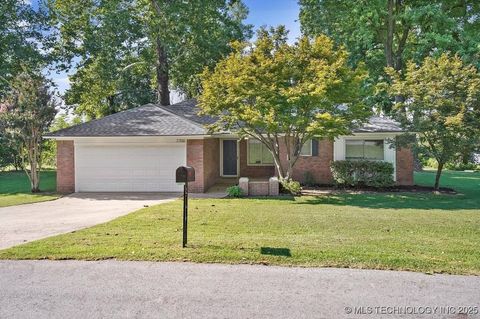
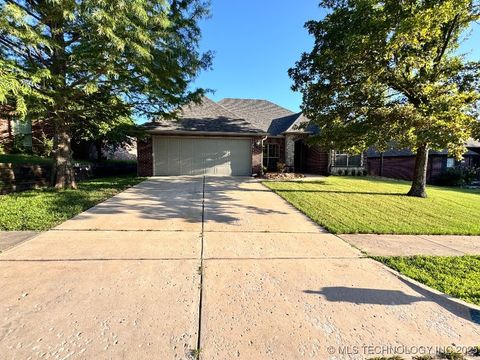
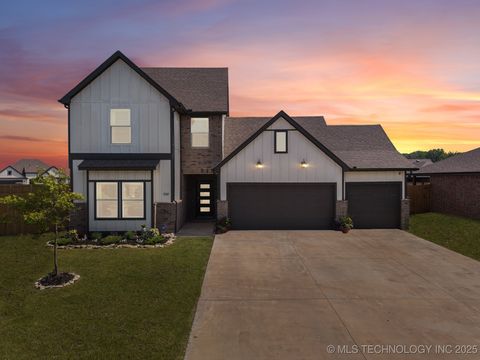
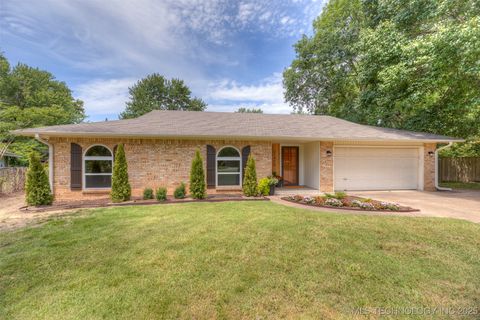
Active
$260,000
3
bds
|
2
ba
|
1,462
sqft
|
built
1973
7700 E 118th St S, Bixby, OK 74008
$-315
Cash flow
-6.3%
Cash-on-Cash Return
4.2%
Cap rate
0.6%
Rent to Value Ratio
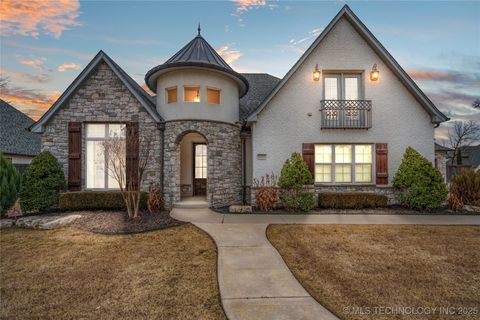
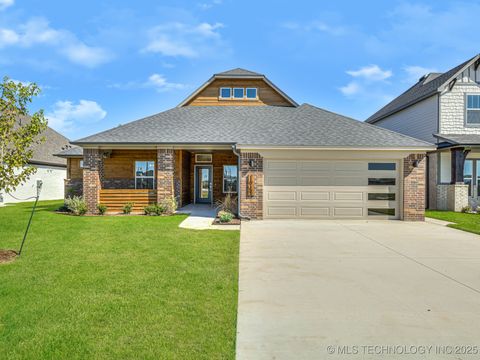
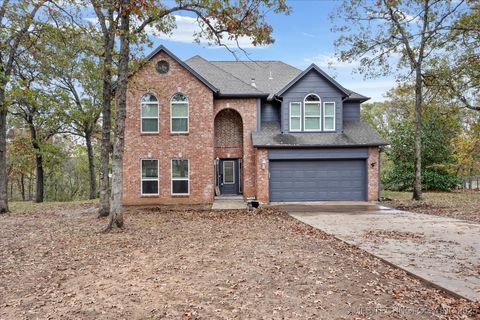
Active
$310,000
3
bds
|
2
ba
|
1,731
sqft
|
built
2017
14625 S Toledo Pl, Bixby, OK 74008
$-427
Cash flow
-7.2%
Cash-on-Cash Return
4.0%
Cap rate
0.7%
Rent to Value Ratio
Active
$2,250,000
4
bds
|
4
ba
|
3,806
sqft
|
built
1991
2290 E 151st St S, Bixby, OK 74008
$-9,065
Cash flow
-21.0%
Cash-on-Cash Return
0.8%
Cap rate
0.1%
Rent to Value Ratio
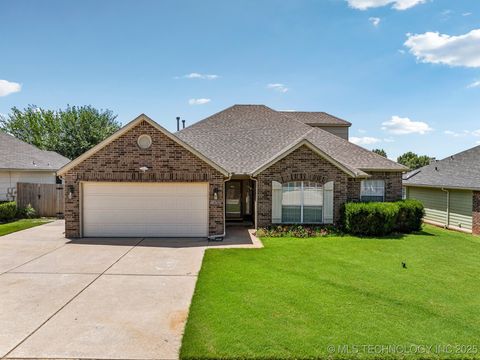
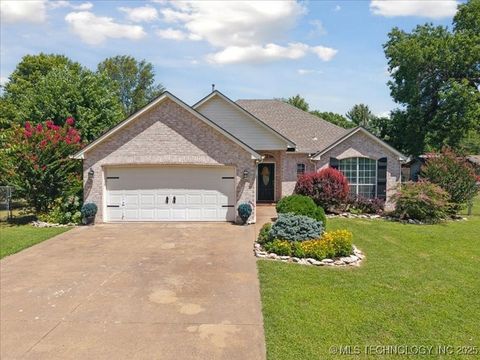
Active
$285,000
4
bds
|
3
ba
|
2,367
sqft
|
built
2016
5837 E 148th St S, Bixby, OK 74008
$-132
Cash flow
-2.4%
Cash-on-Cash Return
5.1%
Cap rate
0.8%
Rent to Value Ratio
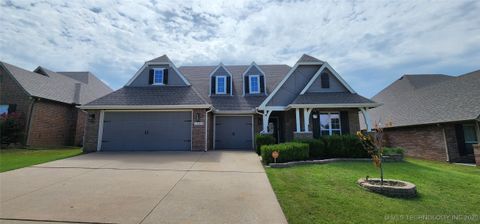
Active
$337,500
4
bds
|
2
ba
|
1,976
sqft
|
built
2012
2029 E 133rd Pl S, Bixby, OK 74008
$-369
Cash flow
-5.7%
Cash-on-Cash Return
4.4%
Cap rate
0.7%
Rent to Value Ratio
Active
$193,977
3
bds
|
2
ba
|
1,112
sqft
|
built
1975
32 W Rachel St, Bixby, OK 74008
$-97
Cash flow
-2.6%
Cash-on-Cash Return
5.1%
Cap rate
0.7%
Rent to Value Ratio
Active
$298,000
4
bds
|
2
ba
|
1,930
sqft
|
built
2022
7544 E 159th St S, Bixby, OK 74008
$-389
Cash flow
-6.8%
Cash-on-Cash Return
4.1%
Cap rate
0.7%
Rent to Value Ratio
Active
$339,000
4
bds
|
2
ba
|
2,096
sqft
|
built
2002
4526 E 141st Pl S, Bixby, OK 74008
$-533
Cash flow
-8.2%
Cash-on-Cash Return
3.8%
Cap rate
0.6%
Rent to Value Ratio
Active
$729,000
4
bds
|
5
ba
|
3,943
sqft
|
built
2014
6683 E 122nd Pl S, Bixby, OK 74008
$-1,311
Cash flow
-9.4%
Cash-on-Cash Return
3.5%
Cap rate
0.6%
Rent to Value Ratio
Active
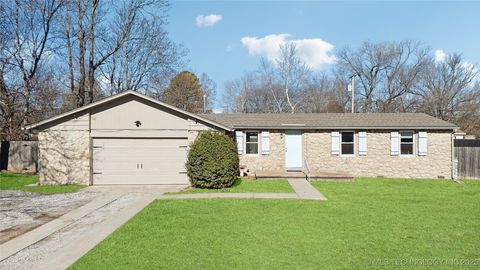
$214,900
3
bds
|
2
ba
|
1,294
sqft
|
built
1958
8421 E 133rd St S, Bixby, OK 74008
$-168
Cash flow
-4.1%
Cash-on-Cash Return
4.7%
Cap rate
0.7%
Rent to Value Ratio
Active
$330,000
4
bds
|
2
ba
|
1,961
sqft
|
built
2010
2003 E 133rd Ct, Bixby, OK 74008
$-437
Cash flow
-6.9%
Cash-on-Cash Return
4.1%
Cap rate
0.6%
Rent to Value Ratio
Active
$769,900
5
bds
|
6
ba
|
5,363
sqft
|
built
2007
7207 E 112th Pl S, Bixby, OK 74008
$-1,398
Cash flow
-9.5%
Cash-on-Cash Return
3.5%
Cap rate
0.6%
Rent to Value Ratio
Active
$575,000
4
bds
|
4
ba
|
3,650
sqft
|
built
2007
14699 S Gary Ave, Bixby, OK 74008
$-834
Cash flow
-7.6%
Cash-on-Cash Return
3.9%
Cap rate
0.6%
Rent to Value Ratio
Active
$624,900
5
bds
|
4
ba
|
3,552
sqft
|
built
2022
14460 S College Ave, Bixby, OK 74008
$-789
Cash flow
-6.6%
Cash-on-Cash Return
4.2%
Cap rate
0.6%
Rent to Value Ratio
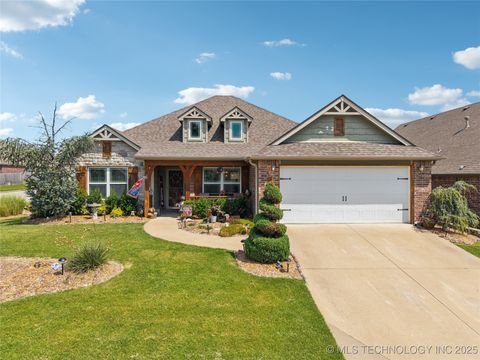
Active
$369,900
4
bds
|
2
ba
|
2,230
sqft
|
built
2020
5934 E 143rd St S, Bixby, OK 74008
$-449
Cash flow
-6.3%
Cash-on-Cash Return
4.2%
Cap rate
0.7%
Rent to Value Ratio
Active
$399,000
5
bds
|
3
ba
|
2,533
sqft
|
built
2017
14751 S Urbana Ave, Bixby, OK 74008
$-704
Cash flow
-9.2%
Cash-on-Cash Return
3.6%
Cap rate
0.6%
Rent to Value Ratio
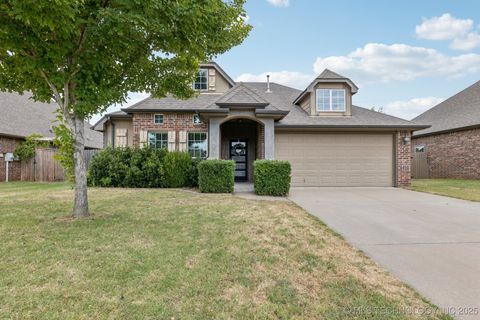
Active
$330,000
3
bds
|
2
ba
|
1,933
sqft
|
built
2018
3838 E 144th St S, Bixby, OK 74008
$-545
Cash flow
-8.6%
Cash-on-Cash Return
3.7%
Cap rate
0.6%
Rent to Value Ratio
Active
$420,000
4
bds
|
3
ba
|
2,938
sqft
|
built
2011
3140 E 143rd St S, Bixby, OK 74008
$-442
Cash flow
-5.5%
Cash-on-Cash Return
4.4%
Cap rate
0.7%
Rent to Value Ratio
Active
$529,900
5
bds
|
4
ba
|
2,835
sqft
|
built
2023
12233 S 102nd East Ave, Bixby, OK 74008
$-1,246
Cash flow
-12.3%
Cash-on-Cash Return
2.9%
Cap rate
0.5%
Rent to Value Ratio
Active
$349,900
3
bds
|
2
ba
|
2,028
sqft
|
built
2017
13176 S 92nd East Ave, Bixby, OK 74008
$-493
Cash flow
-7.4%
Cash-on-Cash Return
4.0%
Cap rate
0.6%
Rent to Value Ratio
Active
$422,500
4
bds
|
3
ba
|
2,143
sqft
|
built
2023
7410 E 159th Pl S, Bixby, OK 74008
$-809
Cash flow
-10.0%
Cash-on-Cash Return
3.4%
Cap rate
0.4%
Rent to Value Ratio
Active
$429,500
3
bds
|
3
ba
|
2,240
sqft
|
built
2019
5521 E 121st Pl S, Bixby, OK 74008
$-734
Cash flow
-8.9%
Cash-on-Cash Return
3.6%
Cap rate
0.6%
Rent to Value Ratio
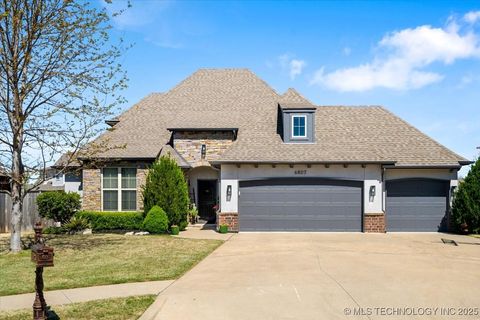
Active
$515,000
5
bds
|
3
ba
|
3,356
sqft
|
built
2015
6807 E 125th St S, Bixby, OK 74008
$-1,002
Cash flow
-10.2%
Cash-on-Cash Return
3.3%
Cap rate
0.6%
Rent to Value Ratio
Active
$423,000
5
bds
|
3
ba
|
2,960
sqft
|
built
2008
13408 S 20th Ct, Bixby, OK 74008
$-637
Cash flow
-7.9%
Cash-on-Cash Return
3.9%
Cap rate
0.6%
Rent to Value Ratio
Active
$290,000
3
bds
|
2
ba
|
1,590
sqft
|
built
2011
8731 E 136th St S, Bixby, OK 74008
$-462
Cash flow
-8.3%
Cash-on-Cash Return
3.8%
Cap rate
0.6%
Rent to Value Ratio
Active
$675,000
4
bds
|
3
ba
|
3,850
sqft
|
built
2021
2871 E 142nd Ct S, Bixby, OK 74008
$-1,675
Cash flow
-12.9%
Cash-on-Cash Return
2.7%
Cap rate
0.5%
Rent to Value Ratio
Active
$397,000
4
bds
|
3
ba
|
2,170
sqft
|
built
2023
7222 E 154th St S, Bixby, OK 74008
$-652
Cash flow
-8.6%
Cash-on-Cash Return
3.7%
Cap rate
0.6%
Rent to Value Ratio
Active
$444,900
4
bds
|
4
ba
|
2,713
sqft
|
built
2023
16153 S 90th East Ave, Bixby, OK 74008
$-203
Cash flow
-2.4%
Cash-on-Cash Return
5.1%
Cap rate
0.6%
Rent to Value Ratio
Active
$375,000
3
bds
|
3
ba
|
2,535
sqft
|
built
1999
10306 E 114th Pl S, Bixby, OK 74008
$-752
Cash flow
-10.5%
Cash-on-Cash Return
3.3%
Cap rate
0.5%
Rent to Value Ratio
Active
$675,000
5
bds
|
4
ba
|
4,222
sqft
|
built
2016
6624 E 133rd St S, Bixby, OK 74008
$-1,763
Cash flow
-13.6%
Cash-on-Cash Return
2.5%
Cap rate
0.5%
Rent to Value Ratio
Active
$285,000
4
bds
|
2
ba
|
1,466
sqft
|
built
1973
11926 S 86th East Ave, Bixby, OK 74008
$-505
Cash flow
-9.2%
Cash-on-Cash Return
3.6%
Cap rate
0.5%
Rent to Value Ratio
Active
$519,900
4
bds
|
4
ba
|
2,880
sqft
|
built
1992
17915 S 128th East Ct, Bixby, OK 74008
$-837
Cash flow
-8.4%
Cash-on-Cash Return
3.7%
Cap rate
0.6%
Rent to Value Ratio
Active
$281,900
3
bds
|
2
ba
|
1,550
sqft
|
built
2002
8431 E 126th St S, Bixby, OK 74008
$-394
Cash flow
-7.3%
Cash-on-Cash Return
4.0%
Cap rate
0.6%
Rent to Value Ratio
Active
$735,000
4
bds
|
5
ba
|
3,858
sqft
|
built
2023
6621 E 153rd St S, Bixby, OK 74008
$-1,108
Cash flow
-7.9%
Cash-on-Cash Return
3.9%
Cap rate
0.6%
Rent to Value Ratio
Active
$514,900
4
bds
|
3
ba
|
2,665
sqft
|
built
2018
11919 S 68th East Ave, Bixby, OK 74008
$-867
Cash flow
-8.8%
Cash-on-Cash Return
3.7%
Cap rate
0.6%
Rent to Value Ratio
Active
$420,000
5
bds
|
3
ba
|
3,044
sqft
|
built
2005
3261 E 145th Pl S, Bixby, OK 74008
$-492
Cash flow
-6.1%
Cash-on-Cash Return
4.3%
Cap rate
0.7%
Rent to Value Ratio
Active
$265,000
3
bds
|
2
ba
|
1,763
sqft
|
built
1979
11611 S 100th East Ave, Bixby, OK 74008
$-297
Cash flow
-5.8%
Cash-on-Cash Return
4.3%
Cap rate
0.6%
Rent to Value Ratio