74105 Investment Properties for Sale
Browse homes for sale and investment properties in 74105. Refine your search by price, property type, or more.
Best cash flowing properties in 74105
Active
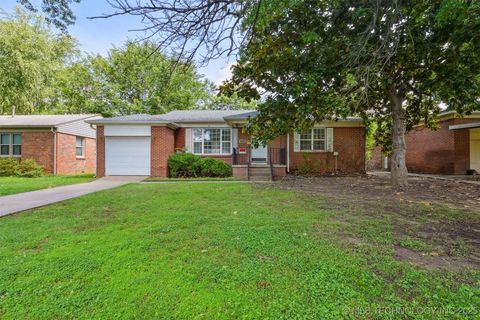
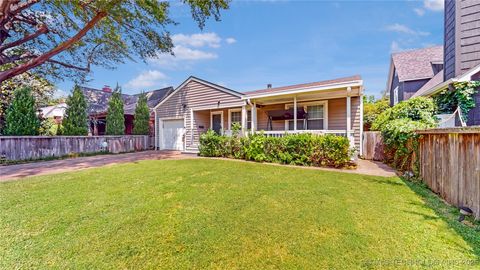
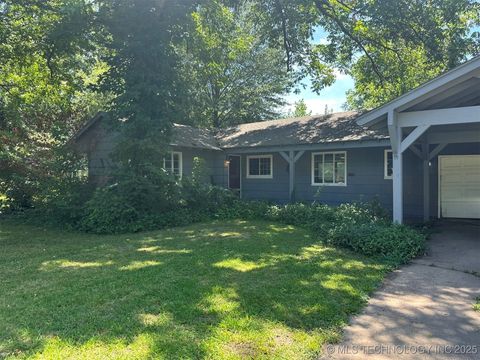
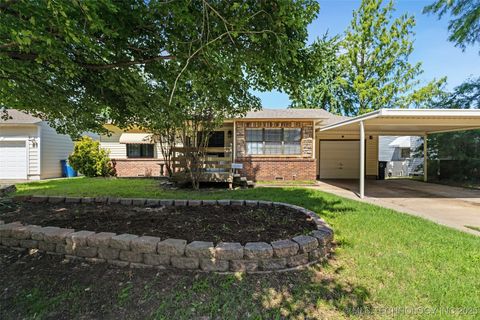
$163,000
3
bds
|
1
ba
|
1,152
sqft
|
built
1955
1119 E 53rd Pl, Tulsa, OK 74105
$71
Cash flow
2.3%
Cash-on-Cash Return
6.2%
Cap rate
0.9%
Rent to Value Ratio
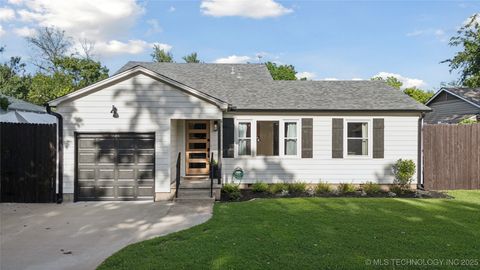
Active
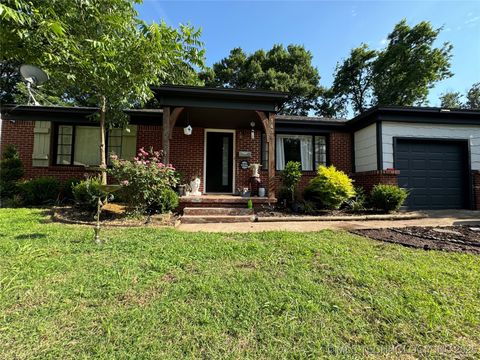
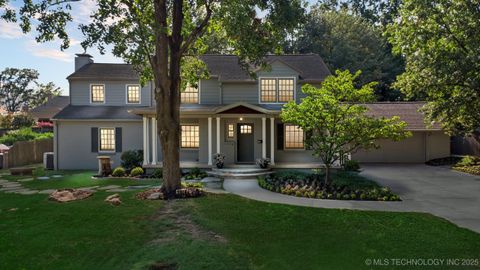
$175,000
3
bds
|
1
ba
|
1,211
sqft
|
built
1956
1438 E 52nd Pl, Tulsa, OK 74105
$25
Cash flow
0.7%
Cash-on-Cash Return
5.8%
Cap rate
0.8%
Rent to Value Ratio
63 out of 75 properties for sale in 74105
Limited Results Shown
Create a free account, or log in to reveal all property listings and enjoy the complete experience.

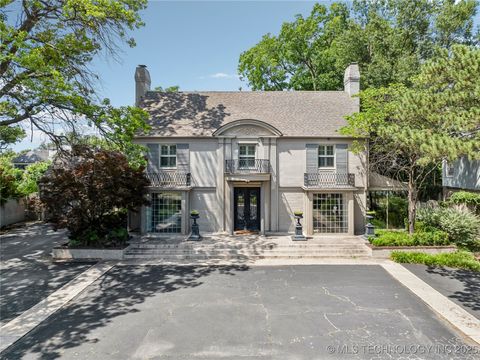
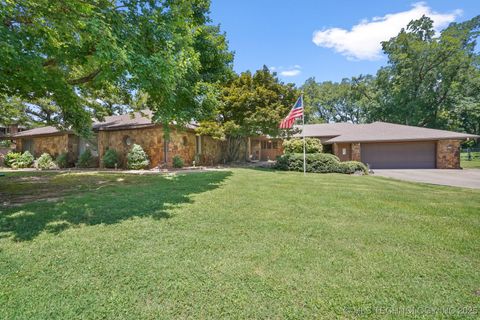
Active
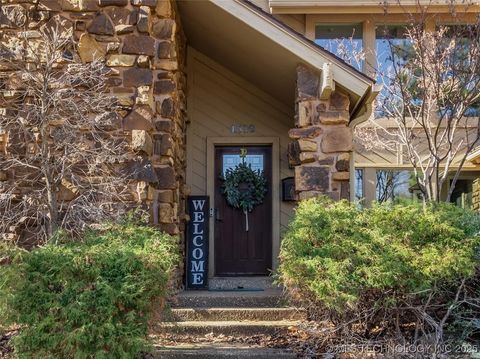
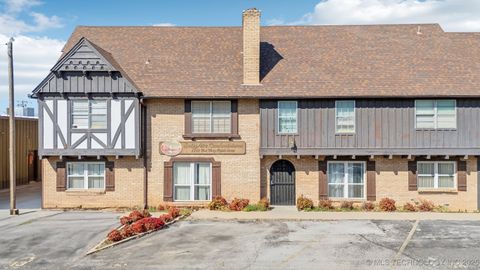
$1,475,000
4
bds
|
6
ba
|
5,012
sqft
|
built
2001
3661 S Lewis Ave, Tulsa, OK 74105
$-5,126
Cash flow
-18.1%
Cash-on-Cash Return
1.5%
Cap rate
0.3%
Rent to Value Ratio
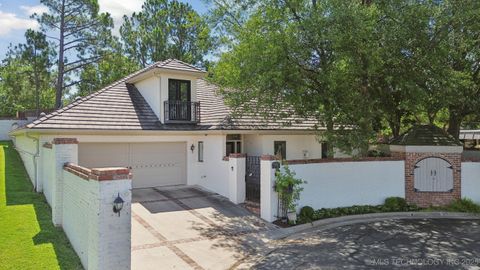
Active
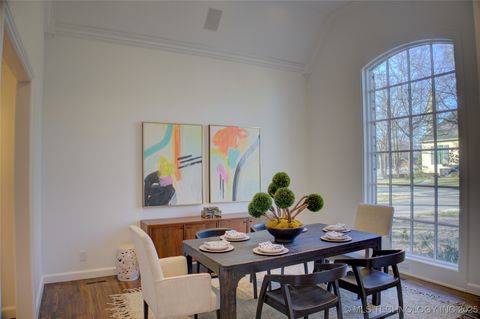
$698,000
4
bds
|
5
ba
|
4,922
sqft
|
built
1979
4510 S Birmingham Pl, Tulsa, OK 74105
$-1,230
Cash flow
-9.2%
Cash-on-Cash Return
3.6%
Cap rate
0.6%
Rent to Value Ratio
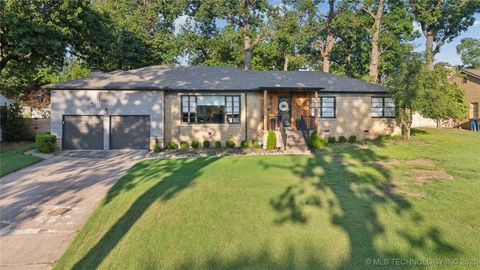
Active
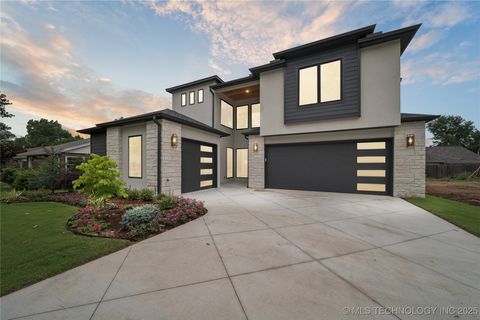
$1,275,000
5
bds
|
4
ba
|
3,989
sqft
|
built
2025
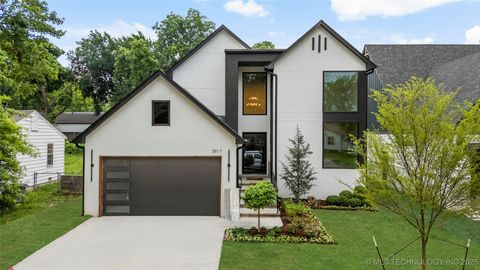
1641 E 32nd St, Tulsa, OK 74105
$-3,973
Cash flow
-16.3%
Cash-on-Cash Return
1.9%
Cap rate
0.3%
Rent to Value Ratio
Active
$935,000
4
bds
|
3
ba
|
3,350
sqft
|
built
2024
3917 S Madison Ave, Tulsa, OK 74105
$-3,683
Cash flow
-20.6%
Cash-on-Cash Return
1.0%
Cap rate
0.1%
Rent to Value Ratio
Active
$175,000
2
bds
|
1
ba
|
759
sqft
|
built
1948
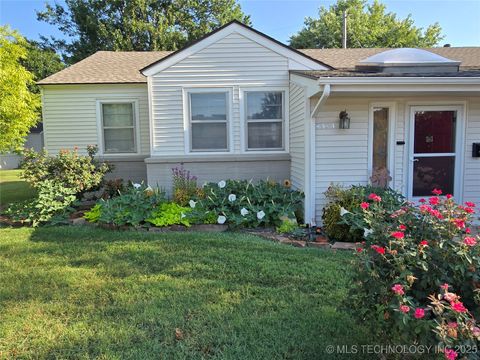
1437 E 38th Pl, Tulsa, OK 74105
$-327
Cash flow
-9.7%
Cash-on-Cash Return
3.4%
Cap rate
0.7%
Rent to Value Ratio
Active
$1,223,500
4
bds
|
5
ba
|
3,946
sqft
|
built
2025
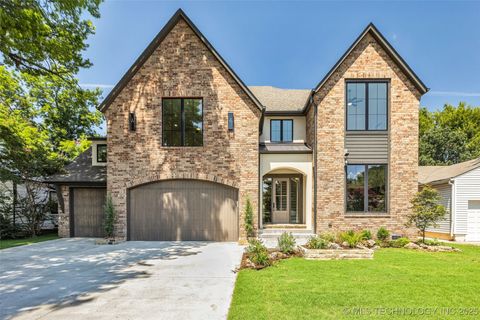
1009 E 38th St, Tulsa, OK 74105
$-4,902
Cash flow
-20.9%
Cash-on-Cash Return
0.9%
Cap rate
0.1%
Rent to Value Ratio
Active
$176,000
3
bds
|
1
ba
|
1,272
sqft
|
built
1955
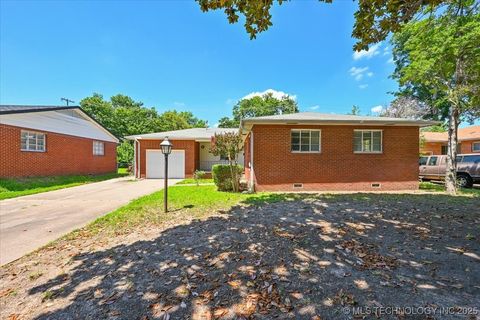
1025 E 53rd St, Tulsa, OK 74105
$10
Cash flow
0.3%
Cash-on-Cash Return
5.7%
Cap rate
0.8%
Rent to Value Ratio
Active
$349,000
3
bds
|
2
ba
|
2,698
sqft
|
built
1970
5916 S Quincy Pl, Tulsa, OK 74105
$-927
Cash flow
-13.9%
Cash-on-Cash Return
2.5%
Cap rate
0.4%
Rent to Value Ratio
Active
$400,000
3
bds
|
3
ba
|
2,429
sqft
|
built
1962
4620 S Gary Ave, Tulsa, OK 74105
$-531
Cash flow
-6.9%
Cash-on-Cash Return
4.1%
Cap rate
0.6%
Rent to Value Ratio
Active
$114,000
1
bds
|
1
ba
|
564
sqft
|
built
1965
1313 E 48th St, Tulsa, OK 74105
$-243
Cash flow
-11.1%
Cash-on-Cash Return
3.1%
Cap rate
0.7%
Rent to Value Ratio
Active
$1,150,000
4
bds
|
4
ba
|
4,061
sqft
|
built
2019
1433 E 38th St, Tulsa, OK 74105
$-4,161
Cash flow
-18.9%
Cash-on-Cash Return
1.3%
Cap rate
0.3%
Rent to Value Ratio
Active
$315,000
3
bds
|
2
ba
|
1,455
sqft
|
built
1948
1243 E 32nd St, Tulsa, OK 74105
$-504
Cash flow
-8.3%
Cash-on-Cash Return
3.8%
Cap rate
0.6%
Rent to Value Ratio
Active
$775,000
5
bds
|
4
ba
|
3,617
sqft
|
built
1952
3814 S Wheeling Ave, Tulsa, OK 74105
$-1,529
Cash flow
-10.3%
Cash-on-Cash Return
3.3%
Cap rate
0.5%
Rent to Value Ratio
Active
$115,000
1
bds
|
1
ba
|
649
sqft
|
built
1965
1313 E 48th St, Tulsa, OK 74105
$-78
Cash flow
-3.5%
Cash-on-Cash Return
4.9%
Cap rate
1.0%
Rent to Value Ratio
Active
$1,695,000
4
bds
|
5
ba
|
4,651
sqft
|
built
1994
2616 E 33rd St, Tulsa, OK 74105
$-5,234
Cash flow
-16.1%
Cash-on-Cash Return
2.0%
Cap rate
0.4%
Rent to Value Ratio
Active
$395,000
3
bds
|
2
ba
|
1,805
sqft
|
built
1936
1237 E 31st Ct, Tulsa, OK 74105
$-700
Cash flow
-9.2%
Cash-on-Cash Return
3.6%
Cap rate
0.5%
Rent to Value Ratio
Active
$334,900
4
bds
|
2
ba
|
2,406
sqft
|
built
1957
5127 S Columbia Ave, Tulsa, OK 74105
$-463
Cash flow
-7.2%
Cash-on-Cash Return
4.0%
Cap rate
0.6%
Rent to Value Ratio
Active
$379,000
2
bds
|
2
ba
|
1,678
sqft
|
built
1953
1323 E 32nd Pl, Tulsa, OK 74105
$-850
Cash flow
-11.7%
Cash-on-Cash Return
3.0%
Cap rate
0.5%
Rent to Value Ratio
Active
$349,000
2
bds
|
1
ba
|
1,309
sqft
|
built
1952
4905 S Columbia Ave, Tulsa, OK 74105
$-629
Cash flow
-9.4%
Cash-on-Cash Return
3.5%
Cap rate
0.5%
Rent to Value Ratio
Active
$295,000
3
bds
|
3
ba
|
2,200
sqft
|
built
1950
3014 E 49th St, Tulsa, OK 74105
$-200
Cash flow
-3.5%
Cash-on-Cash Return
4.9%
Cap rate
0.7%
Rent to Value Ratio
Active
$1,499,900
5
bds
|
6
ba
|
5,118
sqft
|
built
1937
2441 E 31st St, Tulsa, OK 74105
$-4,619
Cash flow
-16.1%
Cash-on-Cash Return
2.0%
Cap rate
0.3%
Rent to Value Ratio
Active
$615,000
3
bds
|
4
ba
|
3,368
sqft
|
built
1999
4829 S Zunis Ave, Tulsa, OK 74105
$-851
Cash flow
-7.2%
Cash-on-Cash Return
4.0%
Cap rate
0.7%
Rent to Value Ratio
Active
$645,000
3
bds
|
2
ba
|
2,350
sqft
|
built
1950
3425 S Zunis Ave, Tulsa, OK 74105
$-1,575
Cash flow
-12.7%
Cash-on-Cash Return
2.7%
Cap rate
0.4%
Rent to Value Ratio
Active
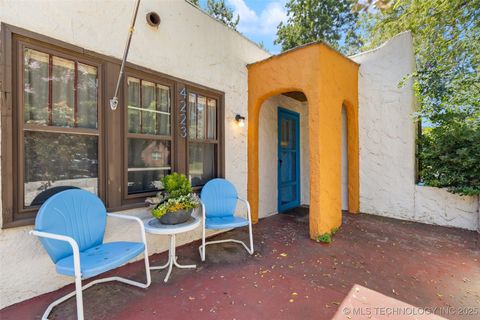
$299,000
2
bds
|
1
ba
|
1,363
sqft
|
built
1930
4223 S Madison Pl, Tulsa, OK 74105
$-473
Cash flow
-8.3%
Cash-on-Cash Return
3.8%
Cap rate
0.5%
Rent to Value Ratio
Active
$485,000
4
bds
|
3
ba
|
2,136
sqft
|
built
1965
4523 S Lewis Ave, Tulsa, OK 74105
$-961
Cash flow
-10.3%
Cash-on-Cash Return
3.3%
Cap rate
0.5%
Rent to Value Ratio
Active
$1,240,000
3
bds
|
4
ba
|
4,170
sqft
|
built
1956
2869 E 34th St, Tulsa, OK 74105
$-3,815
Cash flow
-16.1%
Cash-on-Cash Return
2.0%
Cap rate
0.4%
Rent to Value Ratio
Active
$1,050,000
5
bds
|
7
ba
|
4,769
sqft
|
built
2009
1714 E 35th St, Tulsa, OK 74105
$-2,893
Cash flow
-14.4%
Cash-on-Cash Return
2.4%
Cap rate
0.4%
Rent to Value Ratio
Active
$685,000
4
bds
|
4
ba
|
2,267
sqft
|
built
2019
913 E 37th St, Tulsa, OK 74105
$-2,584
Cash flow
-19.7%
Cash-on-Cash Return
1.2%
Cap rate
0.3%
Rent to Value Ratio
Active
$390,000
3
bds
|
3
ba
|
3,128
sqft
|
built
1963
2112 E 59th St, Tulsa, OK 74105
$-1,316
Cash flow
-17.6%
Cash-on-Cash Return
1.6%
Cap rate
0.7%
Rent to Value Ratio
Active
$255,000
2
bds
|
1
ba
|
1,046
sqft
|
built
1950
338 E 45th Pl, Tulsa, OK 74105
$-311
Cash flow
-6.4%
Cash-on-Cash Return
4.2%
Cap rate
0.6%
Rent to Value Ratio
Active
$939,000
4
bds
|
4
ba
|
3,241
sqft
|
built
1955
3918 S Evanston Ave, Tulsa, OK 74105
$-2,913
Cash flow
-16.2%
Cash-on-Cash Return
2.0%
Cap rate
0.3%
Rent to Value Ratio
Active
$174,900
2
bds
|
2
ba
|
948
sqft
|
built
1952
4944 S Quincy Ave, Tulsa, OK 74105
$5
Cash flow
0.1%
Cash-on-Cash Return
5.7%
Cap rate
0.8%
Rent to Value Ratio
Active
$399,000
4
bds
|
4
ba
|
3,760
sqft
|
built
1983
2425 E 53rd St, Tulsa, OK 74105
$-134
Cash flow
-1.8%
Cash-on-Cash Return
5.3%
Cap rate
0.8%
Rent to Value Ratio
Active
$559,000
3
bds
|
3
ba
|
2,408
sqft
|
built
1950
3919 S Detroit Ave, Tulsa, OK 74105
$-634
Cash flow
-5.9%
Cash-on-Cash Return
4.3%
Cap rate
0.6%
Rent to Value Ratio
Active
$375,000
3
bds
|
2
ba
|
2,016
sqft
|
built
1935
1544 E 34th St, Tulsa, OK 74105
$-714
Cash flow
-9.9%
Cash-on-Cash Return
3.4%
Cap rate
0.6%
Rent to Value Ratio
Active
$269,900
4
bds
|
2
ba
|
1,882
sqft
|
built
1957
5941 S Utica Ave, Tulsa, OK 74105
$-262
Cash flow
-5.1%
Cash-on-Cash Return
4.5%
Cap rate
0.6%
Rent to Value Ratio
Active
$590,000
4
bds
|
4
ba
|
2,543
sqft
|
built
1954
3447 S Gary Pl, Tulsa, OK 74105
$-1,324
Cash flow
-11.7%
Cash-on-Cash Return
3.0%
Cap rate
0.5%
Rent to Value Ratio
Active
$265,000
2
bds
|
2
ba
|
1,787
sqft
|
built
1945
4247 S Owasso Ave, Tulsa, OK 74105
$-402
Cash flow
-7.9%
Cash-on-Cash Return
3.9%
Cap rate
0.6%
Rent to Value Ratio