74115 Investment Properties for Sale
Browse homes for sale and investment properties in 74115. Refine your search by price, property type, or more.
Best cash flowing properties in 74115
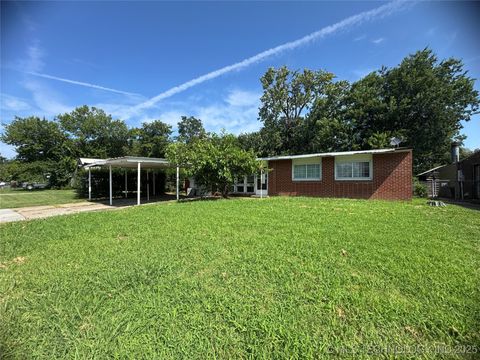
Active
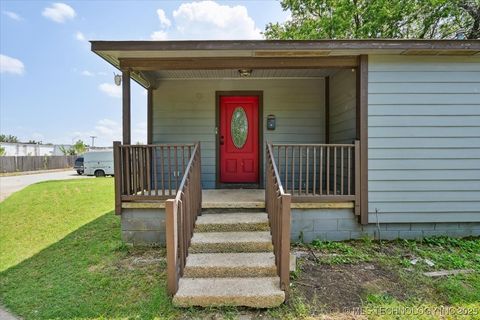
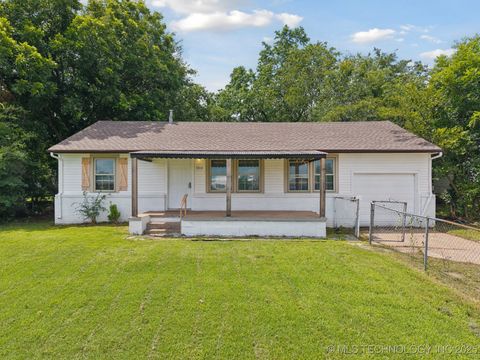
$65,000
4
bds
|
1
ba
|
1,014
sqft
|
built
1954
7847 E Latimer Pl, Tulsa, OK 74115
$823
Cash flow
14.8%
Cash-on-Cash Return
15.2%
Cap rate
2.0%
Rent to Value Ratio

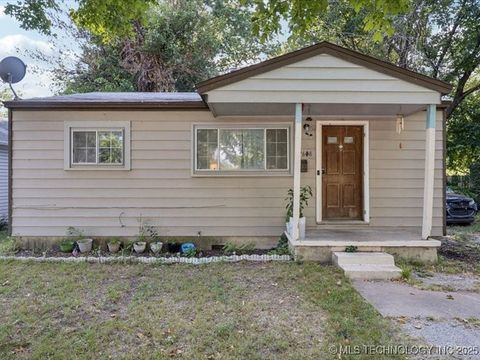
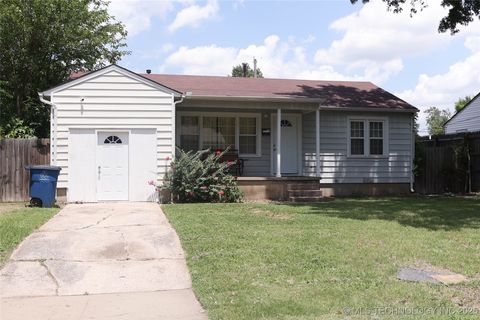
Active
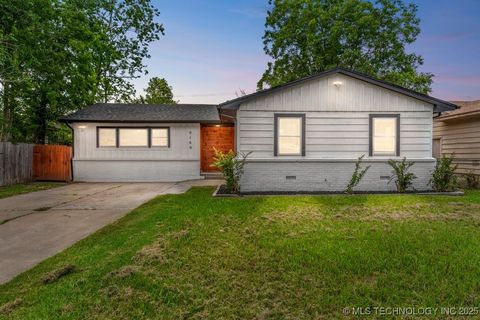
$70,000
4
bds
|
1
ba
|
1,387
sqft
|
built
1949
6245 E Latimer St, Tulsa, OK 74115
$820
Cash flow
13.6%
Cash-on-Cash Return
14.1%
Cap rate
1.9%
Rent to Value Ratio
45 out of 48 properties for sale in 74115
Limited Results Shown
Create a free account, or log in to reveal all property listings and enjoy the complete experience.
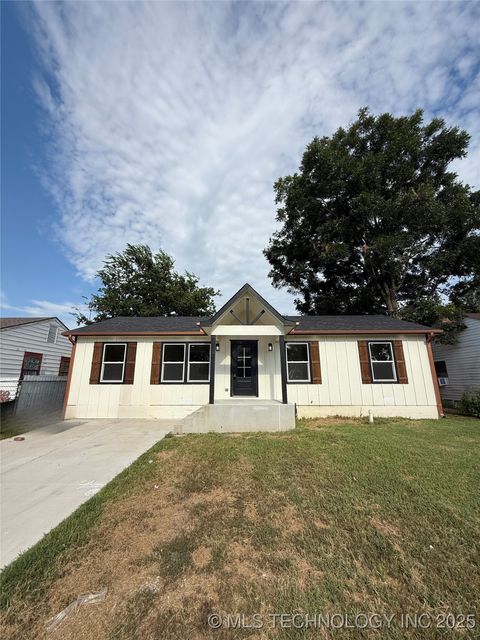
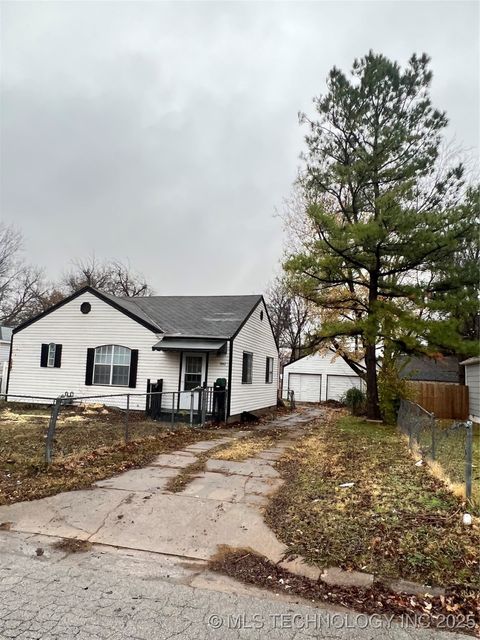
Active
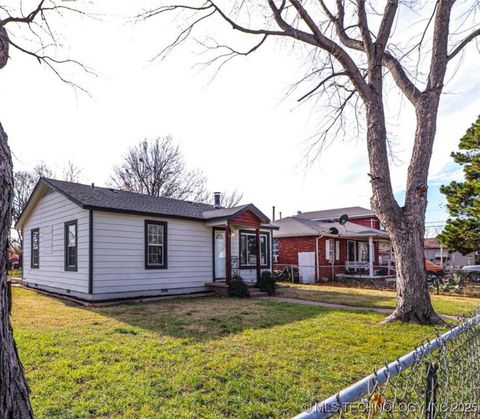
$145,000
2
bds
|
1
ba
|
720
sqft
|
built
1955
2638 N Maplewood Ave, Tulsa, OK 74115
$-21
Cash flow
-0.8%
Cash-on-Cash Return
5.5%
Cap rate
0.7%
Rent to Value Ratio

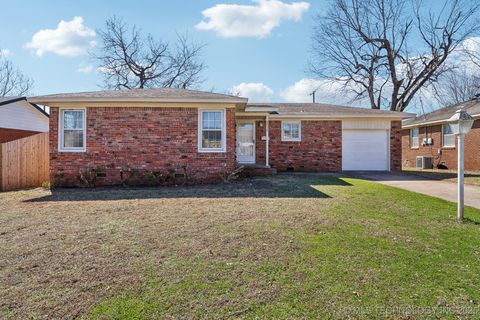
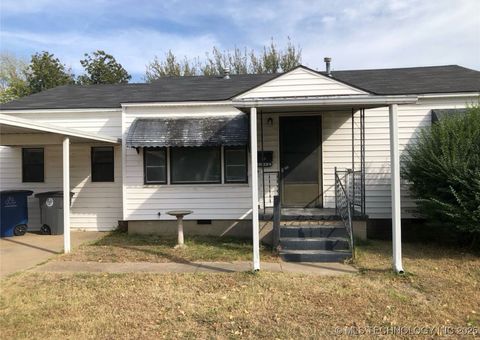
Active
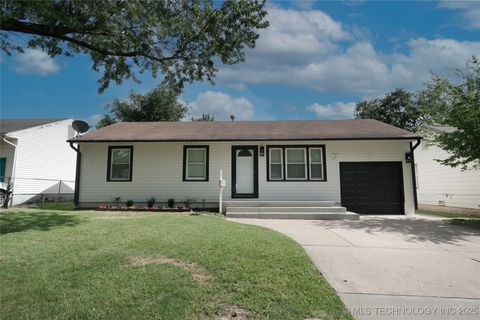
$75,000
3
bds
|
2
ba
|
1,396
sqft
|
built
1949
1003 N Urbana Ave, Tulsa, OK 74115
$550
Cash flow
38.3%
Cash-on-Cash Return
14.5%
Cap rate
1.9%
Rent to Value Ratio
Active
$210,000
4
bds
|
2
ba
|
1,133
sqft
|
built
1952
1333 N Irvington Ave, Tulsa, OK 74115
$-315
Cash flow
-7.8%
Cash-on-Cash Return
3.9%
Cap rate
0.5%
Rent to Value Ratio
Active
$164,500
3
bds
|
1
ba
|
1,157
sqft
|
built
1957
8930 E Marshall St, Tulsa, OK 74115
$-33
Cash flow
-1.0%
Cash-on-Cash Return
5.4%
Cap rate
0.7%
Rent to Value Ratio
Active
$344,900
3
bds
|
2
ba
|
2,648
sqft
|
built
2003
5803 E Easton St, Tulsa, OK 74115
$-808
Cash flow
-12.2%
Cash-on-Cash Return
2.9%
Cap rate
0.4%
Rent to Value Ratio
Active
$214,900
3
bds
|
2
ba
|
1,024
sqft
|
built
1950
1124 N Allegheny Ave, Tulsa, OK 74115
$-200
Cash flow
-4.9%
Cash-on-Cash Return
4.6%
Cap rate
0.6%
Rent to Value Ratio
Active
$275,000
3
bds
|
2
ba
|
2,068
sqft
|
built
2008
517 N Irvington Ave, Tulsa, OK 74115
$-454
Cash flow
-8.6%
Cash-on-Cash Return
3.7%
Cap rate
0.5%
Rent to Value Ratio
Active
$295,000
3
bds
|
2
ba
|
2,068
sqft
|
built
2008
523 N Irvington Ave, Tulsa, OK 74115
$-549
Cash flow
-9.7%
Cash-on-Cash Return
3.4%
Cap rate
0.5%
Rent to Value Ratio
Active
$165,000
4
bds
|
2
ba
|
1,512
sqft
|
built
1965
1070 N Irvington Ave, Tulsa, OK 74115
$-10
Cash flow
-0.3%
Cash-on-Cash Return
5.6%
Cap rate
0.8%
Rent to Value Ratio
Active
$134,900
3
bds
|
1
ba
|
864
sqft
|
built
1952
7317 E King Pl, Tulsa, OK 74115
$122
Cash flow
4.7%
Cash-on-Cash Return
6.8%
Cap rate
0.9%
Rent to Value Ratio
Active
$215,000
4
bds
|
2
ba
|
1,132
sqft
|
built
1952
6763 E Independence Pl, Tulsa, OK 74115
$-317
Cash flow
-7.7%
Cash-on-Cash Return
3.9%
Cap rate
0.5%
Rent to Value Ratio
Active
$115,000
3
bds
|
1
ba
|
1,326
sqft
|
built
1951
1441 N Kingston Ave, Tulsa, OK 74115
$357
Cash flow
16.2%
Cash-on-Cash Return
9.4%
Cap rate
1.2%
Rent to Value Ratio
Active
$140,000
2
bds
|
1
ba
|
720
sqft
|
built
1950
1226 N Oswego Ave, Tulsa, OK 74115
$47
Cash flow
1.8%
Cash-on-Cash Return
6.1%
Cap rate
0.8%
Rent to Value Ratio
Active
$214,999
3
bds
|
2
ba
|
1,381
sqft
|
built
1948
1823 N Harvard Ave, Tulsa, OK 74115
$-375
Cash flow
-9.1%
Cash-on-Cash Return
3.6%
Cap rate
0.5%
Rent to Value Ratio
Active
$120,000
3
bds
|
1
ba
|
960
sqft
|
built
1956
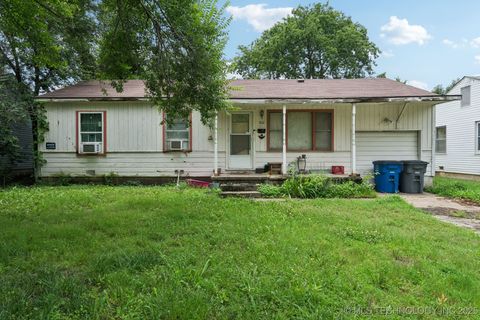
3904 E Young St, Tulsa, OK 74115
$247
Cash flow
10.7%
Cash-on-Cash Return
8.2%
Cap rate
1.0%
Rent to Value Ratio
Active
$138,000
3
bds
|
1
ba
|
1,365
sqft
|
built
1947
1204 N Urbana Ave, Tulsa, OK 74115
$33
Cash flow
1.2%
Cash-on-Cash Return
6.0%
Cap rate
0.8%
Rent to Value Ratio
Active
$149,900
4
bds
|
2
ba
|
1,392
sqft
|
built
1945
2420 N Oxford Ave, Tulsa, OK 74115
$-42
Cash flow
-1.5%
Cash-on-Cash Return
5.3%
Cap rate
0.8%
Rent to Value Ratio
Active
$155,000
2
bds
|
1
ba
|
849
sqft
|
built
1951
5923 E King Pl, Tulsa, OK 74115
$33
Cash flow
1.1%
Cash-on-Cash Return
5.9%
Cap rate
0.8%
Rent to Value Ratio
Active
$115,000
2
bds
|
1
ba
|
1,236
sqft
|
built
1948
1942 N Norwood Ave, Tulsa, OK 74115
$107
Cash flow
4.9%
Cash-on-Cash Return
6.8%
Cap rate
0.9%
Rent to Value Ratio
Active
$114,000
2
bds
|
1
ba
|
984
sqft
|
built
1948
1215 N Yale Ave, Tulsa, OK 74115
$91
Cash flow
4.2%
Cash-on-Cash Return
6.6%
Cap rate
0.9%
Rent to Value Ratio
Active
$169,900
3
bds
|
1
ba
|
950
sqft
|
built
1954
7314 E Newton Pl, Tulsa, OK 74115
$65
Cash flow
2.0%
Cash-on-Cash Return
6.1%
Cap rate
0.8%
Rent to Value Ratio
Active
$245,000
3
bds
|
3
ba
|
1,500
sqft
|
built
1957
9169 E Marshall Pl, Tulsa, OK 74115
$-299
Cash flow
-6.4%
Cash-on-Cash Return
4.2%
Cap rate
0.6%
Rent to Value Ratio
Active
$165,000
4
bds
|
1
ba
|
1,230
sqft
|
built
1950
6344 E Zion Pl, Tulsa, OK 74115
$138
Cash flow
4.4%
Cash-on-Cash Return
6.7%
Cap rate
0.8%
Rent to Value Ratio
Active
$175,000
3
bds
|
1
ba
|
925
sqft
|
built
1952
6240 E Latimer Pl, Tulsa, OK 74115
$11
Cash flow
0.3%
Cash-on-Cash Return
5.8%
Cap rate
0.7%
Rent to Value Ratio
Active
$80,000
3
bds
|
1
ba
|
888
sqft
|
built
1952
1012 N Irvington Ave, Tulsa, OK 74115
$385
Cash flow
25.1%
Cash-on-Cash Return
11.5%
Cap rate
1.5%
Rent to Value Ratio
Active
$123,900
3
bds
|
1
ba
|
1,238
sqft
|
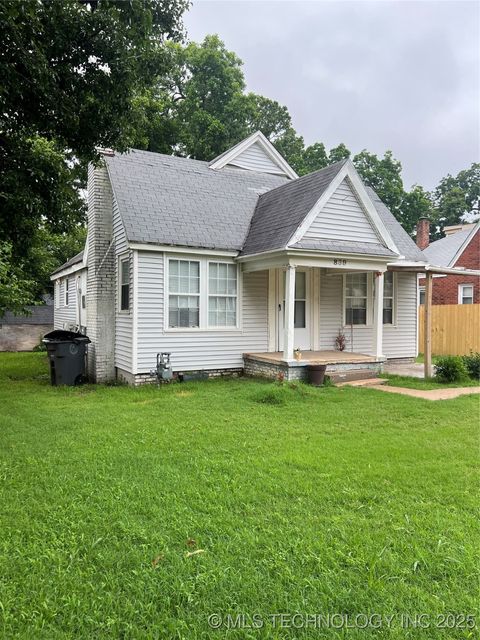
built
1940
839 N New Haven Ave, Tulsa, OK 74115
$359
Cash flow
15.1%
Cash-on-Cash Return
9.2%
Cap rate
1.1%
Rent to Value Ratio

Active
$65,000
4
bds
|
1
ba
|
1,123
sqft
|
built
1952
7304 E King Pl, Tulsa, OK 74115
$688
Cash flow
12.3%
Cash-on-Cash Return
12.7%
Cap rate
1.7%
Rent to Value Ratio

Active
$47,000
2
bds
|
1
ba
|
792
sqft
|
built
1950
4718 E Latimer Pl, Tulsa, OK 74115
$716
Cash flow
17.7%
Cash-on-Cash Return
18.3%
Cap rate
2.3%
Rent to Value Ratio

Active
$60,000
3
bds
|
1
ba
|
1,080
sqft
|
built
1950
1514 N Oswego Ave, Tulsa, OK 74115
$646
Cash flow
12.5%
Cash-on-Cash Return
12.9%
Cap rate
1.7%
Rent to Value Ratio

Active
$50,000
2
bds
|
1
ba
|
816
sqft
|
built
1950
1809 N Oswego Ave, Tulsa, OK 74115
$715
Cash flow
16.7%
Cash-on-Cash Return
17.2%
Cap rate
2.2%
Rent to Value Ratio

Active
$172,900
3
bds
|
2
ba
|
1,072
sqft
|
built
1957
821 N 71st East Ave, Tulsa, OK 74115
$-188
Cash flow
-5.7%
Cash-on-Cash Return
4.4%
Cap rate
0.6%
Rent to Value Ratio

Active
$185,000
2
bds
|
2
ba
|
1,248
sqft
|
built
1927
3504 E Haskell St, Tulsa, OK 74115
$-67
Cash flow
-1.9%
Cash-on-Cash Return
5.2%
Cap rate
0.7%
Rent to Value Ratio

Active
$189,000
4
bds
|
2
ba
|
1,093
sqft
|
built
1952
6837 E King Pl, Tulsa, OK 74115
$-131
Cash flow
-3.6%
Cash-on-Cash Return
4.8%
Cap rate
0.6%
Rent to Value Ratio

Active
$140,000
3
bds
|
1
ba
|
912
sqft
|
built
1956
2409 N Urbana Ave, Tulsa, OK 74115
$160
Cash flow
6.0%
Cash-on-Cash Return
7.1%
Cap rate
1.0%
Rent to Value Ratio

Active
$140,000
4
bds
|
2
ba
|
1,200
sqft
|
built
1952
6250 E Latimer St, Tulsa, OK 74115
$224
Cash flow
8.3%
Cash-on-Cash Return
7.6%
Cap rate
1.0%
Rent to Value Ratio

Active
$172,550
4
bds
|
2
ba
|
1,304
sqft
|
built
1973
6209 E Young Pl, Tulsa, OK 74115
$-133
Cash flow
-4.0%
Cash-on-Cash Return
4.8%
Cap rate
0.6%
Rent to Value Ratio

Active
$129,900
2
bds
|
1
ba
|
1,392
sqft
|
built
1952
6934 E Marshall St, Tulsa, OK 74115
$-90
Cash flow
-3.6%
Cash-on-Cash Return
4.8%
Cap rate
1.1%
Rent to Value Ratio

Active
$110,000
3
bds
|
1
ba
|
1,047
sqft
|
built
1947
1921 N Norwood Ave, Tulsa, OK 74115
$272
Cash flow
12.9%
Cash-on-Cash Return
8.7%
Cap rate
1.1%
Rent to Value Ratio