74137 Investment Properties for Sale
Browse homes for sale and investment properties in 74137. Refine your search by price, property type, or more.
Best cash flowing properties in 74137
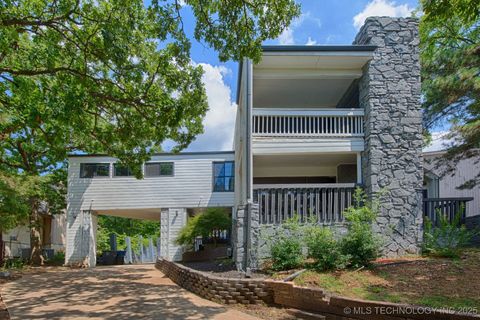
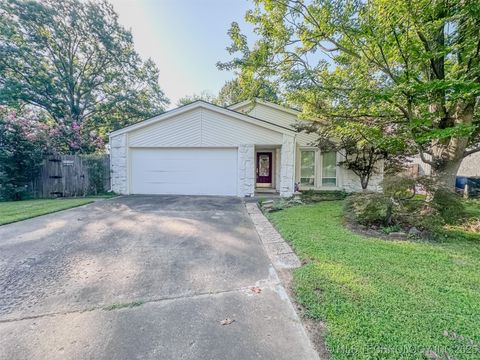
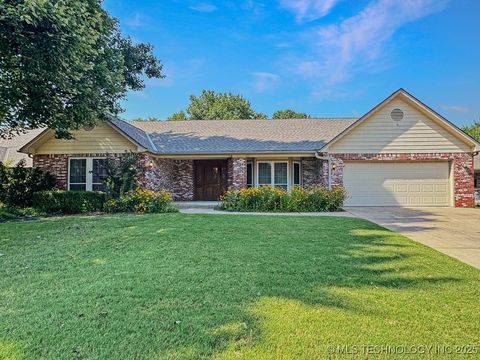
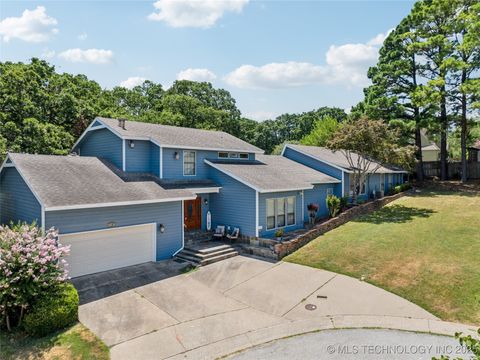
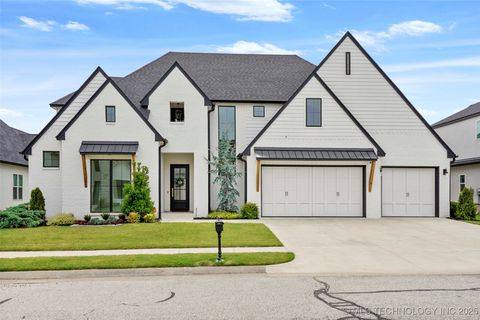
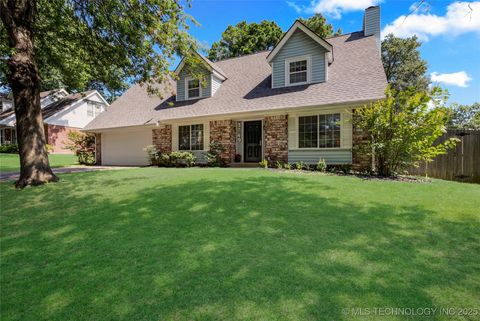
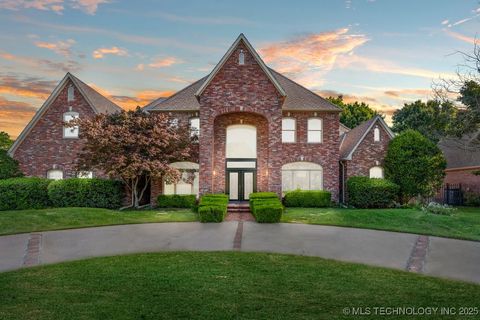
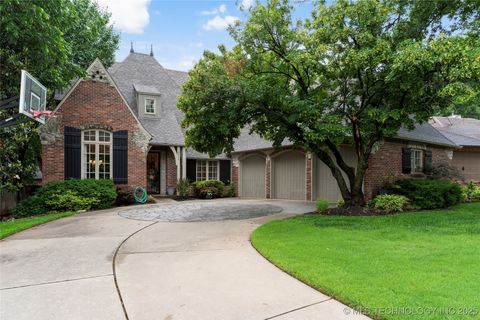
Active
$370,000
3
bds
|
3
ba
|
3,413
sqft
|
built
1977
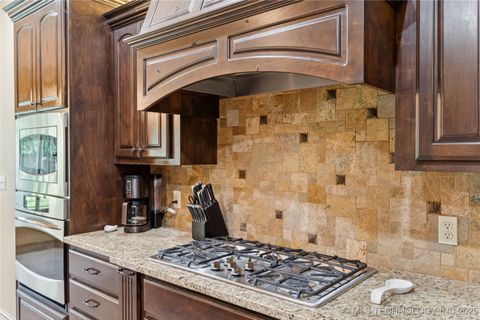
8411 S Toledo Ave, Tulsa, OK 74137
$314
Cash flow
4.4%
Cash-on-Cash Return
6.7%
Cap rate
0.9%
Rent to Value Ratio
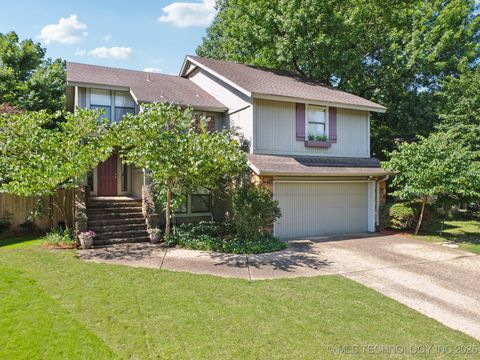
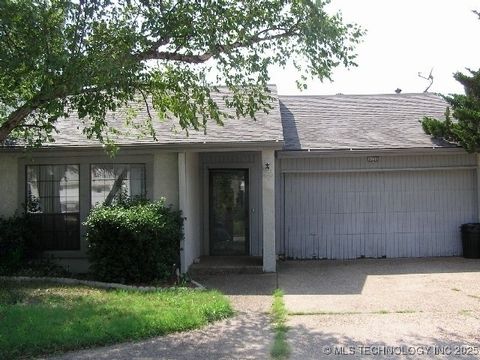
Active
$149,000
2
bds
|
2
ba
|
1,064
sqft
|
built
1982
9009 S Delaware Ave, Tulsa, OK 74137
$-167
Cash flow
-5.8%
Cash-on-Cash Return
4.3%
Cap rate
0.9%
Rent to Value Ratio
64 out of 73 properties for sale in 74137
Limited Results Shown
Create a free account, or log in to reveal all property listings and enjoy the complete experience.
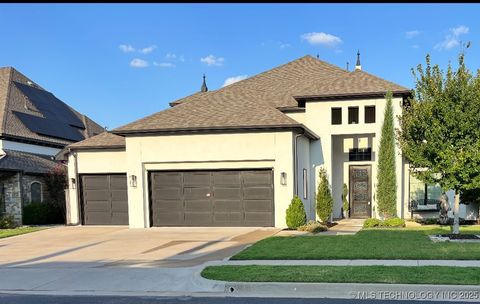
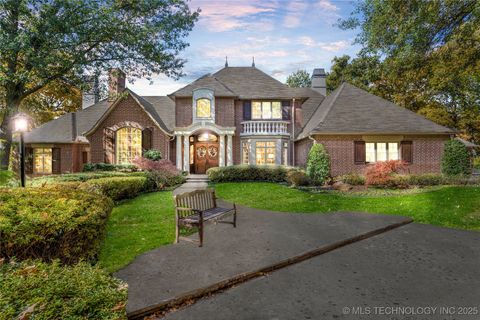
Active
$335,000
3
bds
|
3
ba
|
2,967
sqft
|
built
1981
9337 S Lakewood Ave, Tulsa, OK 74137
$-265
Cash flow
-4.1%
Cash-on-Cash Return
4.7%
Cap rate
0.7%
Rent to Value Ratio
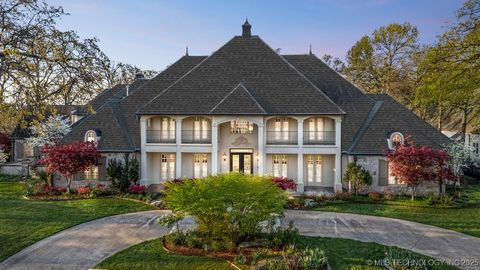
Active
$655,000
3
bds
|
4
ba
|
3,614
sqft
|
built
2019
12015 S Urbana Ave, Tulsa, OK 74137
$-1,143
Cash flow
-9.1%
Cash-on-Cash Return
3.6%
Cap rate
0.6%
Rent to Value Ratio

Active
$145,000
2
bds
|
2
ba
|
1,112
sqft
|
built
1981
2838 E 90th St, Tulsa, OK 74137
$-220
Cash flow
-7.9%
Cash-on-Cash Return
3.9%
Cap rate
0.9%
Rent to Value Ratio

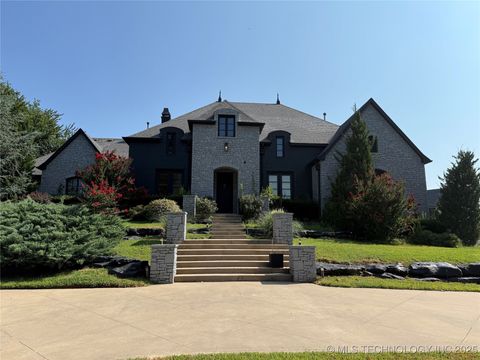
Active
$629,000
6
bds
|
5
ba
|
3,813
sqft
|
built
1990
10219 S Canton Ave, Tulsa, OK 74137
$-1,350
Cash flow
-11.2%
Cash-on-Cash Return
3.1%
Cap rate
0.5%
Rent to Value Ratio
Active
$275,000
3
bds
|
2
ba
|
1,688
sqft
|
built
1977
3356 E 83rd Pl, Tulsa, OK 74137
$-272
Cash flow
-5.2%
Cash-on-Cash Return
4.5%
Cap rate
0.7%
Rent to Value Ratio
Active
$3,290,000
4
bds
|
6
ba
|
6,586
sqft
|
built
1977
4949 E 114th Pl, Tulsa, OK 74137
$-13,681
Cash flow
-21.7%
Cash-on-Cash Return
0.7%
Cap rate
0.1%
Rent to Value Ratio
Active
$349,000
3
bds
|
3
ba
|
2,248
sqft
|
built
1983
9141 S Lakewood Ave, Tulsa, OK 74137
$-354
Cash flow
-5.3%
Cash-on-Cash Return
4.5%
Cap rate
0.7%
Rent to Value Ratio
Active
$549,000
5
bds
|
4
ba
|
5,013
sqft
|
built
1980
3333 E 109th St, Tulsa, OK 74137
$-949
Cash flow
-9.0%
Cash-on-Cash Return
3.6%
Cap rate
0.6%
Rent to Value Ratio
Active
$750,000
4
bds
|
2
ba
|
2,070
sqft
|
built
1967
3740 E 104th St, Tulsa, OK 74137
$-2,132
Cash flow
-14.8%
Cash-on-Cash Return
2.3%
Cap rate
0.3%
Rent to Value Ratio
Active
$399,000
4
bds
|
3
ba
|
3,294
sqft
|
built
1990
5615 E 103rd St, Tulsa, OK 74137
$-356
Cash flow
-4.7%
Cash-on-Cash Return
4.6%
Cap rate
0.7%
Rent to Value Ratio
Active
$2,100,000
4
bds
|
6
ba
|
7,260
sqft
|
built
1999
11428 S Sandusky Ave, Tulsa, OK 74137
$-8,717
Cash flow
-21.7%
Cash-on-Cash Return
0.7%
Cap rate
0.2%
Rent to Value Ratio
Active
$2,695,000
7
bds
|
10
ba
|
11,579
sqft
|
built
2003
6308 E 105th St, Tulsa, OK 74137
$-13,614
Cash flow
-26.4%
Cash-on-Cash Return
-0.4%
Cap rate
0.1%
Rent to Value Ratio
Active
$950,000
4
bds
|
5
ba
|
5,449
sqft
|
built
2008
11922 S Kingston Ave, Tulsa, OK 74137
$-2,279
Cash flow
-12.5%
Cash-on-Cash Return
2.8%
Cap rate
0.5%
Rent to Value Ratio
Active
$365,000
3
bds
|
4
ba
|
3,303
sqft
|
built
1981
6226 E 98th St, Tulsa, OK 74137
$-173
Cash flow
-2.5%
Cash-on-Cash Return
5.1%
Cap rate
0.8%
Rent to Value Ratio

Active
$599,000
4
bds
|
4
ba
|
4,236
sqft
|
built
1992
3528 E 102nd Pl, Tulsa, OK 74137
$-1,149
Cash flow
-10.0%
Cash-on-Cash Return
3.4%
Cap rate
0.5%
Rent to Value Ratio
Active
$1,525,000
5
bds
|
6
ba
|
6,387
sqft
|
built
1999
4937 E 92nd St, Tulsa, OK 74137
$-5,299
Cash flow
-18.1%
Cash-on-Cash Return
1.5%
Cap rate
0.3%
Rent to Value Ratio
Active
$368,900
4
bds
|
3
ba
|
2,547
sqft
|
built
1975
8242 S Sandusky Ave, Tulsa, OK 74137
$-627
Cash flow
-8.9%
Cash-on-Cash Return
3.6%
Cap rate
0.5%
Rent to Value Ratio
Active
$397,900
4
bds
|
2
ba
|
2,065
sqft
|
built
1976
10717 S Richmond Pl, Tulsa, OK 74137
$-718
Cash flow
-9.4%
Cash-on-Cash Return
3.5%
Cap rate
0.6%
Rent to Value Ratio

Active
$439,900
4
bds
|
3
ba
|
2,916
sqft
|
built
1992
11227 S Oxford Ave, Tulsa, OK 74137
$-455
Cash flow
-5.4%
Cash-on-Cash Return
4.4%
Cap rate
0.6%
Rent to Value Ratio
Active
$565,000
4
bds
|
4
ba
|
3,311
sqft
|
built
2009
12010 S Oswego Ave, Tulsa, OK 74137
$-1,091
Cash flow
-10.1%
Cash-on-Cash Return
3.4%
Cap rate
0.5%
Rent to Value Ratio
Active
$158,500
2
bds
|
2
ba
|
1,122
sqft
|
built
1984
4607 E 93rd Ct, Tulsa, OK 74137
$-317
Cash flow
-10.4%
Cash-on-Cash Return
3.3%
Cap rate
0.9%
Rent to Value Ratio
Active
$450,000
4
bds
|
4
ba
|
2,710
sqft
|
built
1993
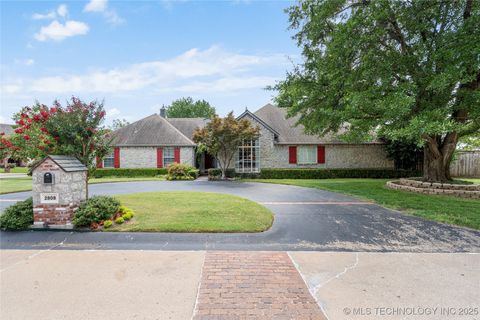
2808 E 82nd Pl, Tulsa, OK 74137
$-911
Cash flow
-10.6%
Cash-on-Cash Return
3.3%
Cap rate
0.5%
Rent to Value Ratio
Active
$300,000
3
bds
|
2
ba
|
2,269
sqft
|
built
1975
8123 S Quebec Ave, Tulsa, OK 74137
$-231
Cash flow
-4.0%
Cash-on-Cash Return
4.8%
Cap rate
0.7%
Rent to Value Ratio
Active
$845,000
5
bds
|
6
ba
|
4,278
sqft
|
built
2021
3020 E 102nd Pl, Tulsa, OK 74137
$-1,841
Cash flow
-11.4%
Cash-on-Cash Return
3.1%
Cap rate
0.5%
Rent to Value Ratio
Active
$510,000
3
bds
|
3
ba
|
2,728
sqft
|
built
1995
11712 S Allegheny Ave, Tulsa, OK 74137
$-942
Cash flow
-9.6%
Cash-on-Cash Return
3.5%
Cap rate
0.6%
Rent to Value Ratio
Active
$629,900
4
bds
|
4
ba
|
3,691
sqft
|
built
1993
3437 E 96th Pl, Tulsa, OK 74137
$-1,438
Cash flow
-11.9%
Cash-on-Cash Return
2.9%
Cap rate
0.5%
Rent to Value Ratio
Active
$875,000
5
bds
|
4
ba
|
4,721
sqft
|
built
2005
4620 E 108th Pl, Tulsa, OK 74137
$-1,898
Cash flow
-11.3%
Cash-on-Cash Return
3.1%
Cap rate
0.5%
Rent to Value Ratio
Active
$295,000
4
bds
|
2
ba
|
2,253
sqft
|
built
1974
3749 E 83rd St, Tulsa, OK 74137
$-237
Cash flow
-4.2%
Cash-on-Cash Return
4.7%
Cap rate
0.7%
Rent to Value Ratio

Active
$714,900
4
bds
|
5
ba
|
4,253
sqft
|
built
1983
4335 E 87th St, Tulsa, OK 74137
$-1,781
Cash flow
-13.0%
Cash-on-Cash Return
2.7%
Cap rate
0.4%
Rent to Value Ratio
Active
$550,000
4
bds
|
3
ba
|
3,387
sqft
|
built
1977
4235 E 104th St, Tulsa, OK 74137
$-922
Cash flow
-8.7%
Cash-on-Cash Return
3.7%
Cap rate
0.5%
Rent to Value Ratio
Active
$850,000
4
bds
|
5
ba
|
3,991
sqft
|
built
2014
6325 E 110th St, Tulsa, OK 74137
$-2,712
Cash flow
-16.6%
Cash-on-Cash Return
1.8%
Cap rate
0.4%
Rent to Value Ratio
Active
$750,000
4
bds
|
5
ba
|
4,455
sqft
|
built
1994
10150 S Maplewood Ave, Tulsa, OK 74137
$-2,321
Cash flow
-16.1%
Cash-on-Cash Return
2.0%
Cap rate
0.4%
Rent to Value Ratio
Active
$799,999
5
bds
|
6
ba
|
5,949
sqft
|
built
1996
5501 E 108th St, Tulsa, OK 74137
$-2,228
Cash flow
-14.5%
Cash-on-Cash Return
2.3%
Cap rate
0.4%
Rent to Value Ratio
Active
$854,900
4
bds
|
3
ba
|
4,579
sqft
|
built
2001
3310 E 94th St, Tulsa, OK 74137
$-1,620
Cash flow
-9.9%
Cash-on-Cash Return
3.4%
Cap rate
0.6%
Rent to Value Ratio
Active
$575,000
4
bds
|
4
ba
|
3,731
sqft
|
built
1999
9632 S Vandalia Ave, Tulsa, OK 74137
$-1,250
Cash flow
-11.3%
Cash-on-Cash Return
3.1%
Cap rate
0.5%
Rent to Value Ratio
Active
$690,000
5
bds
|
5
ba
|
4,994
sqft
|
built
1976
9916 S Quebec Ave, Tulsa, OK 74137
$-1,416
Cash flow
-10.7%
Cash-on-Cash Return
3.2%
Cap rate
0.5%
Rent to Value Ratio
Active
$579,000
5
bds
|
4
ba
|
4,545
sqft
|
built
1997
9034 S Maplewood Ave, Tulsa, OK 74137
$-591
Cash flow
-5.3%
Cash-on-Cash Return
4.5%
Cap rate
0.7%
Rent to Value Ratio
Active
$250,000
3
bds
|
2
ba
|
1,932
sqft
|
built
1979
8228 S Jamestown Ave, Tulsa, OK 74137
$-175
Cash flow
-3.7%
Cash-on-Cash Return
4.8%
Cap rate
0.7%
Rent to Value Ratio