76559 Investment Properties for Sale
Browse homes for sale and investment properties in 76559. Refine your search by price, property type, or more.
Best cash flowing properties in 76559
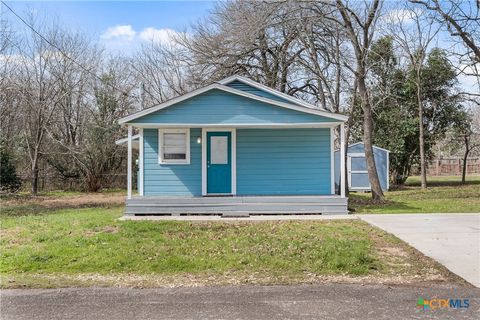
Active
$120,000
2
bds
|
1
ba
|
880
sqft
|
built
1930
503 N Main St, Nolanville, TX 76559
$208
Cash flow
9.0%
Cash-on-Cash Return
7.8%
Cap rate
1.2%
Rent to Value Ratio
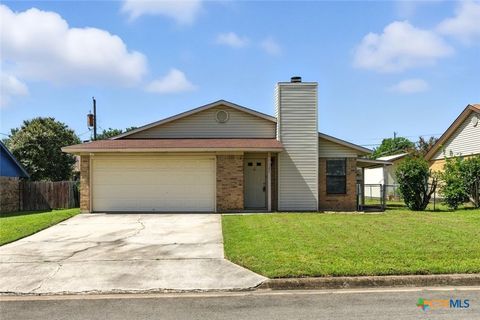
Active
$194,900
3
bds
|
2
ba
|
1,128
sqft
|
built
1986
127 Jordan Loop, Nolanville, TX 76559
$-229
Cash flow
-6.1%
Cash-on-Cash Return
4.3%
Cap rate
0.7%
Rent to Value Ratio
30 out of 53 properties for sale in 76559
Limited Results Shown
Create a free account, or log in to reveal all property listings and enjoy the complete experience.
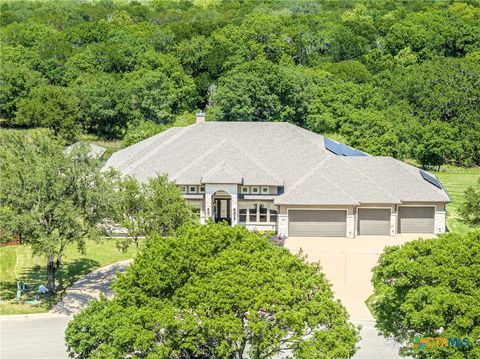
Active
$1,040,000
4
bds
|
5
ba
|
3,182
sqft
|
built
2021
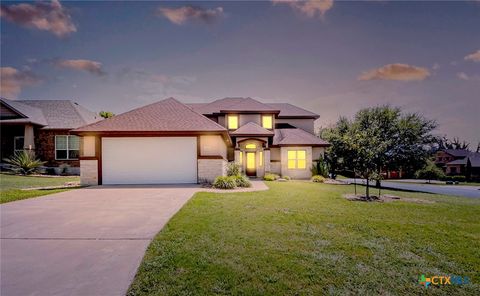
4013 Turning Leaf Dr, Nolanville, TX 76559
$-4,384
Cash flow
-22.0%
Cash-on-Cash Return
0.6%
Cap rate
0.2%
Rent to Value Ratio
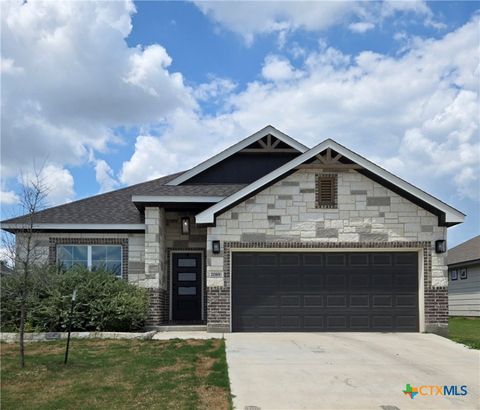
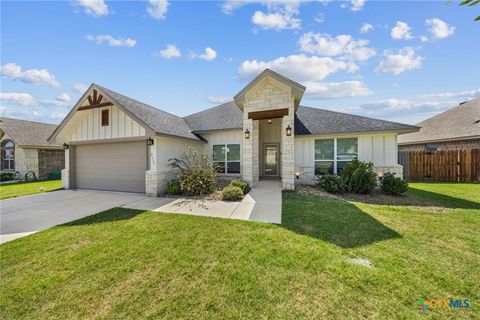
Active
$302,500
4
bds
|
2
ba
|
1,671
sqft
|
built
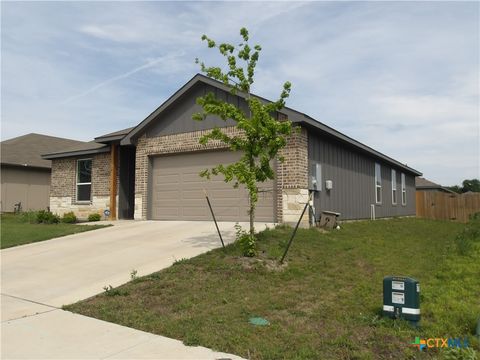
2023
2089 Mercer St, Nolanville, TX 76559
$-378
Cash flow
-6.5%
Cash-on-Cash Return
4.2%
Cap rate
0.7%
Rent to Value Ratio
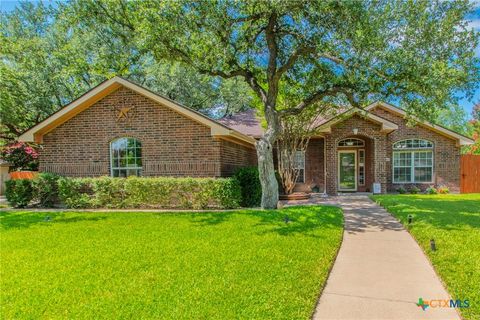
Active
$305,000
4
bds
|
2
ba
|
2,199
sqft
|
built
2022
770 Freedom Cir, Nolanville, TX 76559
$-293
Cash flow
-5.0%
Cash-on-Cash Return
4.5%
Cap rate
0.8%
Rent to Value Ratio
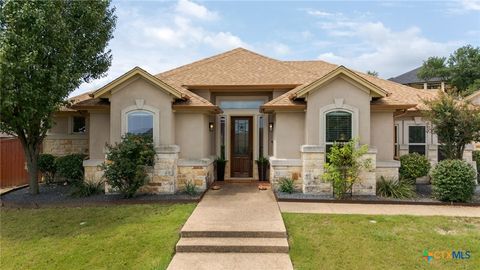
Active
$430,000
4
bds
|
3
ba
|
2,494
sqft
|
built
2010
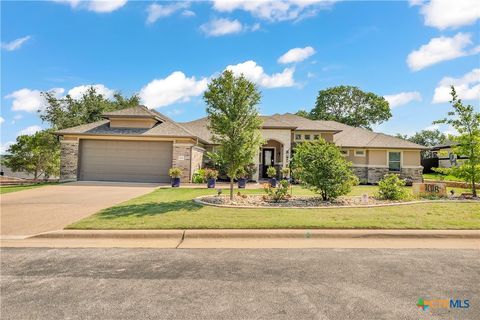
3014 Bent Tree Dr, Nolanville, TX 76559
$-1,258
Cash flow
-15.3%
Cash-on-Cash Return
2.2%
Cap rate
0.5%
Rent to Value Ratio
Active
$259,000
4
bds
|
2
ba
|
1,668
sqft
|
built
2005
112 Cedar Ridge Dr, Nolanville, TX 76559
$-431
Cash flow
-8.7%
Cash-on-Cash Return
3.7%
Cap rate
0.7%
Rent to Value Ratio
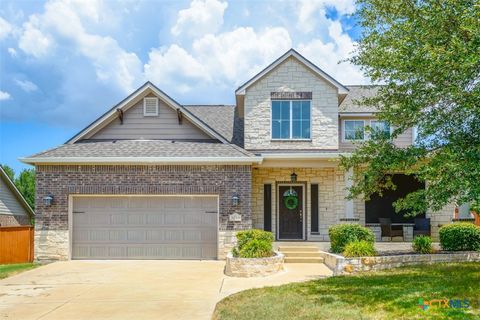
Active
$635,000
4
bds
|
3
ba
|
3,188
sqft
|
built
2023
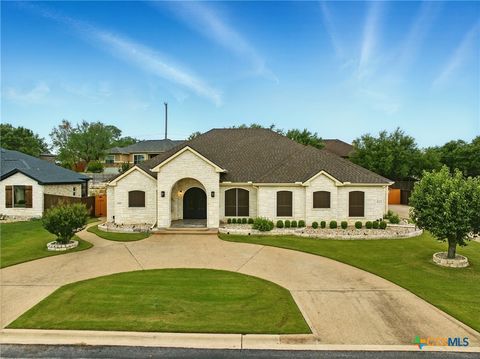
914 High Plains Dr, Nolanville, TX 76559
$-1,615
Cash flow
-13.3%
Cash-on-Cash Return
2.6%
Cap rate
0.6%
Rent to Value Ratio
Active
$374,000
4
bds
|
3
ba
|
2,307
sqft
|
built
2015
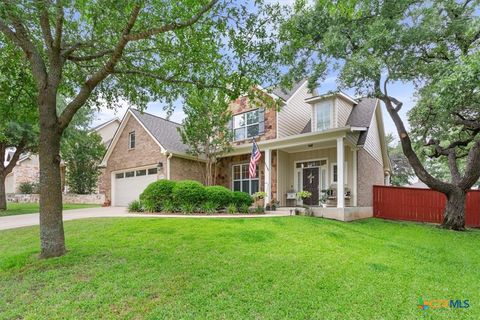
3001 Bent Tree Dr, Nolanville, TX 76559
$-939
Cash flow
-13.1%
Cash-on-Cash Return
2.7%
Cap rate
0.6%
Rent to Value Ratio
Active
$399,000
4
bds
|
3
ba
|
2,233
sqft
|
built
2022
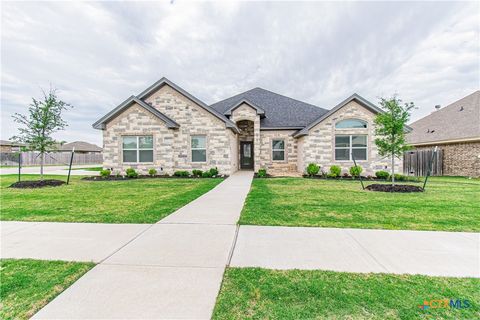
2117 Mercer St, Nolanville, TX 76559
$-539
Cash flow
-7.0%
Cash-on-Cash Return
4.1%
Cap rate
0.7%
Rent to Value Ratio
Active
$379,900
4
bds
|
3
ba
|
2,213
sqft
|
built
2000
104 Jesse James Dr, Nolanville, TX 76559
$-772
Cash flow
-10.6%
Cash-on-Cash Return
3.2%
Cap rate
0.6%
Rent to Value Ratio
Active
$529,000
4
bds
|
3
ba
|
2,822
sqft
|
built
2008
1135 Redleaf Dr, Nolanville, TX 76559
$-1,524
Cash flow
-15.0%
Cash-on-Cash Return
2.2%
Cap rate
0.5%
Rent to Value Ratio
Active
$850,000
6
bds
|
4
ba
|
3,855
sqft
|
built
2019
2037 Heritage Loop, Nolanville, TX 76559
$-2,478
Cash flow
-15.2%
Cash-on-Cash Return
2.2%
Cap rate
0.4%
Rent to Value Ratio
Active
$305,000
bds
|
0
ba
|
2,265
sqft
|
built
2007
403 W Dale Ave, Nolanville, TX 76559
$-1,077
Cash flow
-18.4%
Cash-on-Cash Return
1.4%
Cap rate
0.3%
Rent to Value Ratio
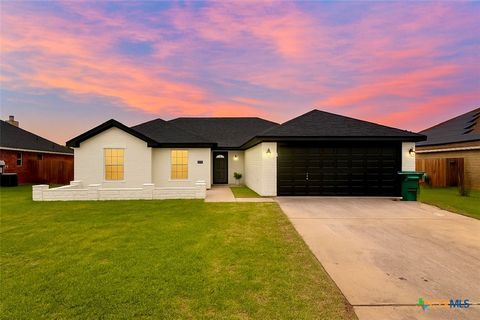
Active
$277,000
3
bds
|
2
ba
|
1,572
sqft
|
built
2021
766 Freedom Cir, Nolanville, TX 76559
$-331
Cash flow
-6.2%
Cash-on-Cash Return
4.2%
Cap rate
0.7%
Rent to Value Ratio
Active
$269,000
4
bds
|
0
ba
|
1,790
sqft
|
built
2017
209 Ryan Cir, Nolanville, TX 76559
$-376
Cash flow
-7.3%
Cash-on-Cash Return
4.0%
Cap rate
0.5%
Rent to Value Ratio
Active
$520,000
4
bds
|
4
ba
|
2,310
sqft
|
built
2021
1018 Bald Eagle, Nolanville, TX 76559
$-1,346
Cash flow
-13.5%
Cash-on-Cash Return
2.6%
Cap rate
0.5%
Rent to Value Ratio
Active
$520,000
3
bds
|
3
ba
|
2,258
sqft
|
built
2011
1127 Redleaf Dr, Nolanville, TX 76559
$-1,622
Cash flow
-16.3%
Cash-on-Cash Return
1.9%
Cap rate
0.4%
Rent to Value Ratio
Active
$374,000
4
bds
|
3
ba
|
2,153
sqft
|
built
2010
2005 Red Fox Dr, Nolanville, TX 76559
$-857
Cash flow
-12.0%
Cash-on-Cash Return
2.9%
Cap rate
0.6%
Rent to Value Ratio
Active
$389,000
4
bds
|
3
ba
|
2,241
sqft
|
built
2021
2109 Mercer St, Nolanville, TX 76559
$-738
Cash flow
-9.9%
Cash-on-Cash Return
3.4%
Cap rate
0.6%
Rent to Value Ratio
Active
$320,000
4
bds
|
2
ba
|
2,034
sqft
|
built
2022
714 Freedom Cir, Nolanville, TX 76559
$-591
Cash flow
-9.6%
Cash-on-Cash Return
3.5%
Cap rate
0.6%
Rent to Value Ratio
Active
$885,000
5
bds
|
3
ba
|
2,818
sqft
|
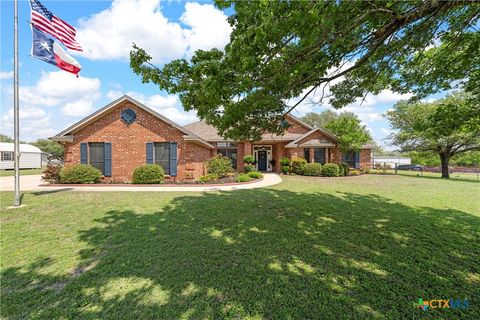
built
1996
1250 Old Nolanville Rd, Nolanville, TX 76559
$-2,901
Cash flow
-17.1%
Cash-on-Cash Return
1.7%
Cap rate
0.4%
Rent to Value Ratio
Active
$250,000
4
bds
|
2
ba
|
1,901
sqft
|
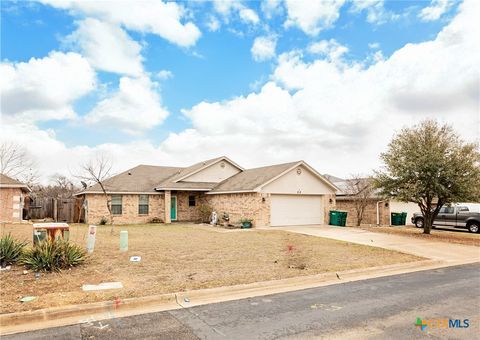
built
2005
212 Oak Ridge Dr, Nolanville, TX 76559
$-360
Cash flow
-7.5%
Cash-on-Cash Return
4.0%
Cap rate
0.7%
Rent to Value Ratio
Active
$534,500
4
bds
|
3
ba
|
2,397
sqft
|
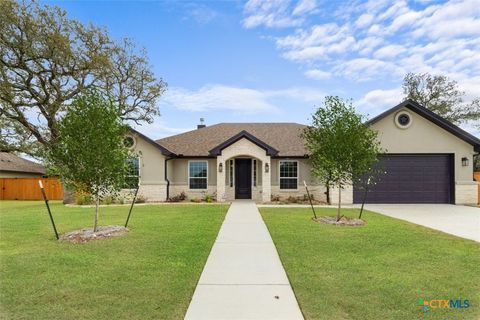
built
2024
4121 Turning Leaf Dr, Nolanville, TX 76559
$-390
Cash flow
-3.8%
Cash-on-Cash Return
4.8%
Cap rate
0.6%
Rent to Value Ratio
Active
$534,500
4
bds
|
3
ba
|
2,397
sqft
|
built
2024
4117 Turning Leaf Dr, Nolanville, TX 76559
$-597
Cash flow
-5.8%
Cash-on-Cash Return
4.3%
Cap rate
0.5%
Rent to Value Ratio
Active
$534,500
4
bds
|
3
ba
|
2,397
sqft
|
built
2024
4113 Turning Leaf Dr, Nolanville, TX 76559
$-528
Cash flow
-5.2%
Cash-on-Cash Return
4.5%
Cap rate
0.5%
Rent to Value Ratio
Active
$465,000
4
bds
|
3
ba
|
2,794
sqft
|
built
2008
8006 Ridgeway Ct, Nolanville, TX 76559
$-883
Cash flow
-9.9%
Cash-on-Cash Return
3.4%
Cap rate
0.6%
Rent to Value Ratio
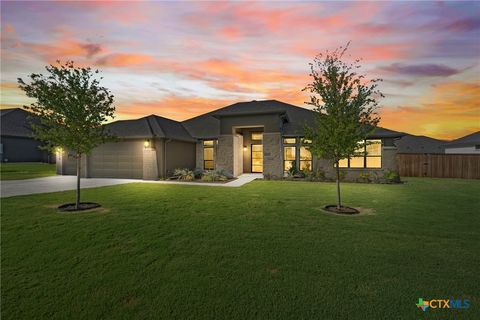
Active
$449,977
4
bds
|
3
ba
|
2,153
sqft
|
built
2023
1014 Winchester Dr, Nolanville, TX 76559
$-237
Cash flow
-2.7%
Cash-on-Cash Return
5.0%
Cap rate
0.6%
Rent to Value Ratio
Active
$457,808
4
bds
|
3
ba
|
2,272
sqft
|
built
2023
1018 Winchester Dr, Nolanville, TX 76559
$-274
Cash flow
-3.1%
Cash-on-Cash Return
5.0%
Cap rate
0.6%
Rent to Value Ratio

Active
$451,000
4
bds
|
3
ba
|
2,168
sqft
|
built
2023
1027 Winchester Dr, Nolanville, TX 76559
$-242
Cash flow
-2.8%
Cash-on-Cash Return
5.0%
Cap rate
0.6%
Rent to Value Ratio