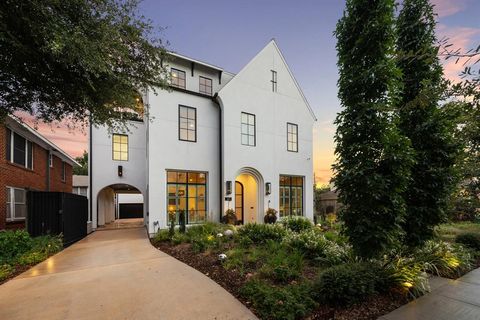
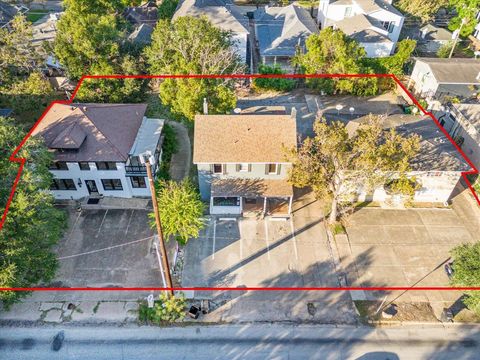
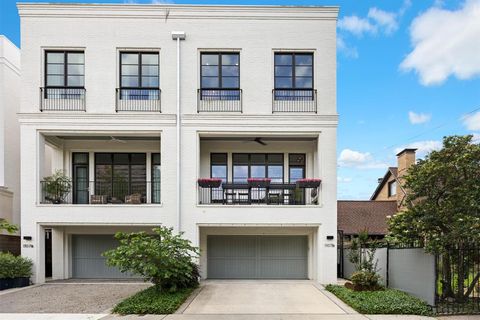
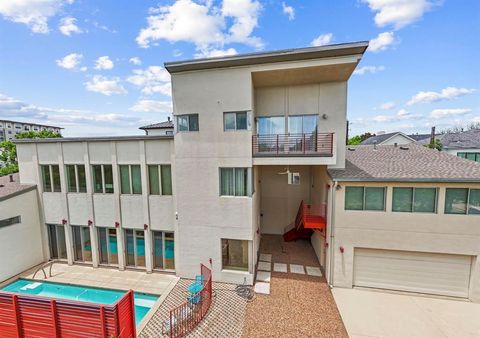
77006 Investment Properties for Sale
Browse homes for sale and investment properties in 77006. Refine your search by price, property type, or more.
Best cash flowing properties in 77006
Active
$137,000
1
bds
|
1
ba
|
600
sqft
|
built
1970
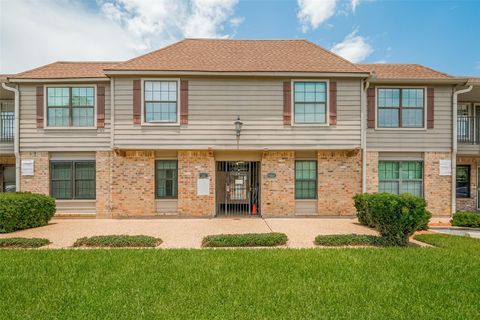
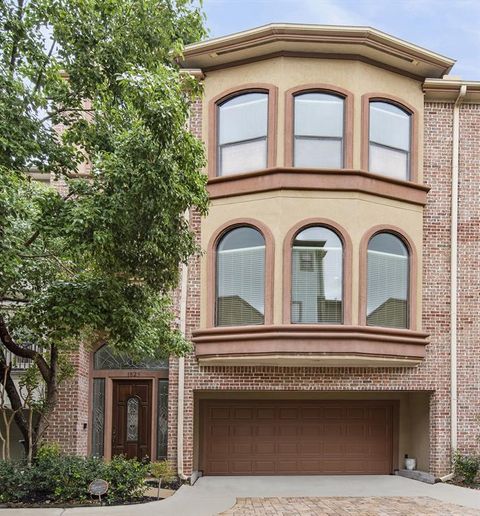
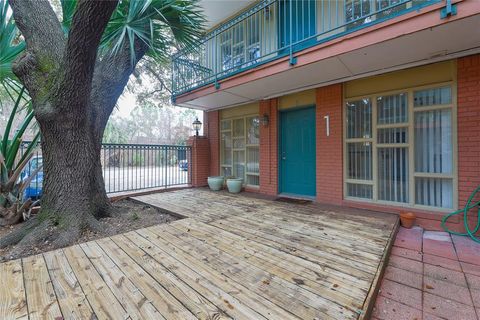
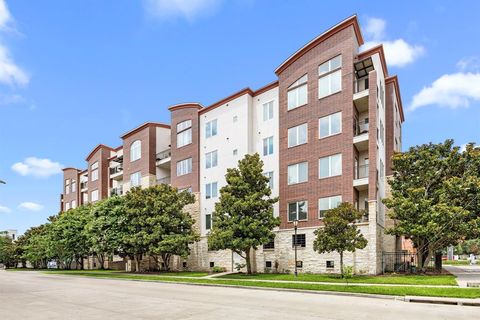
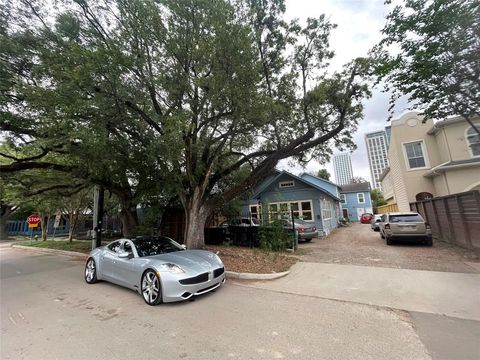
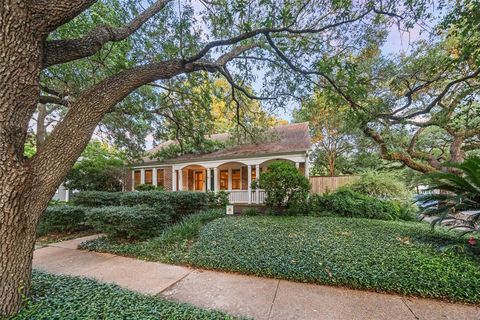
606 Marshall St, Houston, TX 77006
$-186
Cash flow
-7.1%
Cash-on-Cash Return
4.0%
Cap rate
1.0%
Rent to Value Ratio
Active
$199,000
1
bds
|
1
ba
|
646
sqft
|
built
1968
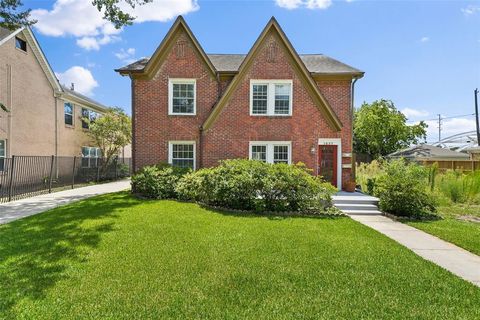
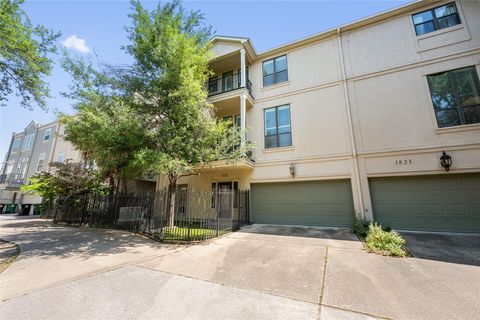
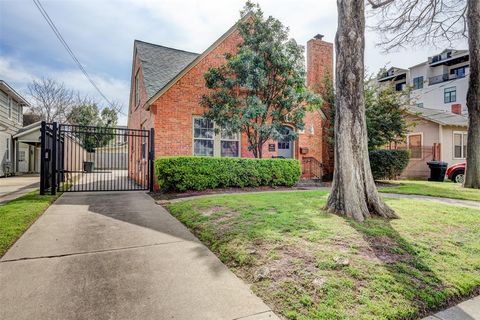
3402 Garrott St, Houston, TX 77006
$-531
Cash flow
-13.9%
Cash-on-Cash Return
2.5%
Cap rate
0.8%
Rent to Value Ratio
92 out of 112 properties for sale in 77006
Limited Results Shown
Create a free account, or log in to reveal all property listings and enjoy the complete experience.
Active
$210,000
1
bds
|
1
ba
|
768
sqft
|
built
1964
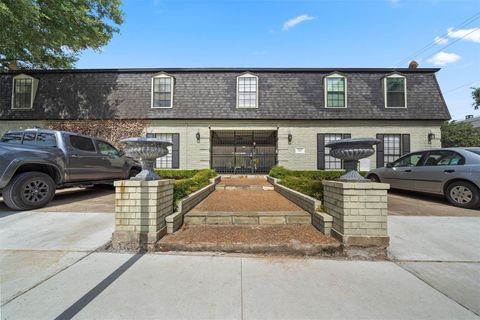
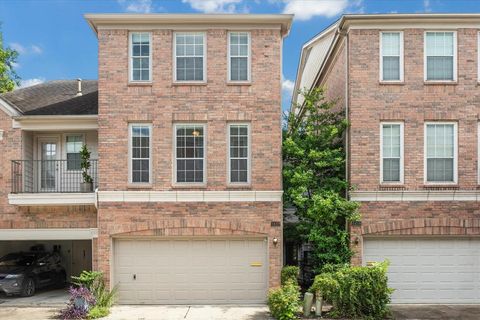
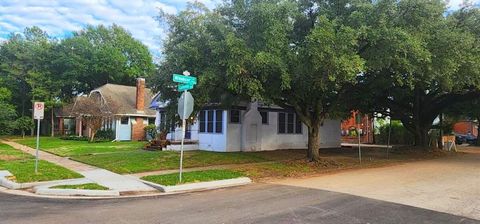
3614 Montrose Blvd, Houston, TX 77006
$-812
Cash flow
-20.2%
Cash-on-Cash Return
1.0%
Cap rate
1.0%
Rent to Value Ratio
Active
$499,000
3
bds
|
4
ba
|
2,333
sqft
|
built
2004
2616 Helena St, Houston, TX 77006
$-986
Cash flow
-10.3%
Cash-on-Cash Return
3.3%
Cap rate
0.6%
Rent to Value Ratio
Active
$555,000
3
bds
|
4
ba
|
2,712
sqft
|
built
2002
1825 Stanford St, Houston, TX 77006
$-1,092
Cash flow
-10.3%
Cash-on-Cash Return
3.3%
Cap rate
0.6%
Rent to Value Ratio
Active
$725,000
2
bds
|
2
ba
|
2,332
sqft
|
built
1939
1637 Castle Ct, Houston, TX 77006
$-2,665
Cash flow
-19.2%
Cash-on-Cash Return
1.3%
Cap rate
0.3%
Rent to Value Ratio
Active
$549,000
3
bds
|
4
ba
|
3,121
sqft
|
built
1996
4422 Castle Court Pl, Houston, TX 77006
$-880
Cash flow
-8.4%
Cash-on-Cash Return
3.8%
Cap rate
0.8%
Rent to Value Ratio
Active
$325,000
2
bds
|
2
ba
|
1,066
sqft
|
built
2004
118 Mc Gowen St, Houston, TX 77006
$-1,176
Cash flow
-18.9%
Cash-on-Cash Return
1.3%
Cap rate
0.6%
Rent to Value Ratio
Active
$2,375,000
4
bds
|
5
ba
|
4,751
sqft
|
built
2020
1507 Kipling St, Houston, TX 77006
$-7,471
Cash flow
-16.4%
Cash-on-Cash Return
1.9%
Cap rate
0.4%
Rent to Value Ratio
Active
$800,000
3
bds
|
2
ba
|
2,154
sqft
|
built
1920
1622 W Alabama St, Houston, TX 77006
$-3,021
Cash flow
-19.7%
Cash-on-Cash Return
1.1%
Cap rate
0.4%
Rent to Value Ratio
Active
$1,599,999
3
bds
|
4
ba
|
3,664
sqft
|
built
2020
1107 Berthea St, Houston, TX 77006
$-4,437
Cash flow
-14.5%
Cash-on-Cash Return
2.4%
Cap rate
0.5%
Rent to Value Ratio
Active
$1,275,000
2
bds
|
3
ba
|
2,423
sqft
|
built
1998
1634 Marshall St, Houston, TX 77006
$-4,676
Cash flow
-19.1%
Cash-on-Cash Return
1.3%
Cap rate
0.3%
Rent to Value Ratio
Active
$999,000
3
bds
|
3
ba
|
2,604
sqft
|
built
1929
1311 Peden St, Houston, TX 77006
$-2,764
Cash flow
-14.4%
Cash-on-Cash Return
2.4%
Cap rate
0.5%
Rent to Value Ratio
Active
$435,000
3
bds
|
4
ba
|
2,107
sqft
|
built
1999
1412 Harold St, Houston, TX 77006
$-786
Cash flow
-9.4%
Cash-on-Cash Return
3.5%
Cap rate
0.6%
Rent to Value Ratio
Active
$465,000
2
bds
|
2
ba
|
1,695
sqft
|
built
1975
4703 Yoakum Blvd, Houston, TX 77006
$-859
Cash flow
-9.6%
Cash-on-Cash Return
3.5%
Cap rate
0.7%
Rent to Value Ratio
Active
$487,000
3
bds
|
2
ba
|
2,588
sqft
|
built
2004
2223 Taft St, Houston, TX 77006
$-635
Cash flow
-6.8%
Cash-on-Cash Return
4.1%
Cap rate
0.7%
Rent to Value Ratio
Active
$217,000
3
bds
|
2
ba
|
1,280
sqft
|
built
1999
3502 Burlington St, Houston, TX 77006
$-844
Cash flow
-20.3%
Cash-on-Cash Return
1.0%
Cap rate
0.8%
Rent to Value Ratio
Active
$1,425,000
3
bds
|
4
ba
|
3,682
sqft
|
built
2005
3603 Audubon Pl, Houston, TX 77006
$-4,083
Cash flow
-14.9%
Cash-on-Cash Return
2.2%
Cap rate
0.4%
Rent to Value Ratio
Active
$479,000
3
bds
|
3
ba
|
2,198
sqft
|
built
2000
1819 Waugh Dr, Houston, TX 77006
$-695
Cash flow
-7.6%
Cash-on-Cash Return
3.9%
Cap rate
0.7%
Rent to Value Ratio
Active
$789,900
2
bds
|
1
ba
|
1,200
sqft
|
built
1923
1621 California St, Houston, TX 77006
$-3,547
Cash flow
-23.4%
Cash-on-Cash Return
0.3%
Cap rate
0.2%
Rent to Value Ratio
Active
$1,575,000
3
bds
|
5
ba
|
4,185
sqft
|
built
1998
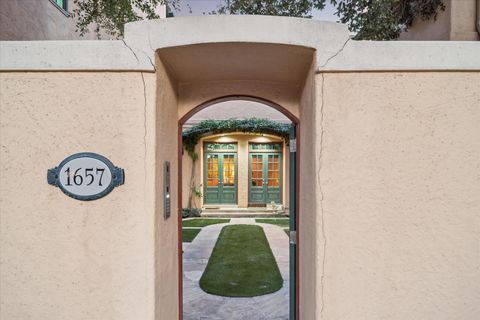
1657 Banks St, Houston, TX 77006
$-5,055
Cash flow
-16.7%
Cash-on-Cash Return
1.8%
Cap rate
0.5%
Rent to Value Ratio
Active
$545,000
3
bds
|
4
ba
|
2,280
sqft
|
built
2002
542 Bomar St, Houston, TX 77006
$-1,301
Cash flow
-12.5%
Cash-on-Cash Return
2.8%
Cap rate
0.6%
Rent to Value Ratio
Active
$675,000
3
bds
|
1
ba
|
1,204
sqft
|
built
1920
4501 Stanford St, Houston, TX 77006
$-2,042
Cash flow
-15.8%
Cash-on-Cash Return
2.0%
Cap rate
0.4%
Rent to Value Ratio
Active
$659,000
3
bds
|
4
ba
|
2,955
sqft
|
built
2021
2716 Baldwin St, Houston, TX 77006
$-632
Cash flow
-5.0%
Cash-on-Cash Return
4.5%
Cap rate
0.7%
Rent to Value Ratio
Active
$299,900
2
bds
|
2
ba
|
1,270
sqft
|
built
2005
1900 Genesee St, Houston, TX 77006
$-976
Cash flow
-17.0%
Cash-on-Cash Return
1.8%
Cap rate
0.8%
Rent to Value Ratio
Active
$399,900
3
bds
|
3
ba
|
1,592
sqft
|
built
1979
77 Chelsea Blvd, Houston, TX 77006
$-674
Cash flow
-8.8%
Cash-on-Cash Return
3.7%
Cap rate
0.8%
Rent to Value Ratio
Active
$779,000
3
bds
|
4
ba
|
2,790
sqft
|
built
2022
4504 Yupon St, Houston, TX 77006
$-1,516
Cash flow
-10.2%
Cash-on-Cash Return
3.3%
Cap rate
0.7%
Rent to Value Ratio
Active
$739,000
3
bds
|
4
ba
|
2,939
sqft
|
built
2018
1304 Castle Ct, Houston, TX 77006
$-1,774
Cash flow
-12.5%
Cash-on-Cash Return
2.8%
Cap rate
0.6%
Rent to Value Ratio
Active
$820,000
3
bds
|
4
ba
|
3,030
sqft
|
built
2007
624 Harold St, Houston, TX 77006
$-2,324
Cash flow
-14.8%
Cash-on-Cash Return
2.3%
Cap rate
0.5%
Rent to Value Ratio
Active
$1,550,000
4
bds
|
6
ba
|
4,222
sqft
|
built
2015
1116 W Drew St, Houston, TX 77006
$-4,179
Cash flow
-14.1%
Cash-on-Cash Return
2.4%
Cap rate
0.5%
Rent to Value Ratio
Active
$749,000
2
bds
|
1
ba
|
2,610
sqft
|
built
1930
528 Hawthorne St, Houston, TX 77006
$-2,164
Cash flow
-15.1%
Cash-on-Cash Return
2.2%
Cap rate
0.3%
Rent to Value Ratio
Active
$480,000
3
bds
|
3
ba
|
2,327
sqft
|
built
2000
201 Westheimer Rd, Houston, TX 77006
$-800
Cash flow
-8.7%
Cash-on-Cash Return
3.7%
Cap rate
0.7%
Rent to Value Ratio
Active
$1,350,000
2
bds
|
1
ba
|
3,694
sqft
|
built
1912
3403 Yupon St, Houston, TX 77006
$-5,635
Cash flow
-21.8%
Cash-on-Cash Return
0.7%
Cap rate
0.2%
Rent to Value Ratio
Active
$1,075,000
1
bds
|
1
ba
|
2,686
sqft
|
built
1930
1313 Peden St, Houston, TX 77006
$-5,027
Cash flow
-24.4%
Cash-on-Cash Return
0.1%
Cap rate
0.2%
Rent to Value Ratio
Active
$550,000
3
bds
|
4
ba
|
2,684
sqft
|
built
1999
1515 Hyde Park Blvd, Houston, TX 77006
$-1,127
Cash flow
-10.7%
Cash-on-Cash Return
3.2%
Cap rate
0.6%
Rent to Value Ratio
Active
$1,800,000
3
bds
|
4
ba
|
2,408
sqft
|
built
1935
816 W Main St, Houston, TX 77006
$-6,411
Cash flow
-18.6%
Cash-on-Cash Return
1.4%
Cap rate
0.3%
Rent to Value Ratio
Active
$849,000
4
bds
|
3
ba
|
1,170
sqft
|
built
1935
1621 Cherryhurst St, Houston, TX 77006
$-3,307
Cash flow
-20.3%
Cash-on-Cash Return
1.0%
Cap rate
0.3%
Rent to Value Ratio
Active
$689,900
3
bds
|
3
ba
|
3,232
sqft
|
built
2000
2516 Bagby St, Houston, TX 77006
$-1,452
Cash flow
-11.0%
Cash-on-Cash Return
3.2%
Cap rate
0.7%
Rent to Value Ratio
Active
$1,075,000
4
bds
|
6
ba
|
3,238
sqft
|
built
1910
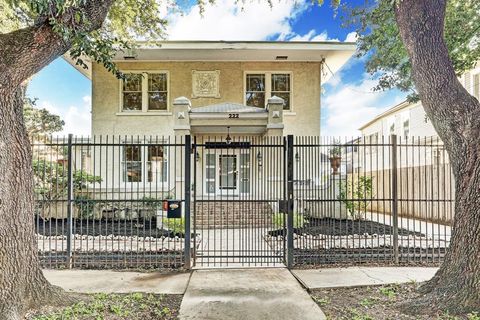
222 Marshall St, Houston, TX 77006
$-4,063
Cash flow
-19.7%
Cash-on-Cash Return
1.1%
Cap rate
0.3%
Rent to Value Ratio
Active
$265,000
1
bds
|
1
ba
|
768
sqft
|
built
1964
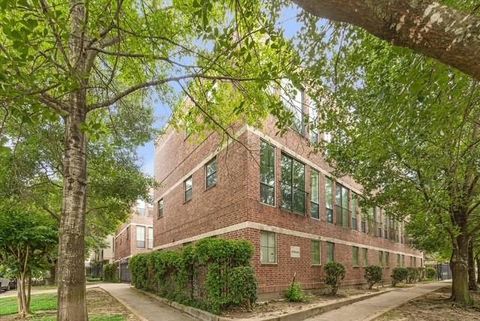
3614 Montrose Blvd, Houston, TX 77006
$-1,393
Cash flow
-27.4%
Cash-on-Cash Return
-0.6%
Cap rate
0.5%
Rent to Value Ratio