77015 Investment Properties for Sale
Browse homes for sale and investment properties in 77015. Refine your search by price, property type, or more.
Best cash flowing properties in 77015

Active
$68,990
2
bds
|
1
ba
|
786
sqft
|
built
1982
13480 S Thorntree Dr, Houston, TX 77015
$405
Cash flow
6.8%
Cash-on-Cash Return
7.0%
Cap rate
1.4%
Rent to Value Ratio
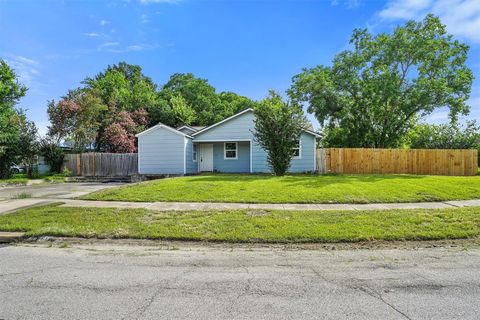
Active
$130,000
3
bds
|
2
ba
|
1,200
sqft
|
built
1948
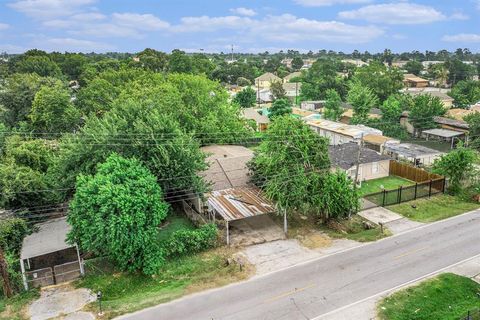
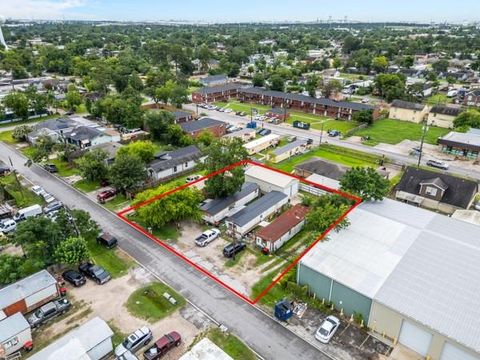
13725 Corpus Christi St, Houston, TX 77015
$198
Cash flow
7.9%
Cash-on-Cash Return
7.5%
Cap rate
1.2%
Rent to Value Ratio
48 out of 51 properties for sale in 77015
Limited Results Shown
Create a free account, or log in to reveal all property listings and enjoy the complete experience.
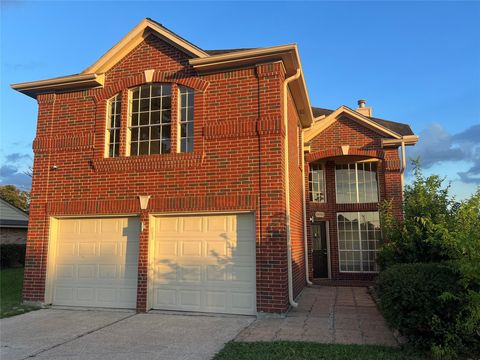
Active
$249,500
3
bds
|
2
ba
|
1,539
sqft
|
built
1979
12531 La Rochelle Dr, Houston, TX 77015
$-403
Cash flow
-8.4%
Cash-on-Cash Return
3.7%
Cap rate
0.7%
Rent to Value Ratio
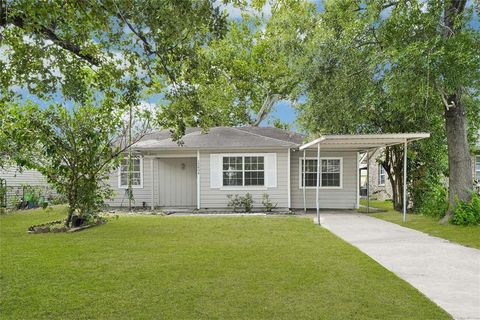
Active
$255,000
4
bds
|
2
ba
|
1,820
sqft
|
built
1950
12450 Kathryn St, Houston, TX 77015
$-480
Cash flow
-9.8%
Cash-on-Cash Return
3.4%
Cap rate
0.7%
Rent to Value Ratio

Active
$895,000
5
bds
|
4
ba
|
3,785
sqft
|
built
1993
27 Thornhill Oaks Dr, Houston, TX 77015
$-2,525
Cash flow
-14.7%
Cash-on-Cash Return
2.3%
Cap rate
0.4%
Rent to Value Ratio
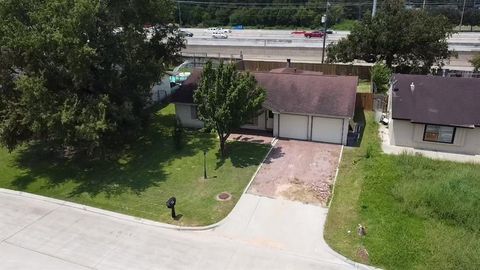
Active
$235,000
3
bds
|
2
ba
|
1,675
sqft
|
built
1976
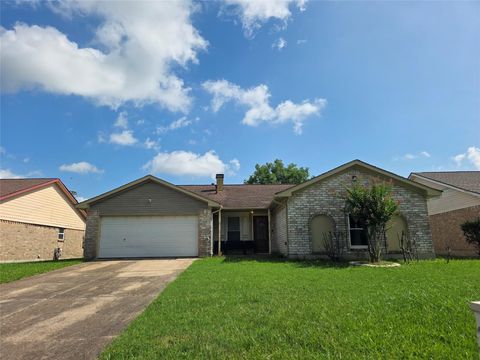
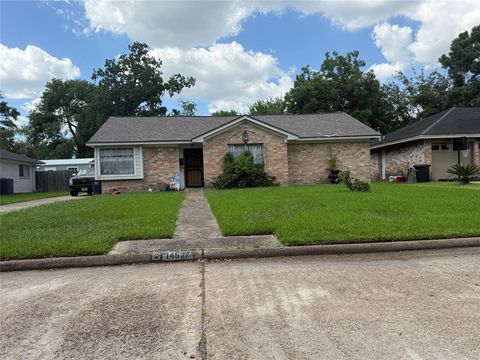
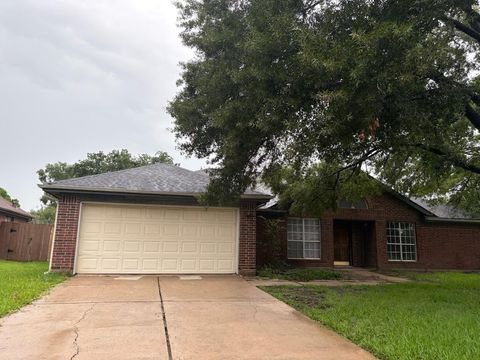
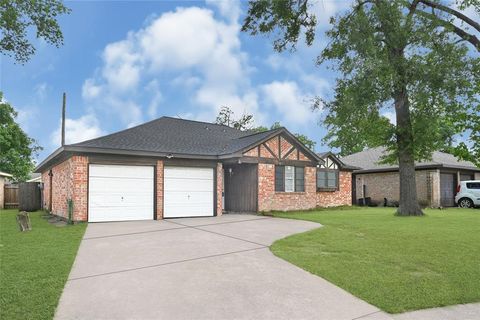
14527 Roundstone Ln, Houston, TX 77015
$-262
Cash flow
-5.8%
Cash-on-Cash Return
4.3%
Cap rate
0.8%
Rent to Value Ratio
Active
$250,000
1
bds
|
1
ba
|
2,224
sqft
|
built
1981
14149 Force St, Houston, TX 77015
$-1,310
Cash flow
-27.3%
Cash-on-Cash Return
-0.6%
Cap rate
0.3%
Rent to Value Ratio
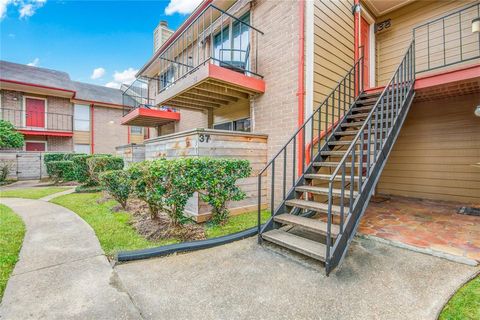
Active
$79,990
2
bds
|
2
ba
|
960
sqft
|
built
1981
13480 S Thorntree Dr, Houston, TX 77015
$150
Cash flow
9.8%
Cash-on-Cash Return
7.9%
Cap rate
1.5%
Rent to Value Ratio
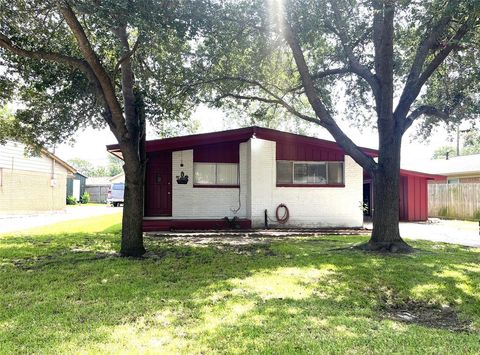
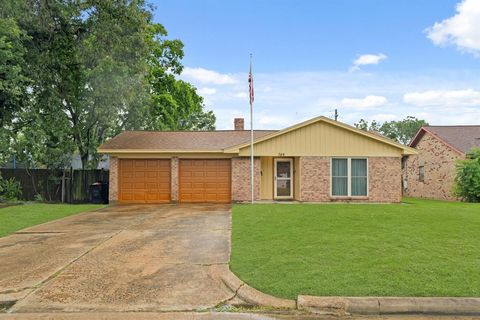
Active
$170,000
3
bds
|
2
ba
|
1,547
sqft
|
built
1960
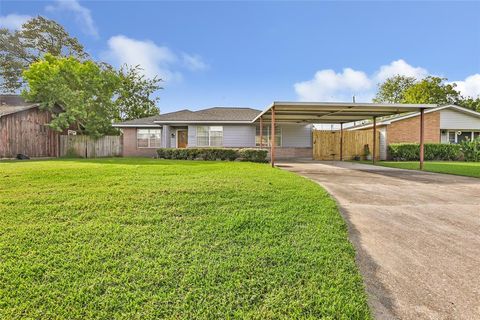
12337 Kayla Ln, Houston, TX 77015
$-67
Cash flow
-2.1%
Cash-on-Cash Return
5.2%
Cap rate
1.0%
Rent to Value Ratio
Active
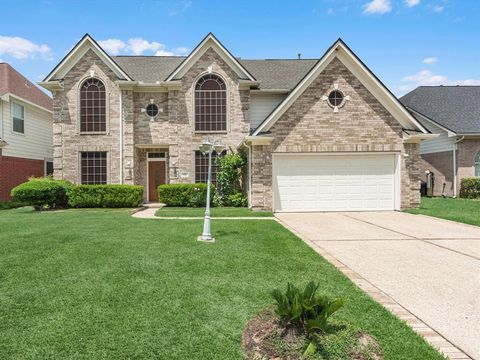
$369,000
4
bds
|
3
ba
|
2,580
sqft
|
built
1989
215 Wood Circle Ln, Houston, TX 77015
$-598
Cash flow
-8.5%
Cash-on-Cash Return
3.7%
Cap rate
0.7%
Rent to Value Ratio
Active
$329,000
4
bds
|
3
ba
|
2,314
sqft
|
built
1992
13102 Labelle Ln, Houston, TX 77015
$-545
Cash flow
-8.6%
Cash-on-Cash Return
3.7%
Cap rate
0.7%
Rent to Value Ratio
Active
$195,900
2
bds
|
1
ba
|
1,100
sqft
|
built
1950
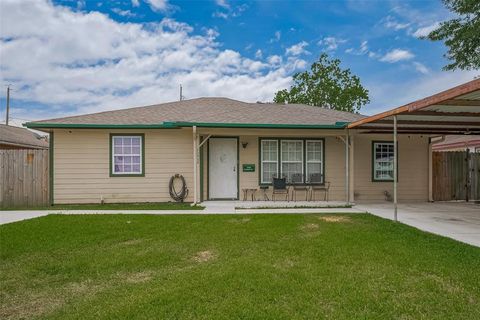
12434 Kathryn St, Houston, TX 77015
$-201
Cash flow
-5.4%
Cash-on-Cash Return
4.4%
Cap rate
0.7%
Rent to Value Ratio
Active
$210,000
3
bds
|
2
ba
|
1,438
sqft
|
built
1969
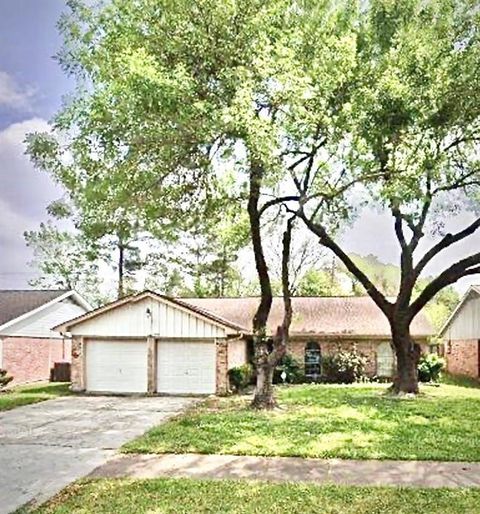
623 Rockbrook Dr, Houston, TX 77015
$-161
Cash flow
-4.0%
Cash-on-Cash Return
4.8%
Cap rate
0.9%
Rent to Value Ratio
Active
$165,000
3
bds
|
2
ba
|
1,260
sqft
|
built
1955
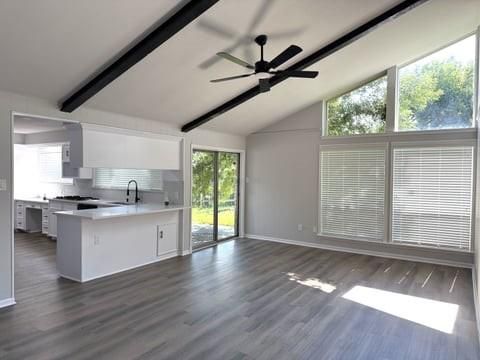
12332 Kayla Ln, Houston, TX 77015
$-34
Cash flow
-1.1%
Cash-on-Cash Return
5.4%
Cap rate
1.0%
Rent to Value Ratio
Active
$169,000
3
bds
|
1
ba
|
2,023
sqft
|
built
1955
13725 Texarkana St, Houston, TX 77015
$71
Cash flow
2.2%
Cash-on-Cash Return
6.2%
Cap rate
0.9%
Rent to Value Ratio
Active
$270,000
3
bds
|
2
ba
|
1,708
sqft
|
built
1963
13918 Bretagne Dr, Houston, TX 77015
$-399
Cash flow
-7.7%
Cash-on-Cash Return
3.9%
Cap rate
0.7%
Rent to Value Ratio
Active
$265,000
3
bds
|
2
ba
|
1,664
sqft
|
built
1979
14835 Scotter Dr, Houston, TX 77015
$-451
Cash flow
-8.9%
Cash-on-Cash Return
3.6%
Cap rate
0.7%
Rent to Value Ratio
Active
$258,900
3
bds
|
2
ba
|
1,416
sqft
|
built
1971
14506 Duncannon Dr, Houston, TX 77015
$-342
Cash flow
-6.9%
Cash-on-Cash Return
4.1%
Cap rate
0.7%
Rent to Value Ratio
Active
$79,900
1
bds
|
1
ba
|
623
sqft
|
built
1980
12955 Woodforest Blvd, Houston, TX 77015
$-191
Cash flow
-12.5%
Cash-on-Cash Return
2.8%
Cap rate
1.1%
Rent to Value Ratio
Active
$589,000
4
bds
|
4
ba
|
4,189
sqft
|
built
2001
259 W Thorn Way, Houston, TX 77015
$-588
Cash flow
-5.2%
Cash-on-Cash Return
4.5%
Cap rate
0.7%
Rent to Value Ratio
Active
$175,999
3
bds
|
2
ba
|
1,146
sqft
|
built
1980
1714 Merton Dr, Houston, TX 77015
$-22
Cash flow
-0.7%
Cash-on-Cash Return
5.5%
Cap rate
0.9%
Rent to Value Ratio
Active
$274,900
2
bds
|
1
ba
|
920
sqft
|
built
1950
639 Manor St, Houston, TX 77015
$-396
Cash flow
-7.5%
Cash-on-Cash Return
4.0%
Cap rate
0.6%
Rent to Value Ratio
Active
$349,000
4
bds
|
4
ba
|
3,033
sqft
|
built
1998
126 Oryan Ct, Houston, TX 77015
$-645
Cash flow
-9.6%
Cash-on-Cash Return
3.5%
Cap rate
0.7%
Rent to Value Ratio
Active
$205,000
3
bds
|
2
ba
|
1,407
sqft
|
built
1955
1615 Hiller St, Houston, TX 77015
$-393
Cash flow
-10.0%
Cash-on-Cash Return
3.4%
Cap rate
0.6%
Rent to Value Ratio
Active
$219,000
3
bds
|
2
ba
|
1,682
sqft
|
built
1965
746 Fawn Dr, Houston, TX 77015
$-194
Cash flow
-4.6%
Cash-on-Cash Return
4.6%
Cap rate
0.8%
Rent to Value Ratio
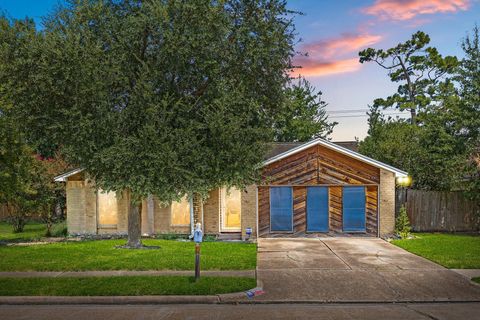
Active
$235,000
3
bds
|
2
ba
|
1,669
sqft
|
built
1980
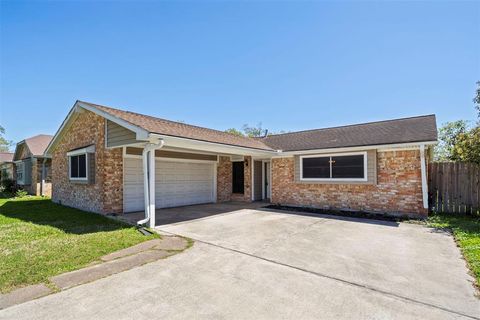
1346 Castle Glen Dr, Houston, TX 77015
$-248
Cash flow
-5.5%
Cash-on-Cash Return
4.4%
Cap rate
0.8%
Rent to Value Ratio
Active
$300,000
3
bds
|
4
ba
|
2,177
sqft
|
built
1988
14119 Falling Elm Ln, Houston, TX 77015
$-676
Cash flow
-11.8%
Cash-on-Cash Return
3.0%
Cap rate
0.7%
Rent to Value Ratio
Active
$223,000
4
bds
|
2
ba
|
1,534
sqft
|
built
1976
159 White Cedar St, Houston, TX 77015
$-265
Cash flow
-6.2%
Cash-on-Cash Return
4.3%
Cap rate
0.8%
Rent to Value Ratio
Active
$295,000
2
bds
|
1
ba
|
2,646
sqft
|
built
1980
12955 Woodforest Blvd, Houston, TX 77015
$-2,161
Cash flow
-38.2%
Cash-on-Cash Return
-3.1%
Cap rate
0.4%
Rent to Value Ratio
Active
$249,000
9
bds
|
6
ba
|
742
sqft
|
built
1979
13916 Eagle Pass St, Houston, TX 77015
$-622
Cash flow
-13.0%
Cash-on-Cash Return
2.7%
Cap rate
0.4%
Rent to Value Ratio
Active
$299,900
3
bds
|
2
ba
|
1,672
sqft
|
built
1960
515 Maple Way, Houston, TX 77015
$-710
Cash flow
-12.4%
Cash-on-Cash Return
2.8%
Cap rate
0.6%
Rent to Value Ratio
Active
$250,000
4
bds
|
2
ba
|
1,695
sqft
|
built
1977
1303 Sterling Green Ct, Houston, TX 77015
$-336
Cash flow
-7.0%
Cash-on-Cash Return
4.1%
Cap rate
0.7%
Rent to Value Ratio
Active
$379,997
2
bds
|
2
ba
|
2,080
sqft
|
built
1984
816 Barbara Mae St, Houston, TX 77015
$-752
Cash flow
-10.3%
Cash-on-Cash Return
3.3%
Cap rate
0.5%
Rent to Value Ratio

Active
$215,000
5
bds
|
2
ba
|
1,465
sqft
|
built
1952
12474 Birdie Ln, Houston, TX 77015
$87
Cash flow
2.1%
Cash-on-Cash Return
6.2%
Cap rate
0.7%
Rent to Value Ratio
Active
$549,000
6
bds
|
3
ba
|
2,815
sqft
|
built
2024
13505 Orleans St, Houston, TX 77015
$-2,411
Cash flow
-22.9%
Cash-on-Cash Return
0.4%
Cap rate
0.2%
Rent to Value Ratio
Active
$191,000
3
bds
|
2
ba
|
1,650
sqft
|
built
1976
13811 Crosshaven Dr, Houston, TX 77015
$-47
Cash flow
-1.3%
Cash-on-Cash Return
5.4%
Cap rate
0.9%
Rent to Value Ratio
Active
$199,999
3
bds
|
2
ba
|
1,420
sqft
|
built
1957
12322 Kitty Ln, Houston, TX 77015
$-188
Cash flow
-4.9%
Cash-on-Cash Return
4.5%
Cap rate
0.8%
Rent to Value Ratio
Active
$195,000
4
bds
|
3
ba
|
1,764
sqft
|
built
1970
335 Haymarket Ln, Houston, TX 77015
$-51
Cash flow
-1.4%
Cash-on-Cash Return
5.4%
Cap rate
0.9%
Rent to Value Ratio
Active
$259,900
3
bds
|
2
ba
|
1,736
sqft
|
built
1975
167 White Cedar St, Houston, TX 77015
$-430
Cash flow
-8.6%
Cash-on-Cash Return
3.7%
Cap rate
0.7%
Rent to Value Ratio
Active
$79,990
2
bds
|
2
ba
|
960
sqft
|
built
1982
13480 S Thorntree Dr, Houston, TX 77015
$12
Cash flow
0.8%
Cash-on-Cash Return
5.9%
Cap rate
1.3%
Rent to Value Ratio