77016 Investment Properties for Sale
Browse homes for sale and investment properties in 77016. Refine your search by price, property type, or more.
Best cash flowing properties in 77016
Active
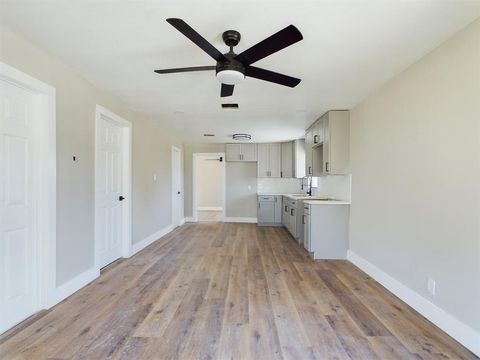
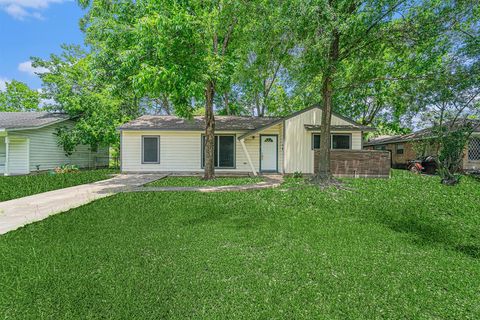
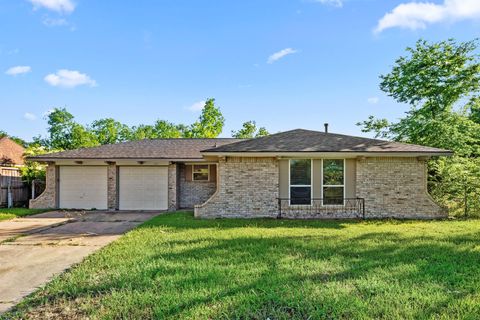
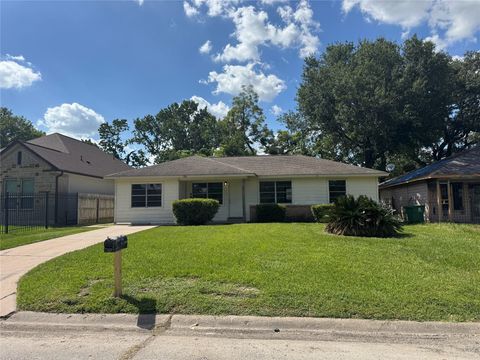
$184,995
3
bds
|
2
ba
|
1,660
sqft
|
built
1940
7609 Shotwell St, Houston, TX 77016
$488
Cash flow
13.8%
Cash-on-Cash Return
8.8%
Cap rate
1.2%
Rent to Value Ratio
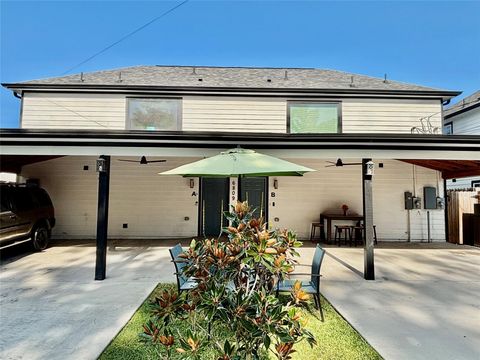
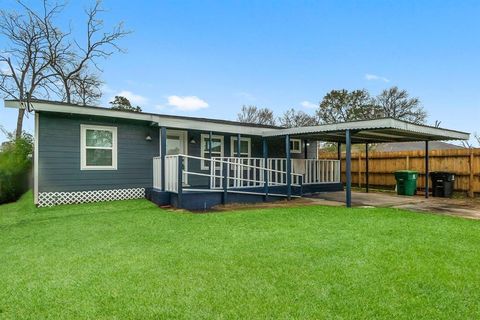
Active
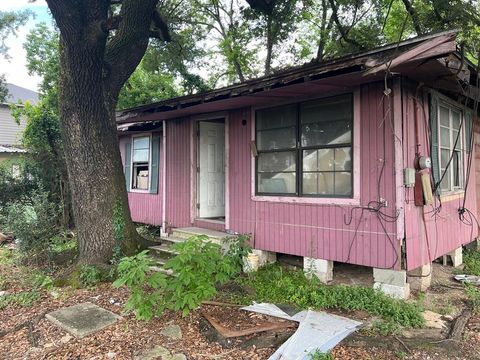
$85,000
3
bds
|
1
ba
|
866
sqft
|
built
1950
4814 Firnat St, Houston, TX 77016
$408
Cash flow
25.0%
Cash-on-Cash Return
11.4%
Cap rate
1.6%
Rent to Value Ratio
66 out of 71 properties for sale in 77016
Limited Results Shown
Create a free account, or log in to reveal all property listings and enjoy the complete experience.
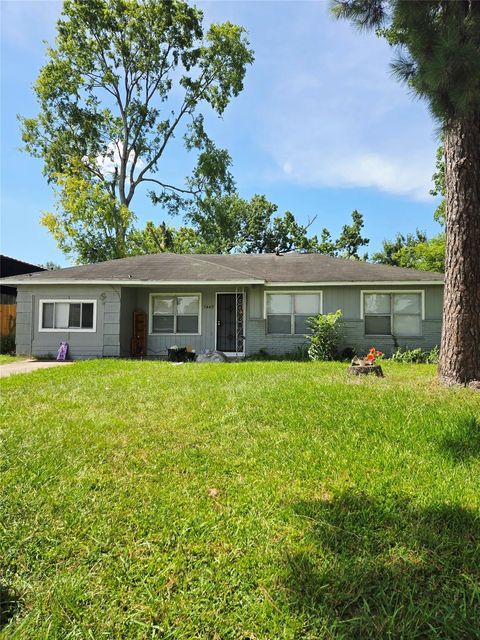
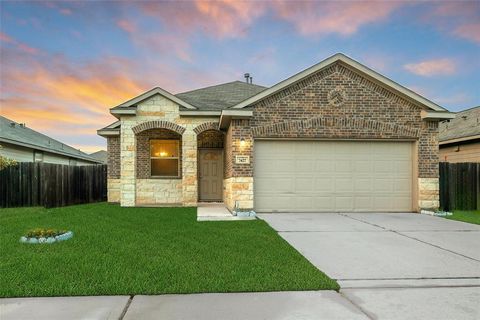
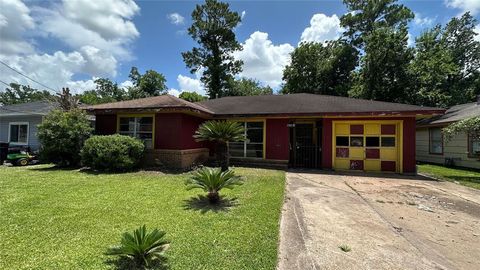
Active
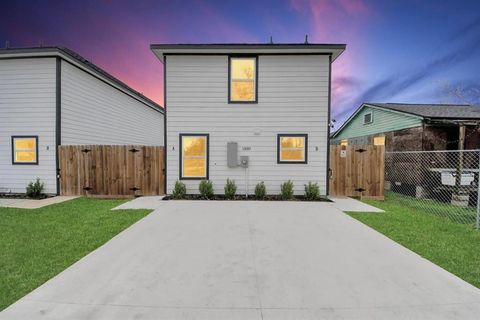
$415,000
3
bds
|
3
ba
|
2,360
sqft
|
built
2023
11610 Danford Ln, Houston, TX 77016
$-1,579
Cash flow
-19.9%
Cash-on-Cash Return
1.1%
Cap rate
0.4%
Rent to Value Ratio
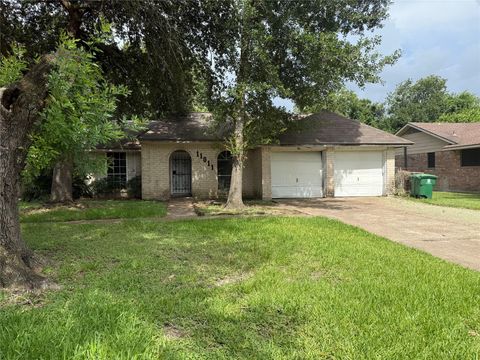
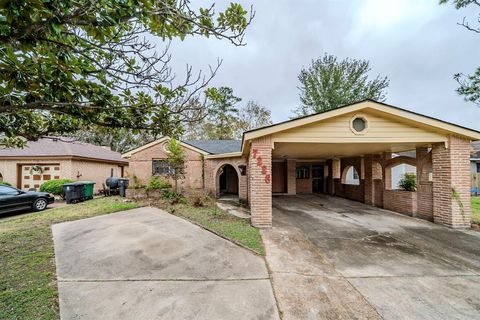
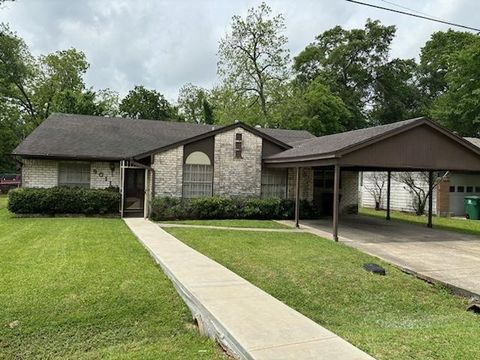
Active
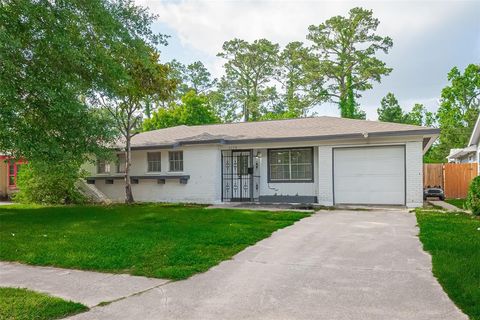
$220,000
3
bds
|
2
ba
|
1,022
sqft
|
built
1966
6134 Guadalupe St, Houston, TX 77016
$-225
Cash flow
-5.3%
Cash-on-Cash Return
4.5%
Cap rate
0.7%
Rent to Value Ratio
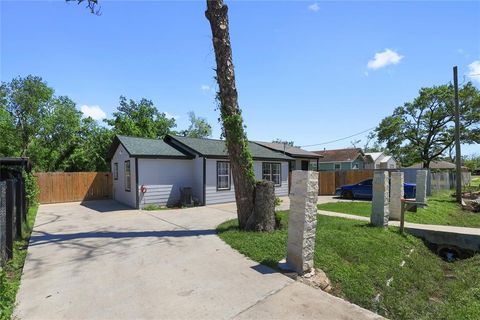
Active
$134,900
3
bds
|
1
ba
|
1,148
sqft
|
built
1960
7433 Yoe St, Houston, TX 77016
$43
Cash flow
1.7%
Cash-on-Cash Return
6.1%
Cap rate
1.0%
Rent to Value Ratio
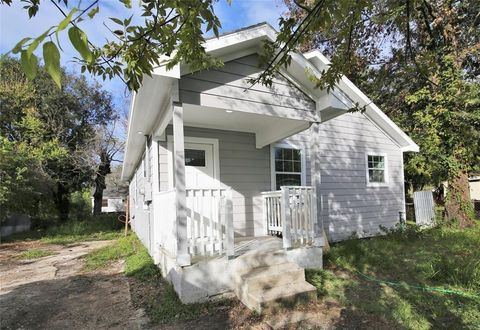
Active
$395,000
6
bds
|
4
ba
|
2,058
sqft
|
built
2021
6809 Glass St, Houston, TX 77016
$-1,436
Cash flow
-19.0%
Cash-on-Cash Return
1.3%
Cap rate
0.4%
Rent to Value Ratio
Active
$140,000
4
bds
|
2
ba
|
1,252
sqft
|
built
1950
7445 Cabot St, Houston, TX 77016
$164
Cash flow
6.1%
Cash-on-Cash Return
7.1%
Cap rate
1.1%
Rent to Value Ratio
Active
$150,000
3
bds
|
2
ba
|
1,092
sqft
|
built
1974
11011 Burningbush Ln, Houston, TX 77016
$104
Cash flow
3.6%
Cash-on-Cash Return
6.5%
Cap rate
1.1%
Rent to Value Ratio
Active
$360,000
3
bds
|
2
ba
|
1,845
sqft
|
built
1953
10120 Homestead Rd, Houston, TX 77016
$-1,314
Cash flow
-19.0%
Cash-on-Cash Return
1.3%
Cap rate
0.3%
Rent to Value Ratio
Active
$249,900
3
bds
|
2
ba
|
1,217
sqft
|
built
2023
7826 Flowering Lotus Ln, Houston, TX 77016
$-370
Cash flow
-7.7%
Cash-on-Cash Return
3.9%
Cap rate
0.8%
Rent to Value Ratio
Active
$105,000
3
bds
|
1
ba
|
812
sqft
|
built
1952
5020 Fitch St, Houston, TX 77016
$117
Cash flow
5.8%
Cash-on-Cash Return
7.0%
Cap rate
1.0%
Rent to Value Ratio
Active
$255,000
3
bds
|
2
ba
|
1,444
sqft
|
built
2020
7615 Nevaeh Crest Path, Houston, TX 77016
$-385
Cash flow
-7.9%
Cash-on-Cash Return
3.9%
Cap rate
0.7%
Rent to Value Ratio
Active
$159,000
3
bds
|
1
ba
|
1,107
sqft
|
built
1955
10317 Kelburn Dr, Houston, TX 77016
$127
Cash flow
4.2%
Cash-on-Cash Return
6.6%
Cap rate
1.1%
Rent to Value Ratio
Active
$189,900
3
bds
|
2
ba
|
1,289
sqft
|
built
1955
10415 Rockaway Dr, Houston, TX 77016
$-82
Cash flow
-2.3%
Cash-on-Cash Return
5.2%
Cap rate
0.7%
Rent to Value Ratio
Active
$150,000
3
bds
|
2
ba
|
1,458
sqft
|
built
1970
6702 Leedale St, Houston, TX 77016
$237
Cash flow
8.2%
Cash-on-Cash Return
7.6%
Cap rate
1.2%
Rent to Value Ratio
Active
$110,000
3
bds
|
1
ba
|
936
sqft
|
built
1964
6534 Mohawk St, Houston, TX 77016
$156
Cash flow
7.4%
Cash-on-Cash Return
7.4%
Cap rate
1.2%
Rent to Value Ratio
Active
$135,000
3
bds
|
1
ba
|
952
sqft
|
built
1965
6210 Annunciation St, Houston, TX 77016
$50
Cash flow
1.9%
Cash-on-Cash Return
6.1%
Cap rate
1.0%
Rent to Value Ratio
Active
$480,000
2
bds
|
1
ba
|
1,112
sqft
|
built
1969
5914 Breland St, Houston, TX 77016
$-1,382
Cash flow
-15.0%
Cash-on-Cash Return
2.2%
Cap rate
0.3%
Rent to Value Ratio
Active
$245,999
3
bds
|
2
ba
|
2,443
sqft
|
built
1960
7717 Bigwood St, Houston, TX 77016
$-170
Cash flow
-3.6%
Cash-on-Cash Return
4.8%
Cap rate
0.8%
Rent to Value Ratio
Active
$219,500
3
bds
|
1
ba
|
925
sqft
|
built
1953
10128 Homestead Rd, Houston, TX 77016
$-112
Cash flow
-2.7%
Cash-on-Cash Return
5.1%
Cap rate
0.7%
Rent to Value Ratio
Active
$229,990
3
bds
|
2
ba
|
1,499
sqft
|
built
2018
7427 Wheatley Gardens Dr, Houston, TX 77016
$-294
Cash flow
-6.7%
Cash-on-Cash Return
4.1%
Cap rate
0.8%
Rent to Value Ratio
Active
$205,000
4
bds
|
2
ba
|
2,100
sqft
|
built
1955
7226 Gore Dr, Houston, TX 77016
$-76
Cash flow
-1.9%
Cash-on-Cash Return
5.2%
Cap rate
0.9%
Rent to Value Ratio
Active
$248,000
4
bds
|
3
ba
|
1,450
sqft
|
built
1948
7508 Glass St, Houston, TX 77016
$-754
Cash flow
-15.9%
Cash-on-Cash Return
2.0%
Cap rate
0.4%
Rent to Value Ratio
Active
$255,000
2
bds
|
2
ba
|
1,800
sqft
|
built
1960
5109 Earline St, Houston, TX 77016
$-741
Cash flow
-15.2%
Cash-on-Cash Return
2.2%
Cap rate
0.4%
Rent to Value Ratio
Active
$219,900
3
bds
|
2
ba
|
1,255
sqft
|
built
1970
6611 Mohawk St, Houston, TX 77016
$109
Cash flow
2.6%
Cash-on-Cash Return
6.3%
Cap rate
0.9%
Rent to Value Ratio

Active
$165,000
2
bds
|
1
ba
|
842
sqft
|
built
1970
11014 Vailview Dr, Houston, TX 77016
$-108
Cash flow
-3.4%
Cash-on-Cash Return
4.9%
Cap rate
0.8%
Rent to Value Ratio
Active
$240,000
4
bds
|
2
ba
|
1,312
sqft
|
built
1950
4622 Firnat St, Houston, TX 77016
$48
Cash flow
1.0%
Cash-on-Cash Return
5.9%
Cap rate
0.8%
Rent to Value Ratio
Active
$109,000
3
bds
|
1
ba
|
1,013
sqft
|
built
1950
7218 Bretshire Dr, Houston, TX 77016
$302
Cash flow
14.5%
Cash-on-Cash Return
9.0%
Cap rate
1.4%
Rent to Value Ratio
Active
$200,000
3
bds
|
2
ba
|
2,156
sqft
|
built
1955
9011 Allwood St, Houston, TX 77016
$-6
Cash flow
-0.2%
Cash-on-Cash Return
5.6%
Cap rate
0.9%
Rent to Value Ratio
Active
$179,900
3
bds
|
2
ba
|
1,688
sqft
|
built
1967
7613 Parker Rd, Houston, TX 77016
$-10
Cash flow
-0.3%
Cash-on-Cash Return
5.6%
Cap rate
0.9%
Rent to Value Ratio
Active
$184,837
3
bds
|
1
ba
|
1,545
sqft
|
built
1953
7210 Colton St, Houston, TX 77016
$9
Cash flow
0.3%
Cash-on-Cash Return
5.7%
Cap rate
0.9%
Rent to Value Ratio
Active
$169,689
2
bds
|
1
ba
|
816
sqft
|
built
1950
7314 Sterlingshire St, Houston, TX 77016
$-80
Cash flow
-2.5%
Cash-on-Cash Return
5.1%
Cap rate
0.8%
Rent to Value Ratio
Active
$170,000
3
bds
|
2
ba
|
1,415
sqft
|
built
1964
6206 Antha St, Houston, TX 77016
$13
Cash flow
0.4%
Cash-on-Cash Return
5.8%
Cap rate
0.9%
Rent to Value Ratio
Active
$155,000
3
bds
|
1
ba
|
1,282
sqft
|
built
1960
7305 Yoe St, Houston, TX 77016
$-26
Cash flow
-0.9%
Cash-on-Cash Return
5.5%
Cap rate
1.0%
Rent to Value Ratio
Active
$435,000
5
bds
|
3
ba
|
3,600
sqft
|
built
1971
10606 Bucknell Rd, Houston, TX 77016
$-1,417
Cash flow
-17.0%
Cash-on-Cash Return
1.8%
Cap rate
0.4%
Rent to Value Ratio
Active
$149,900
3
bds
|
1
ba
|
1,155
sqft
|
built
1960
6330 Annunciation St, Houston, TX 77016
$278
Cash flow
9.7%
Cash-on-Cash Return
7.9%
Cap rate
1.1%
Rent to Value Ratio
Active
$280,000
3
bds
|
3
ba
|
1,627
sqft
|
built
2023
6320 Laura Koppe Rd, Houston, TX 77016
$-239
Cash flow
-4.5%
Cash-on-Cash Return
4.7%
Cap rate
0.8%
Rent to Value Ratio
Active
$112,000
3
bds
|
0
ba
|
1,092
sqft
|
built
1948
8716 Allwood St, Houston, TX 77016
$67
Cash flow
3.1%
Cash-on-Cash Return
6.4%
Cap rate
1.0%
Rent to Value Ratio
Active
$195,000
3
bds
|
2
ba
|
1,046
sqft
|
built
1966
6038 Guadalupe St, Houston, TX 77016
$-188
Cash flow
-5.0%
Cash-on-Cash Return
4.5%
Cap rate
0.8%
Rent to Value Ratio
Active
$170,000
3
bds
|
1
ba
|
1,300
sqft
|
built
1955
7421 Parker Rd, Houston, TX 77016
$-57
Cash flow
-1.7%
Cash-on-Cash Return
5.3%
Cap rate
0.9%
Rent to Value Ratio