77018 Investment Properties for Sale
Browse homes for sale and investment properties in 77018. Refine your search by price, property type, or more.
Best cash flowing properties in 77018
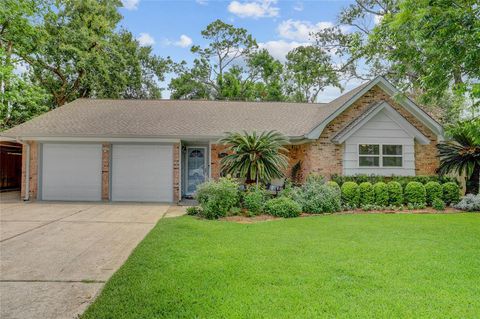
Active
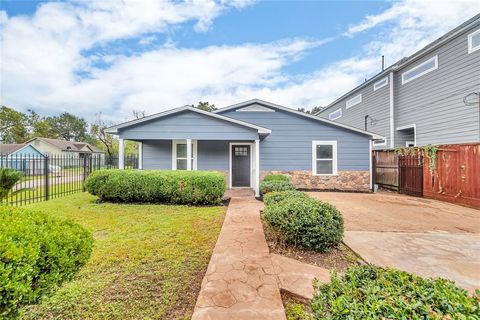
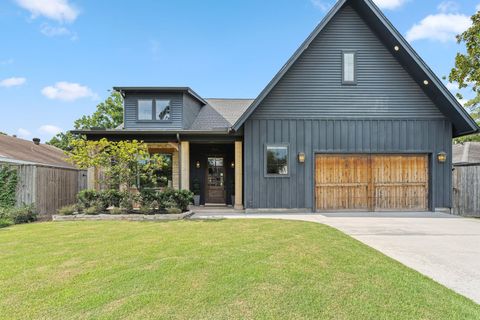
$363,900
3
bds
|
2
ba
|
1,584
sqft
|
built
2004
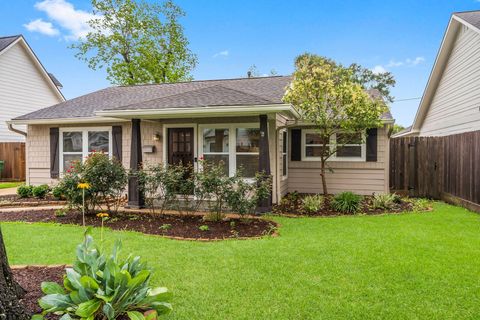
401 Fenn St, Houston, TX 77018
$-219
Cash flow
-3.1%
Cash-on-Cash Return
5.0%
Cap rate
0.8%
Rent to Value Ratio
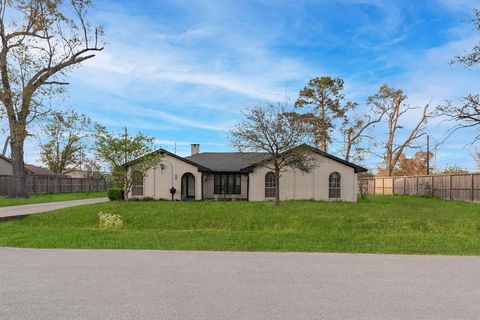
Active
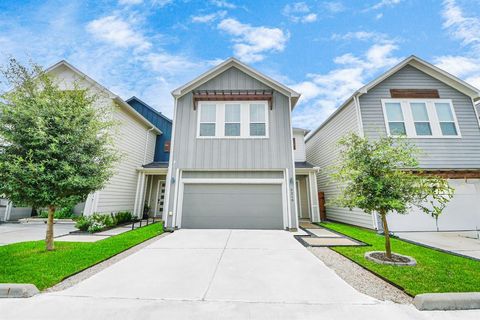
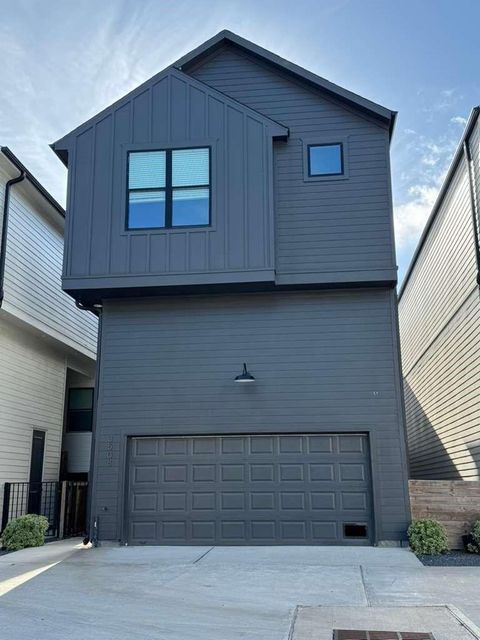
$349,500
3
bds
|
4
ba
|
1,672
sqft
|
built
2021
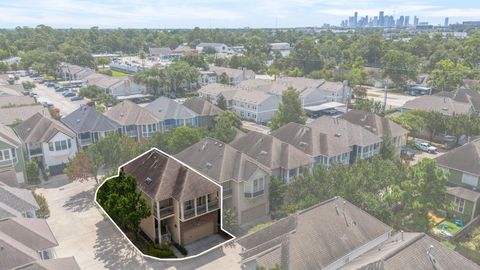
5210 Pinemont Creek Ln, Houston, TX 77018
$-236
Cash flow
-3.5%
Cash-on-Cash Return
4.9%
Cap rate
0.7%
Rent to Value Ratio
76 out of 86 properties for sale in 77018
Limited Results Shown
Create a free account, or log in to reveal all property listings and enjoy the complete experience.
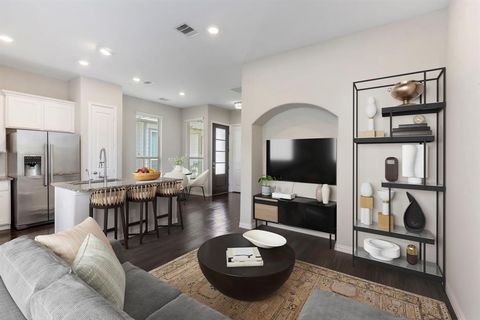
Active
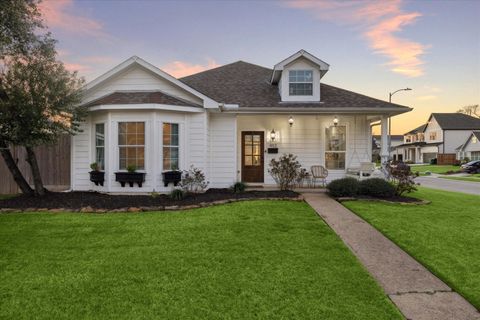
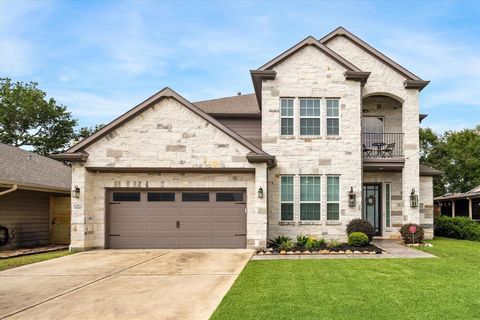
$524,000
3
bds
|
2
ba
|
1,607
sqft
|
built
2019
4113 Ella Blvd, Houston, TX 77018
$-962
Cash flow
-9.6%
Cash-on-Cash Return
3.5%
Cap rate
0.4%
Rent to Value Ratio
Active
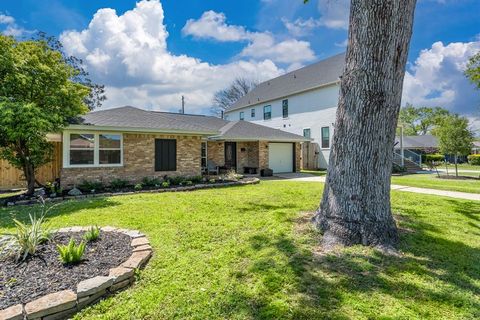
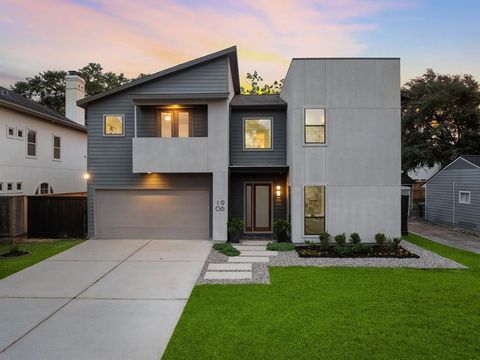
$630,000
3
bds
|
2
ba
|
2,000
sqft
|
built
1952
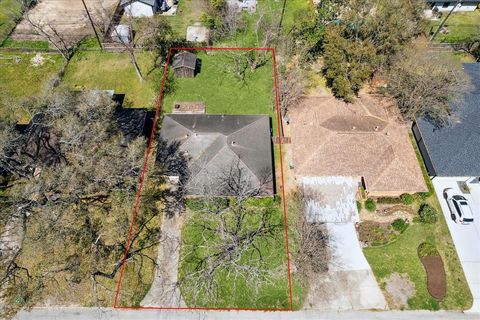
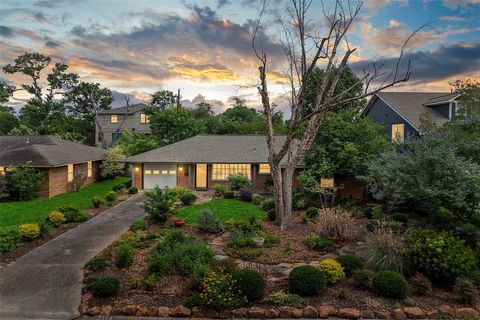
2007 Lamonte Ln, Houston, TX 77018
$-1,936
Cash flow
-16.0%
Cash-on-Cash Return
2.0%
Cap rate
0.4%
Rent to Value Ratio

Active
$990,000
4
bds
|
4
ba
|
4,132
sqft
|
built
2008
979 W 43rd St, Houston, TX 77018
$-2,479
Cash flow
-13.1%
Cash-on-Cash Return
2.7%
Cap rate
0.6%
Rent to Value Ratio
Active
$1,175,000
3
bds
|
4
ba
|
2,978
sqft
|
built
2019
1606 Althea Dr, Houston, TX 77018
$-4,363
Cash flow
-19.4%
Cash-on-Cash Return
1.2%
Cap rate
0.4%
Rent to Value Ratio

Active
$449,990
3
bds
|
2
ba
|
1,425
sqft
|
built
1967
1041 Gardendale Dr, Houston, TX 77018
$-884
Cash flow
-10.2%
Cash-on-Cash Return
3.3%
Cap rate
0.6%
Rent to Value Ratio
Active
$349,900
3
bds
|
3
ba
|
1,683
sqft
|
built
2022
3508 Oak Forest Grove Dr, Houston, TX 77018
$-511
Cash flow
-7.6%
Cash-on-Cash Return
3.9%
Cap rate
0.7%
Rent to Value Ratio
Active
$1,225,000
5
bds
|
4
ba
|
4,281
sqft
|
built
2019
1120 Wakefield Dr, Houston, TX 77018
$-2,978
Cash flow
-12.7%
Cash-on-Cash Return
2.8%
Cap rate
0.6%
Rent to Value Ratio
Active
$1,150,000
4
bds
|
4
ba
|
3,892
sqft
|
built
2015
1906 Ebony Ln, Houston, TX 77018
$-2,478
Cash flow
-11.2%
Cash-on-Cash Return
3.1%
Cap rate
0.6%
Rent to Value Ratio

Active
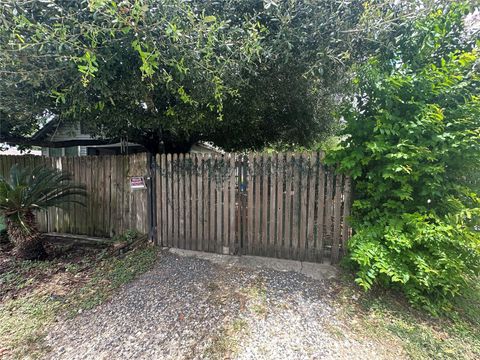
$239,500
3
bds
|
1
ba
|
886
sqft
|
built
1950
209 Hyta St, Houston, TX 77018
$-373
Cash flow
-8.1%
Cash-on-Cash Return
3.8%
Cap rate
0.7%
Rent to Value Ratio

Active
$775,000
3
bds
|
3
ba
|
2,157
sqft
|
built
1954
1547 Hewitt Dr, Houston, TX 77018
$-2,700
Cash flow
-18.2%
Cash-on-Cash Return
1.5%
Cap rate
0.4%
Rent to Value Ratio

Active
$370,000
3
bds
|
1
ba
|
1,254
sqft
|
built
1955
2330 Saxon Dr, Houston, TX 77018
$-1,008
Cash flow
-14.2%
Cash-on-Cash Return
2.4%
Cap rate
0.5%
Rent to Value Ratio
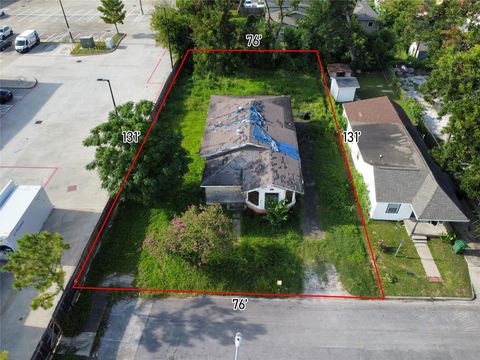
Active
$400,000
3
bds
|
1
ba
|
1,110
sqft
|
built
1954
2218 Libbey Dr, Houston, TX 77018
$-946
Cash flow
-12.3%
Cash-on-Cash Return
2.8%
Cap rate
0.6%
Rent to Value Ratio
Active
$629,600
3
bds
|
2
ba
|
2,046
sqft
|
built
1950
1733 Ebony Ln, Houston, TX 77018
$-564
Cash flow
-4.7%
Cash-on-Cash Return
4.6%
Cap rate
0.6%
Rent to Value Ratio
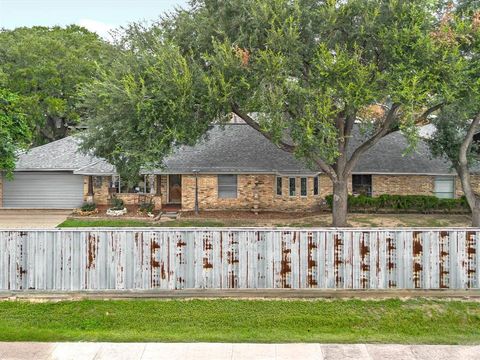
Active
$479,000
3
bds
|
2
ba
|
1,980
sqft
|
built
1961
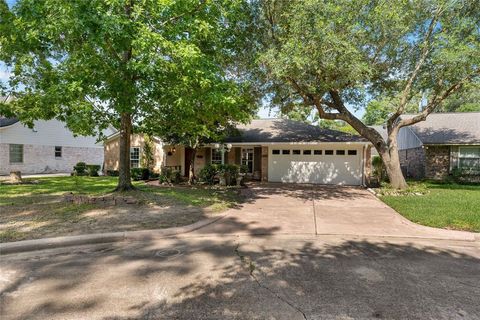
4415 Fallbrook Dr, Houston, TX 77018
$-988
Cash flow
-10.8%
Cash-on-Cash Return
3.2%
Cap rate
0.6%
Rent to Value Ratio
Active
$435,000
3
bds
|
3
ba
|
1,970
sqft
|
built
2004
3414 Garden Crest Ln, Houston, TX 77018
$-1,244
Cash flow
-14.9%
Cash-on-Cash Return
2.2%
Cap rate
0.6%
Rent to Value Ratio
Active
$474,900
3
bds
|
1
ba
|
1,105
sqft
|
built
1953
2114 Saxon Dr, Houston, TX 77018
$-1,353
Cash flow
-14.9%
Cash-on-Cash Return
2.3%
Cap rate
0.5%
Rent to Value Ratio
Active
$599,999
3
bds
|
2
ba
|
2,169
sqft
|
built
1973
1238 Del Norte St, Houston, TX 77018
$-1,864
Cash flow
-16.2%
Cash-on-Cash Return
2.0%
Cap rate
0.5%
Rent to Value Ratio
Active
$579,000
3
bds
|
2
ba
|
1,967
sqft
|
built
1955
1410 Del Norte St, Houston, TX 77018
$-1,409
Cash flow
-12.7%
Cash-on-Cash Return
2.8%
Cap rate
0.6%
Rent to Value Ratio
Active
$379,900
3
bds
|
3
ba
|
1,496
sqft
|
built
2018
5021 Lehman Oaks Dr, Houston, TX 77018
$-822
Cash flow
-11.3%
Cash-on-Cash Return
3.1%
Cap rate
0.7%
Rent to Value Ratio
Active
$319,000
3
bds
|
4
ba
|
1,966
sqft
|
built
2019
4809 Martin Oaks Ln, Houston, TX 77018
$-461
Cash flow
-7.5%
Cash-on-Cash Return
3.9%
Cap rate
0.8%
Rent to Value Ratio
Active
$550,000
3
bds
|
2
ba
|
1,726
sqft
|
built
1950
1720 Libbey Dr, Houston, TX 77018
$-1,799
Cash flow
-17.1%
Cash-on-Cash Return
1.8%
Cap rate
0.4%
Rent to Value Ratio

Active
$1,299,900
4
bds
|
4
ba
|
4,065
sqft
|
built
2011
1226 Chippendale Rd, Houston, TX 77018
$-4,320
Cash flow
-17.3%
Cash-on-Cash Return
1.7%
Cap rate
0.4%
Rent to Value Ratio

Active
$500,000
2
bds
|
1
ba
|
1,206
sqft
|
built
1955
711 Sleepyvale Ln, Houston, TX 77018
$-1,557
Cash flow
-16.2%
Cash-on-Cash Return
1.9%
Cap rate
0.5%
Rent to Value Ratio

Active
$850,000
3
bds
|
3
ba
|
1,822
sqft
|
built
1940
814 W 41st St, Houston, TX 77018
$-2,755
Cash flow
-16.9%
Cash-on-Cash Return
1.8%
Cap rate
0.5%
Rent to Value Ratio

Active
$460,000
3
bds
|
4
ba
|
1,773
sqft
|
built
2022
3505 Golf Dr, Houston, TX 77018
$-776
Cash flow
-8.8%
Cash-on-Cash Return
3.7%
Cap rate
0.7%
Rent to Value Ratio
Active
$1,395,000
5
bds
|
5
ba
|
4,545
sqft
|
built
2014
1418 Du Barry Ln, Houston, TX 77018
$-4,880
Cash flow
-18.3%
Cash-on-Cash Return
1.5%
Cap rate
0.4%
Rent to Value Ratio
Active
$460,000
3
bds
|
2
ba
|
1,300
sqft
|
built
1946
1007 W 43rd St, Houston, TX 77018
$-1,142
Cash flow
-13.0%
Cash-on-Cash Return
2.7%
Cap rate
0.5%
Rent to Value Ratio
Active
$260,000
3
bds
|
1
ba
|
1,267
sqft
|
built
1930
315 E 37th St, Houston, TX 77018
$-373
Cash flow
-7.5%
Cash-on-Cash Return
4.0%
Cap rate
0.6%
Rent to Value Ratio
Active
$450,000
2
bds
|
1
ba
|
1,366
sqft
|
built
1935
201 E 30th St, Houston, TX 77018
$-907
Cash flow
-10.5%
Cash-on-Cash Return
3.3%
Cap rate
0.6%
Rent to Value Ratio

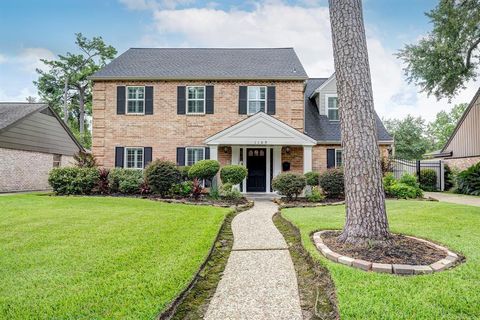
Active
$629,900
3
bds
|
3
ba
|
2,551
sqft
|
built
2004
3809 Brinkman St, Houston, TX 77018
$-1,550
Cash flow
-12.8%
Cash-on-Cash Return
2.7%
Cap rate
0.5%
Rent to Value Ratio

Active
$1,025,000
4
bds
|
4
ba
|
2,715
sqft
|
built
2014
1835 Cheshire Ln, Houston, TX 77018
$-3,331
Cash flow
-17.0%
Cash-on-Cash Return
1.8%
Cap rate
0.4%
Rent to Value Ratio

Active
$1,295,000
5
bds
|
5
ba
|
3,332
sqft
|
built
2016
922 Wakefield Dr, Houston, TX 77018
$-4,984
Cash flow
-20.1%
Cash-on-Cash Return
1.1%
Cap rate
0.4%
Rent to Value Ratio
Active
$1,300,000
4
bds
|
3
ba
|
4,337
sqft
|
built
1959
810 Martin St, Houston, TX 77018
$-4,137
Cash flow
-16.6%
Cash-on-Cash Return
1.9%
Cap rate
0.4%
Rent to Value Ratio
Active
$795,000
3
bds
|
3
ba
|
2,572
sqft
|
built
1968
1109 Cheshire Ln, Houston, TX 77018
$-2,108
Cash flow
-13.8%
Cash-on-Cash Return
2.5%
Cap rate
0.5%
Rent to Value Ratio
Active
$1,299,000
3
bds
|
3
ba
|
3,732
sqft
|
built
2008
959 W 42nd St, Houston, TX 77018
$-5,302
Cash flow
-21.3%
Cash-on-Cash Return
0.8%
Cap rate
0.2%
Rent to Value Ratio

Active
$1,390,000
4
bds
|
4
ba
|
3,850
sqft
|
built
2018
1906 Althea Dr, Houston, TX 77018
$-4,858
Cash flow
-18.2%
Cash-on-Cash Return
1.5%
Cap rate
0.4%
Rent to Value Ratio

Active
$435,000
4
bds
|
2
ba
|
2,291
sqft
|
built
1965
2407 Del Norte St, Houston, TX 77018
$-712
Cash flow
-8.5%
Cash-on-Cash Return
3.7%
Cap rate
0.7%
Rent to Value Ratio

Active
$500,000
4
bds
|
3
ba
|
1,664
sqft
|
built
1950
4626 Ella Blvd, Houston, TX 77018
$-1,070
Cash flow
-11.2%
Cash-on-Cash Return
3.1%
Cap rate
0.6%
Rent to Value Ratio