77033 Investment Properties for Sale
Browse homes for sale and investment properties in 77033. Refine your search by price, property type, or more.
Best cash flowing properties in 77033
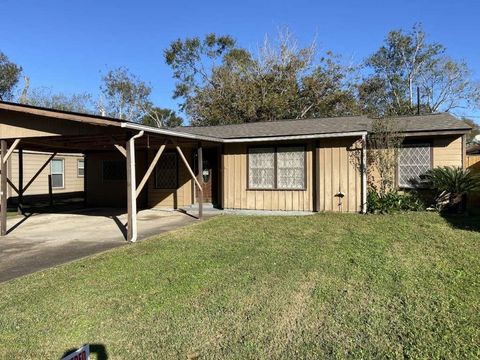
Active
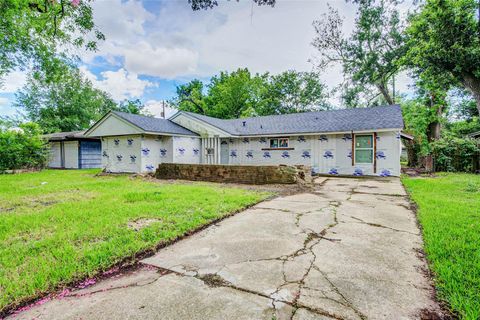
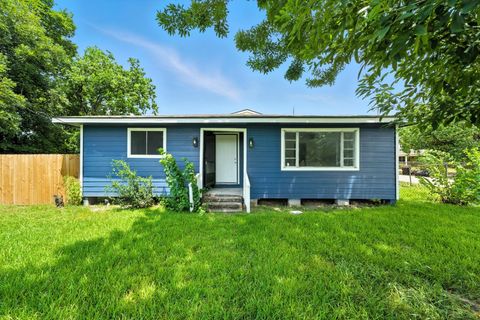
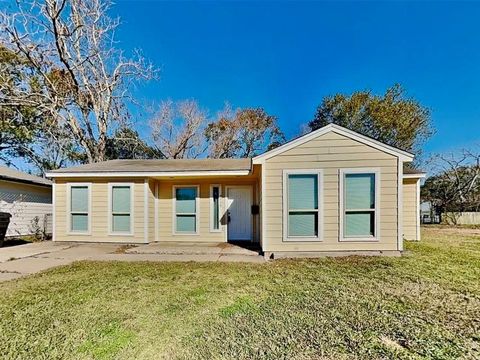
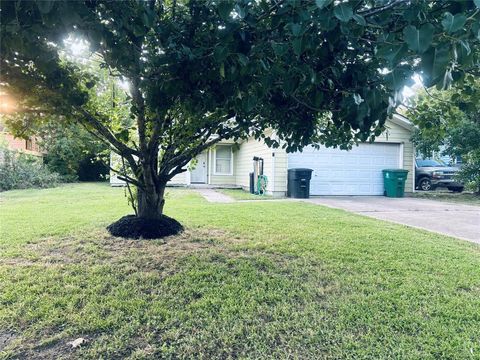
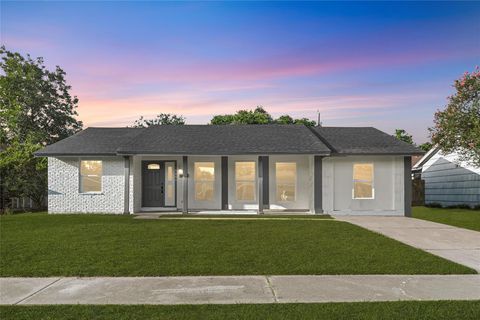
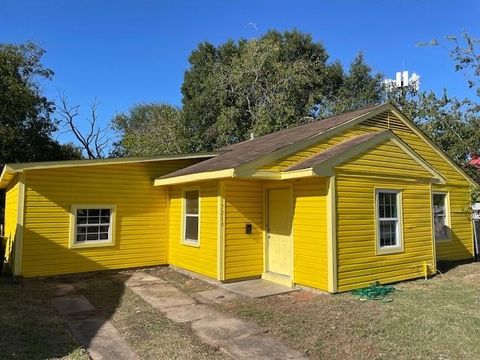
$104,900
3
bds
|
2
ba
|
1,456
sqft
|
built
1958
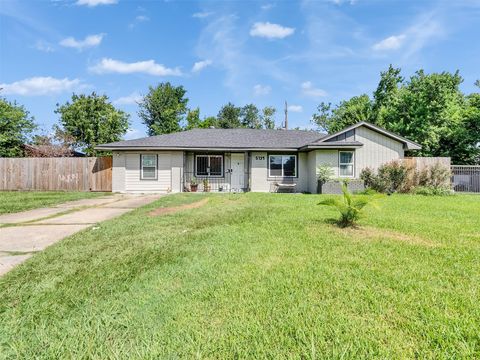
5822 Lyndhurst Dr, Houston, TX 77033
$381
Cash flow
18.9%
Cash-on-Cash Return
10.0%
Cap rate
1.5%
Rent to Value Ratio
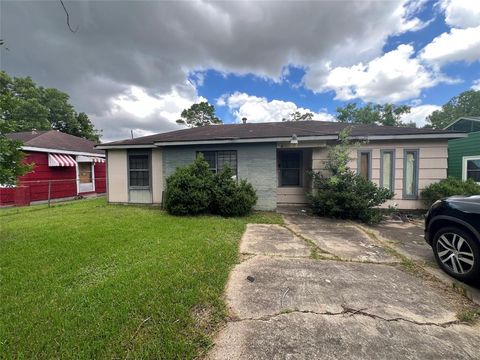
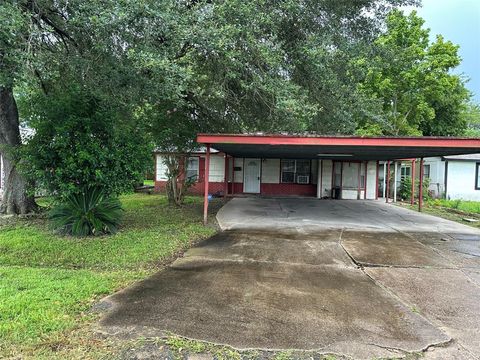
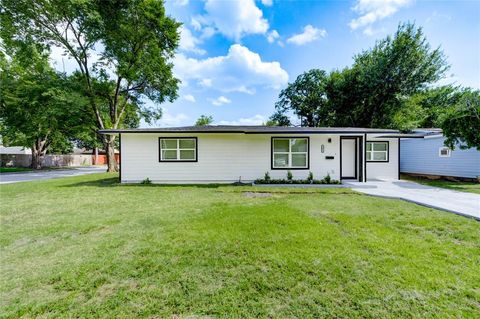
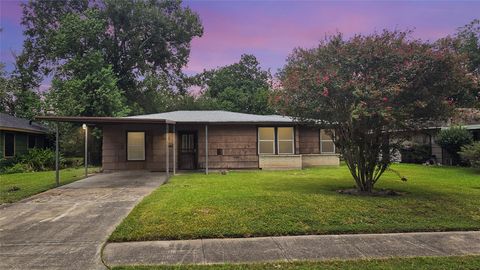
Active
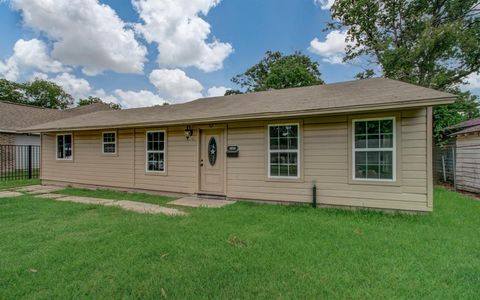
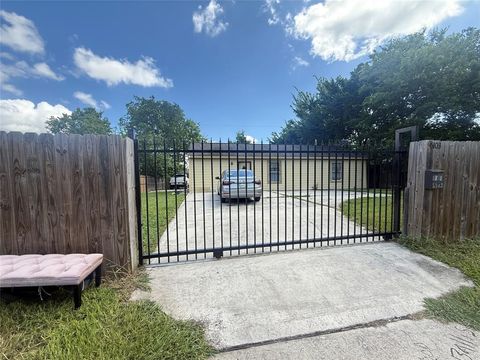
$114,999
3
bds
|
1
ba
|
1,330
sqft
|
built
1959
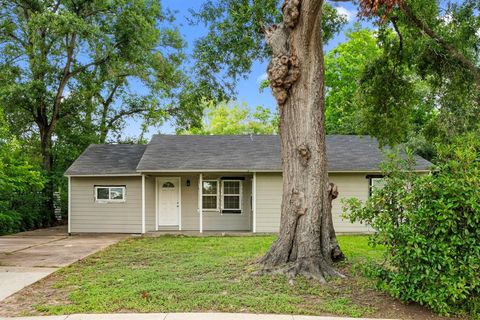
5530 Lakefield Dr, Houston, TX 77033
$345
Cash flow
15.7%
Cash-on-Cash Return
9.3%
Cap rate
1.4%
Rent to Value Ratio
106 out of 111 properties for sale in 77033
Limited Results Shown
Create a free account, or log in to reveal all property listings and enjoy the complete experience.
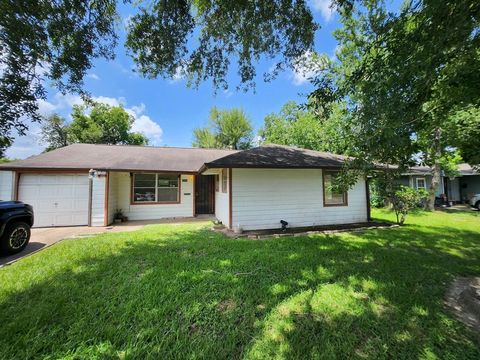
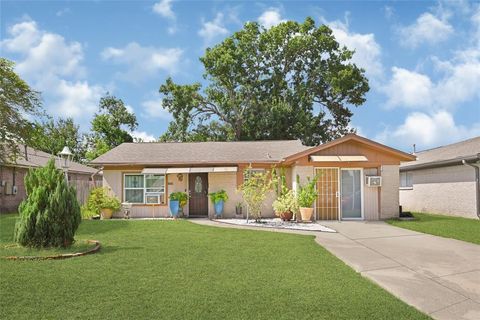
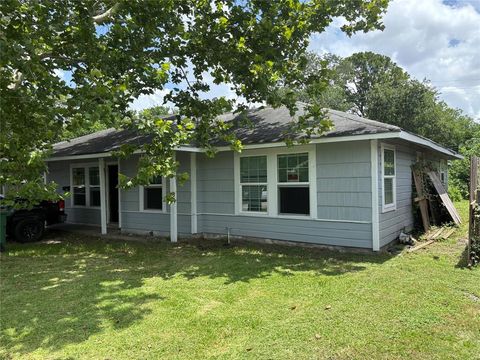
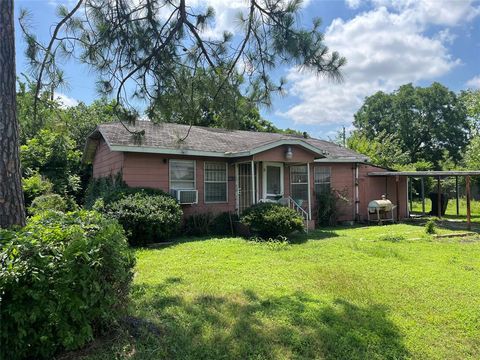
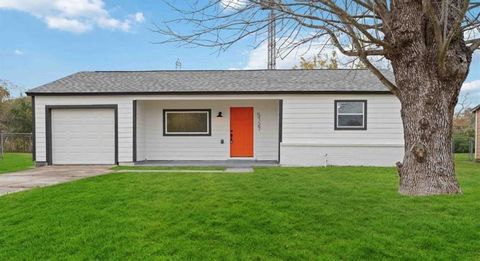
Active
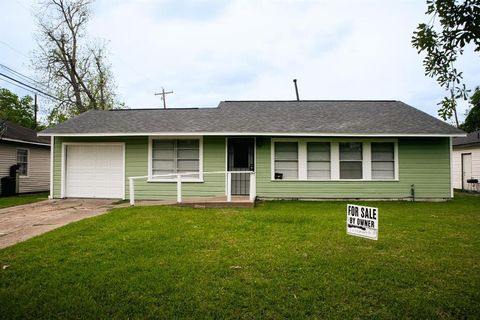
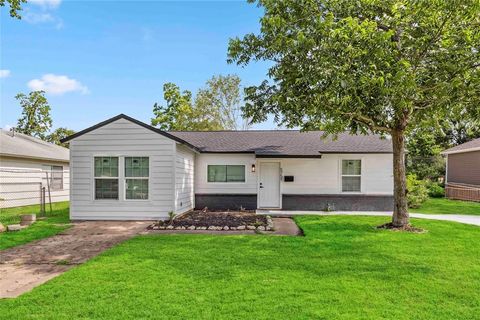
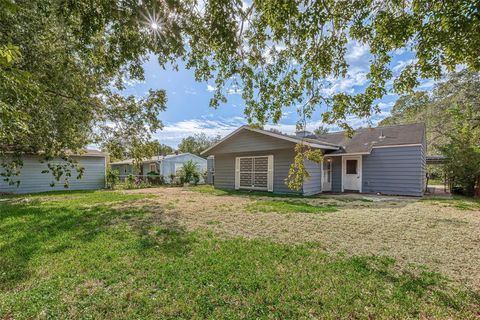
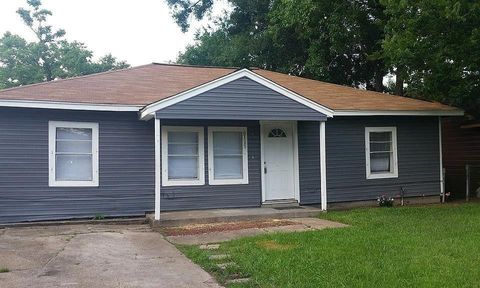
$159,000
3
bds
|
1
ba
|
1,185
sqft
|
built
1952
5535 Flamingo Dr, Houston, TX 77033
$163
Cash flow
5.3%
Cash-on-Cash Return
6.9%
Cap rate
1.0%
Rent to Value Ratio
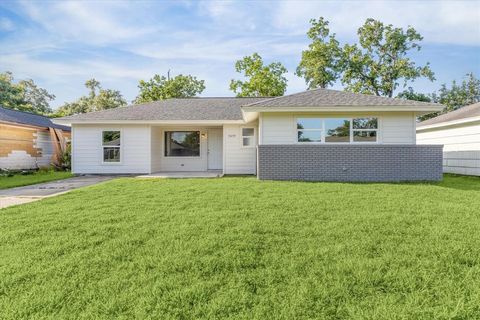
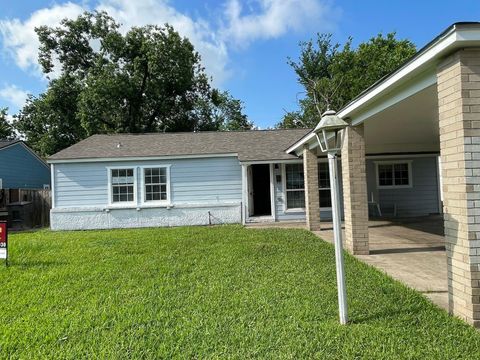
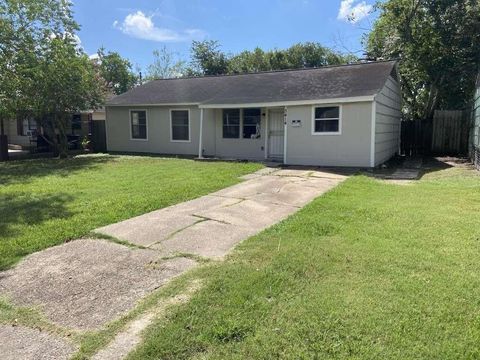
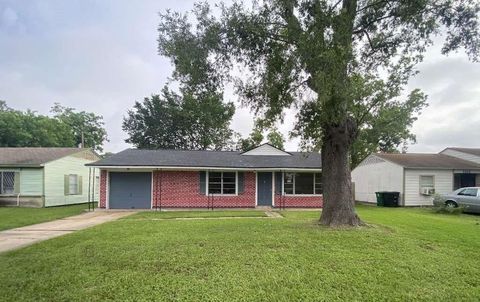
Active
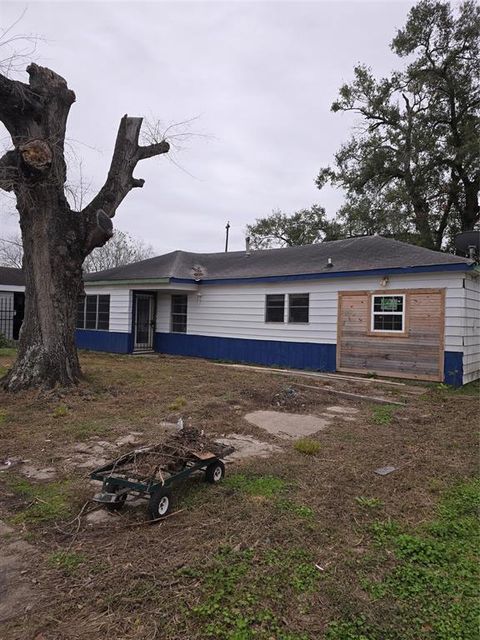
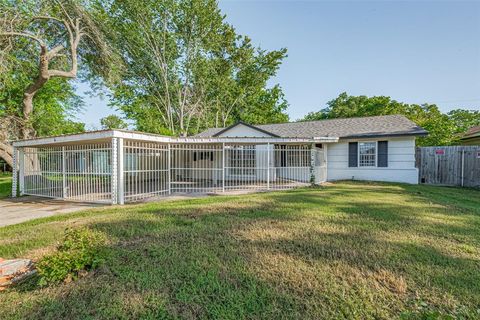
$184,000
4
bds
|
2
ba
|
1,325
sqft
|
built
1952
5859 Belmark St, Houston, TX 77033
$95
Cash flow
2.7%
Cash-on-Cash Return
6.3%
Cap rate
0.8%
Rent to Value Ratio
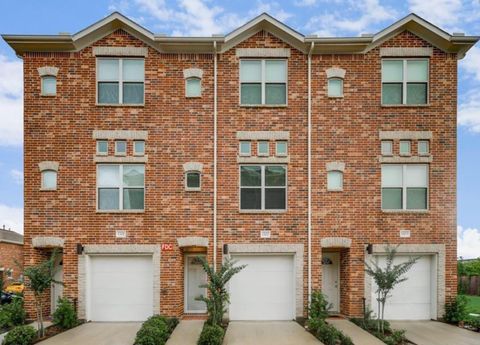
Active
$250,000
3
bds
|
3
ba
|
1,925
sqft
|
built
1955
4843 Bricker St, Houston, TX 77033
$-262
Cash flow
-5.5%
Cash-on-Cash Return
4.4%
Cap rate
0.7%
Rent to Value Ratio
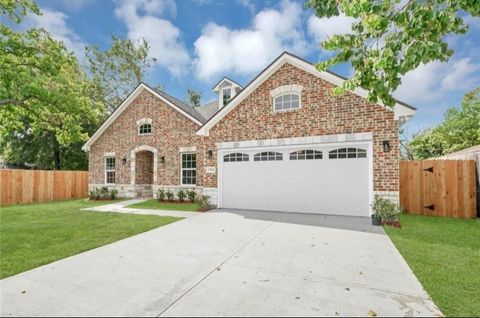
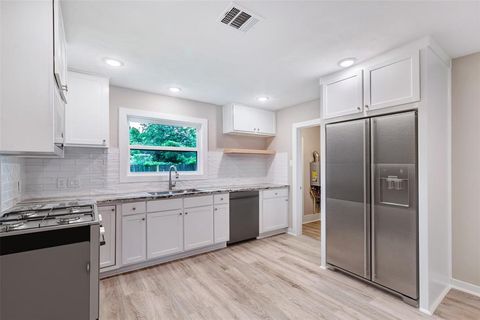
Active
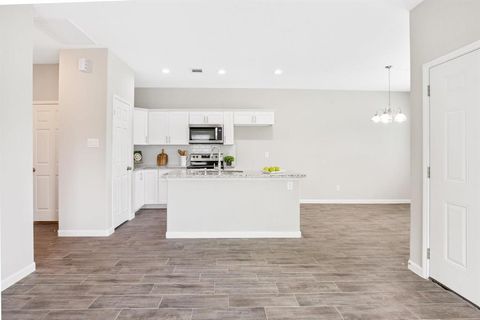
$399,900
3
bds
|
2
ba
|
2,300
sqft
|
built
2020
5911 Westover St, Houston, TX 77033
$-1,206
Cash flow
-15.7%
Cash-on-Cash Return
2.1%
Cap rate
0.5%
Rent to Value Ratio
Active
$239,000
4
bds
|
2
ba
|
1,680
sqft
|
built
1949
5933 Southmont St, Houston, TX 77033
$-174
Cash flow
-3.8%
Cash-on-Cash Return
4.8%
Cap rate
0.8%
Rent to Value Ratio
Active
$110,000
3
bds
|
1
ba
|
1,138
sqft
|
built
1948
5318 Longmeadow St, Houston, TX 77033
$215
Cash flow
10.2%
Cash-on-Cash Return
8.0%
Cap rate
1.2%
Rent to Value Ratio
Active
$235,000
4
bds
|
2
ba
|
1,681
sqft
|
built
1950
5955 Bellfort St, Houston, TX 77033
$-192
Cash flow
-4.3%
Cash-on-Cash Return
4.7%
Cap rate
0.7%
Rent to Value Ratio
Active
$255,000
4
bds
|
1
ba
|
1,403
sqft
|
built
1955
9118 St Lo Rd, Houston, TX 77033
$11
Cash flow
0.2%
Cash-on-Cash Return
5.7%
Cap rate
0.8%
Rent to Value Ratio
Active
$395,000
3
bds
|
2
ba
|
2,000
sqft
|
built
1960
5422 Rapido Rd, Houston, TX 77033
$-1,155
Cash flow
-15.3%
Cash-on-Cash Return
2.2%
Cap rate
0.3%
Rent to Value Ratio
Active
$160,000
2
bds
|
1
ba
|
825
sqft
|
built
1955
7810 Darnay Dr, Houston, TX 77033
$72
Cash flow
2.3%
Cash-on-Cash Return
6.2%
Cap rate
0.9%
Rent to Value Ratio
Active
$325,000
4
bds
|
3
ba
|
2,569
sqft
|
built
2020
5710 Pershing St, Houston, TX 77033
$-325
Cash flow
-5.2%
Cash-on-Cash Return
4.5%
Cap rate
0.8%
Rent to Value Ratio
Active
$169,331
2
bds
|
1
ba
|
1,167
sqft
|
built
1950
5939 Belarbor St, Houston, TX 77033
$57
Cash flow
1.8%
Cash-on-Cash Return
6.1%
Cap rate
0.9%
Rent to Value Ratio
Active
$149,900
3
bds
|
1
ba
|
1,224
sqft
|
built
1952
4730 Angleton St, Houston, TX 77033
$240
Cash flow
8.4%
Cash-on-Cash Return
7.6%
Cap rate
1.1%
Rent to Value Ratio
Active
$220,000
3
bds
|
3
ba
|
1,214
sqft
|
built
1970
4930 Teton St, Houston, TX 77033
$-57
Cash flow
-1.4%
Cash-on-Cash Return
5.4%
Cap rate
0.8%
Rent to Value Ratio
Active
$185,000
4
bds
|
2
ba
|
1,776
sqft
|
built
1950
7625 St Lo Rd, Houston, TX 77033
$151
Cash flow
4.3%
Cash-on-Cash Return
6.7%
Cap rate
1.0%
Rent to Value Ratio
Active
$164,900
3
bds
|
1
ba
|
1,200
sqft
|
built
1952
5746 Groveton St, Houston, TX 77033
$65
Cash flow
2.1%
Cash-on-Cash Return
6.1%
Cap rate
1.0%
Rent to Value Ratio
Active
$239,900
2
bds
|
2
ba
|
1,548
sqft
|
built
2016
5941 South Loop E, Houston, TX 77033
$-470
Cash flow
-10.2%
Cash-on-Cash Return
3.3%
Cap rate
0.8%
Rent to Value Ratio
Active
$229,000
4
bds
|
2
ba
|
1,240
sqft
|
built
1950
5858 Beldart St, Houston, TX 77033
$-235
Cash flow
-5.4%
Cash-on-Cash Return
4.4%
Cap rate
0.7%
Rent to Value Ratio
Active
$160,000
3
bds
|
2
ba
|
806
sqft
|
built
1950
5939 Belcrest St, Houston, TX 77033
$133
Cash flow
4.3%
Cash-on-Cash Return
6.7%
Cap rate
1.0%
Rent to Value Ratio
Active
$240,000
4
bds
|
3
ba
|
1,520
sqft
|
built
1950
5978 Southmont St, Houston, TX 77033
$-395
Cash flow
-8.6%
Cash-on-Cash Return
3.7%
Cap rate
0.6%
Rent to Value Ratio
Active
$99,000
2
bds
|
1
ba
|
640
sqft
|
built
1940
10113 Teneha Dr, Houston, TX 77033
$145
Cash flow
7.6%
Cash-on-Cash Return
7.4%
Cap rate
1.1%
Rent to Value Ratio
Active
$189,999
4
bds
|
1
ba
|
1,165
sqft
|
built
1955
5414 Northridge Dr, Houston, TX 77033
$-68
Cash flow
-1.9%
Cash-on-Cash Return
5.2%
Cap rate
0.8%
Rent to Value Ratio
Active
$239,000
3
bds
|
1
ba
|
1,334
sqft
|
built
1958
5739 Waterford Dr, Houston, TX 77033
$-414
Cash flow
-9.0%
Cash-on-Cash Return
3.6%
Cap rate
0.7%
Rent to Value Ratio
Active
$189,900
3
bds
|
1
ba
|
1,435
sqft
|
built
1947
5835 Southseas St, Houston, TX 77033
$-15
Cash flow
-0.4%
Cash-on-Cash Return
5.6%
Cap rate
0.9%
Rent to Value Ratio
Active
$122,500
3
bds
|
1
ba
|
1,130
sqft
|
built
1952
4914 Angleton St, Houston, TX 77033
$223
Cash flow
9.5%
Cash-on-Cash Return
7.9%
Cap rate
1.1%
Rent to Value Ratio
Active
$163,000
3
bds
|
2
ba
|
0
sqft
|
built
1955
6147 Glenhurst Dr, Houston, TX 77033
$333
Cash flow
10.7%
Cash-on-Cash Return
8.1%
Cap rate
1.0%
Rent to Value Ratio
Active
$175,000
3
bds
|
2
ba
|
1,468
sqft
|
built
2004
7350 Hurtgen Forest Rd, Houston, TX 77033
$124
Cash flow
3.7%
Cash-on-Cash Return
6.5%
Cap rate
1.0%
Rent to Value Ratio
Active
$124,900
3
bds
|
2
ba
|
1,452
sqft
|
built
1952
6027 Kenilwood Dr, Houston, TX 77033
$311
Cash flow
13.0%
Cash-on-Cash Return
8.7%
Cap rate
1.3%
Rent to Value Ratio
Active
$195,000
3
bds
|
1
ba
|
1,200
sqft
|
built
1952
5727 Rue St, Houston, TX 77033
$-199
Cash flow
-5.3%
Cash-on-Cash Return
4.5%
Cap rate
0.8%
Rent to Value Ratio
Active
$199,999
3
bds
|
1
ba
|
1,128
sqft
|
built
1951
5715 Belmark St, Houston, TX 77033
$-67
Cash flow
-1.7%
Cash-on-Cash Return
5.3%
Cap rate
0.8%
Rent to Value Ratio
Active
$224,900
4
bds
|
2
ba
|
1,482
sqft
|
built
1956
5854 Schevers St, Houston, TX 77033
$-197
Cash flow
-4.6%
Cash-on-Cash Return
4.6%
Cap rate
0.7%
Rent to Value Ratio
Active
$225,000
3
bds
|
2
ba
|
1,396
sqft
|
built
1960
5839 Southurst St, Houston, TX 77033
$59
Cash flow
1.4%
Cash-on-Cash Return
6.0%
Cap rate
0.9%
Rent to Value Ratio
Active
$193,500
3
bds
|
2
ba
|
1,170
sqft
|
built
1950
5751 Belmark St, Houston, TX 77033
$87
Cash flow
2.3%
Cash-on-Cash Return
6.2%
Cap rate
0.9%
Rent to Value Ratio
Active
$195,000
4
bds
|
2
ba
|
1,397
sqft
|
built
1948
5619 Willow Glen Dr, Houston, TX 77033
$-3
Cash flow
-0.1%
Cash-on-Cash Return
5.7%
Cap rate
0.8%
Rent to Value Ratio
Active
$210,000
3
bds
|
1
ba
|
981
sqft
|
built
1956
7210 Kassarine Pass, Houston, TX 77033
$-289
Cash flow
-7.2%
Cash-on-Cash Return
4.0%
Cap rate
0.6%
Rent to Value Ratio
Active
$219,900
4
bds
|
2
ba
|
1,370
sqft
|
built
1955
5103 Northridge Dr, Houston, TX 77033
$-260
Cash flow
-6.2%
Cash-on-Cash Return
4.3%
Cap rate
0.7%
Rent to Value Ratio
Active
$210,000
3
bds
|
1
ba
|
1,053
sqft
|
built
1950
5117 Rapido Rd, Houston, TX 77033
$-266
Cash flow
-6.6%
Cash-on-Cash Return
4.2%
Cap rate
0.6%
Rent to Value Ratio
Active
$175,000
3
bds
|
2
ba
|
1,470
sqft
|
built
1956
5535 Elmlawn Dr, Houston, TX 77033
$56
Cash flow
1.7%
Cash-on-Cash Return
6.1%
Cap rate
0.9%
Rent to Value Ratio