77033 Investment Properties for Sale
Browse homes for sale and investment properties in 77033. Refine your search by price, property type, or more.
Best cash flowing properties in 77033
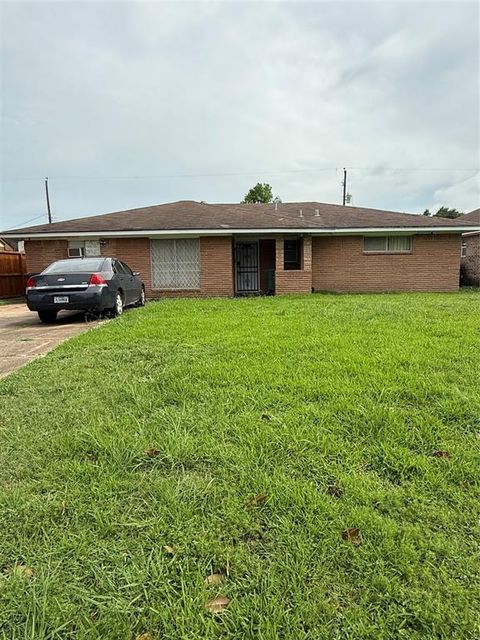
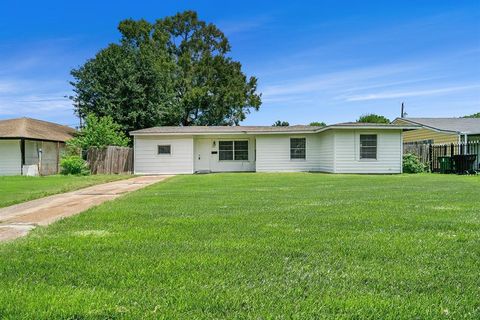
Active
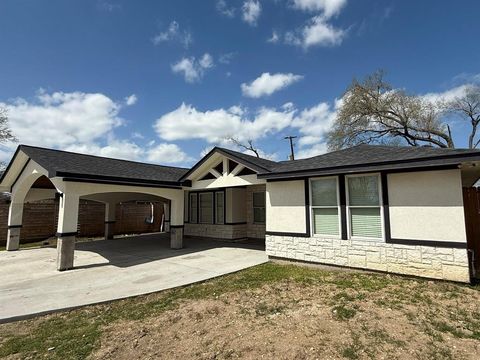
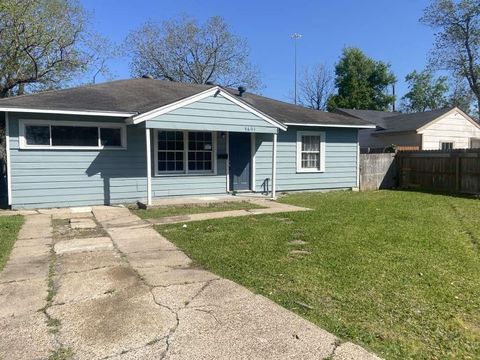
$155,000
3
bds
|
2
ba
|
1,912
sqft
|
built
1965
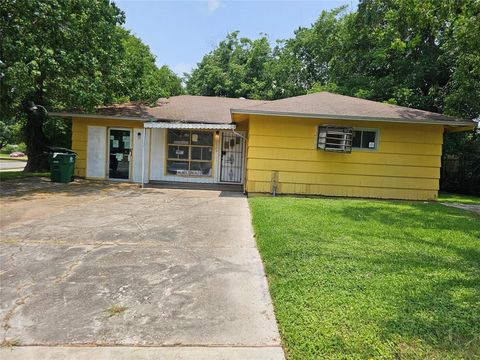
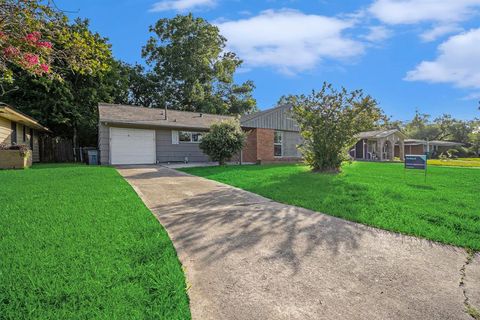
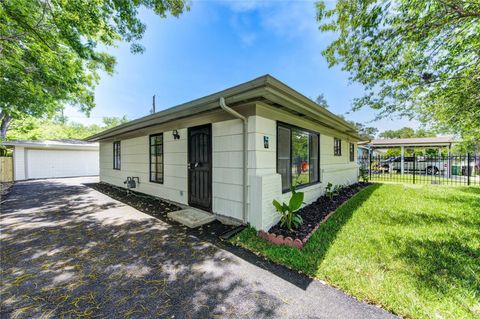
4830 Teton St, Houston, TX 77033
$441
Cash flow
14.8%
Cash-on-Cash Return
9.1%
Cap rate
1.3%
Rent to Value Ratio
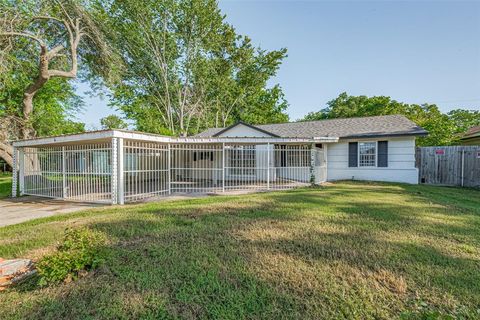
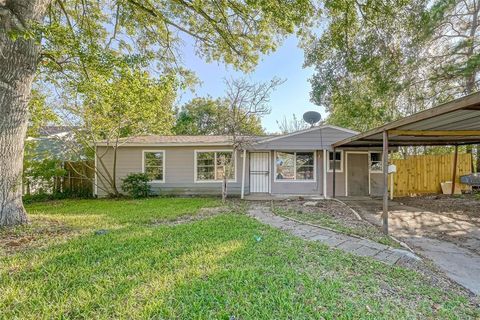
Active
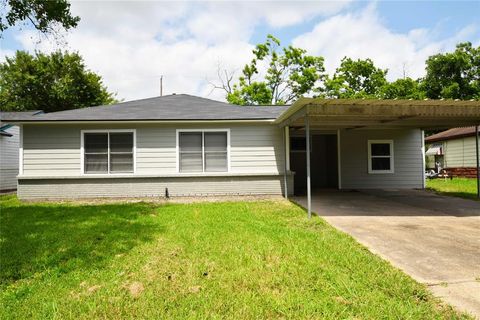
$120,000
3
bds
|
1
ba
|
1,140
sqft
|
built
1955
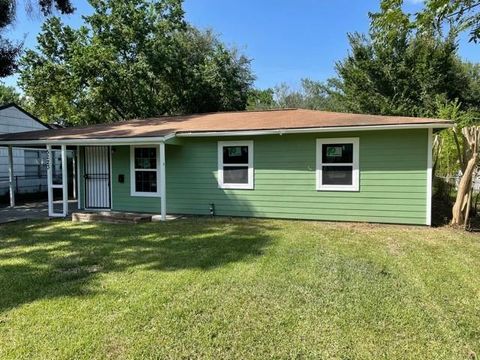
5327 Northridge Dr, Houston, TX 77033
$391
Cash flow
17.0%
Cash-on-Cash Return
9.6%
Cap rate
1.3%
Rent to Value Ratio
109 out of 114 properties for sale in 77033
Limited Results Shown
Create a free account, or log in to reveal all property listings and enjoy the complete experience.
Active
$210,000
3
bds
|
1
ba
|
1,053
sqft
|
built
1950
5117 Rapido Rd, Houston, TX 77033
$-266
Cash flow
-6.6%
Cash-on-Cash Return
4.2%
Cap rate
0.6%
Rent to Value Ratio
Active
$209,900
3
bds
|
2
ba
|
1,350
sqft
|
built
1960
5614 Flamingo Dr, Houston, TX 77033
$-146
Cash flow
-3.6%
Cash-on-Cash Return
4.8%
Cap rate
0.8%
Rent to Value Ratio
Active
$189,900
4
bds
|
2
ba
|
1,760
sqft
|
built
1965
5911 Kenilwood Dr, Houston, TX 77033
$-6
Cash flow
-0.2%
Cash-on-Cash Return
5.6%
Cap rate
0.9%
Rent to Value Ratio
Active
$175,000
3
bds
|
2
ba
|
1,470
sqft
|
built
1956
5535 Elmlawn Dr, Houston, TX 77033
$56
Cash flow
1.7%
Cash-on-Cash Return
6.1%
Cap rate
0.9%
Rent to Value Ratio
Active
$189,000
3
bds
|
1
ba
|
1,040
sqft
|
built
1950
4913 Chennault Rd, Houston, TX 77033
$-257
Cash flow
-7.1%
Cash-on-Cash Return
4.0%
Cap rate
0.7%
Rent to Value Ratio
Active
$159,000
3
bds
|
2
ba
|
1,219
sqft
|
built
1948
5619 Lyndhurst Dr, Houston, TX 77033
$41
Cash flow
1.3%
Cash-on-Cash Return
6.0%
Cap rate
1.0%
Rent to Value Ratio
Active
$199,000
3
bds
|
1
ba
|
1,240
sqft
|
built
1954
5703 Belneath St, Houston, TX 77033
$-171
Cash flow
-4.5%
Cash-on-Cash Return
4.6%
Cap rate
0.8%
Rent to Value Ratio
Active
$193,999
3
bds
|
1
ba
|
1,228
sqft
|
built
1952
5810 Belmark St, Houston, TX 77033
$-154
Cash flow
-4.1%
Cash-on-Cash Return
4.7%
Cap rate
0.8%
Rent to Value Ratio
Active
$189,995
3
bds
|
2
ba
|
1,516
sqft
|
built
1951
5754 Belarbor St, Houston, TX 77033
$343
Cash flow
9.4%
Cash-on-Cash Return
7.8%
Cap rate
0.9%
Rent to Value Ratio
Active
$123,000
3
bds
|
1
ba
|
1,200
sqft
|
built
1955
5211 Pensdale St, Houston, TX 77033
$384
Cash flow
16.3%
Cash-on-Cash Return
9.4%
Cap rate
1.1%
Rent to Value Ratio
Active
$175,000
3
bds
|
1
ba
|
1,567
sqft
|
built
1958
5715 Willow Glen Dr, Houston, TX 77033
$197
Cash flow
5.9%
Cash-on-Cash Return
7.0%
Cap rate
1.0%
Rent to Value Ratio
Active
$350,000
4
bds
|
4
ba
|
1,841
sqft
|
built
2003
5847 Southington St, Houston, TX 77033
$-949
Cash flow
-14.1%
Cash-on-Cash Return
2.4%
Cap rate
0.5%
Rent to Value Ratio
Active
$150,000
3
bds
|
1
ba
|
956
sqft
|
built
1955
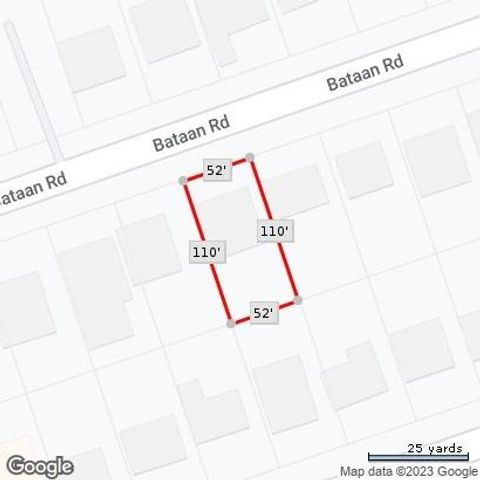
5318 Bataan Rd, Houston, TX 77033
$31
Cash flow
1.1%
Cash-on-Cash Return
5.9%
Cap rate
0.9%
Rent to Value Ratio
Active
$300,000
3
bds
|
2
ba
|
2,063
sqft
|
built
1950
9422 Coffee St, Houston, TX 77033
$-523
Cash flow
-9.1%
Cash-on-Cash Return
3.6%
Cap rate
0.6%
Rent to Value Ratio
Active
$260,000
3
bds
|
2
ba
|
1,216
sqft
|
built
1951
5715 Belarbor St, Houston, TX 77033
$-238
Cash flow
-4.8%
Cash-on-Cash Return
4.6%
Cap rate
0.8%
Rent to Value Ratio
Active
$184,900
3
bds
|
2
ba
|
1,200
sqft
|
built
1955
8130 Sharondale Dr, Houston, TX 77033
$-371
Cash flow
-10.5%
Cash-on-Cash Return
3.3%
Cap rate
0.6%
Rent to Value Ratio
Active
$209,000
4
bds
|
2
ba
|
1,188
sqft
|
built
1950
5754 Belneath St, Houston, TX 77033
$-255
Cash flow
-6.4%
Cash-on-Cash Return
4.2%
Cap rate
0.7%
Rent to Value Ratio
Active
$160,000
3
bds
|
1
ba
|
956
sqft
|
built
1955
7005 Kassarine Pass, Houston, TX 77033
$33
Cash flow
1.1%
Cash-on-Cash Return
5.9%
Cap rate
0.9%
Rent to Value Ratio
Active
$90,000
3
bds
|
1
ba
|
1,206
sqft
|
built
1955
5235 Bellfort St, Houston, TX 77033
$252
Cash flow
14.6%
Cash-on-Cash Return
9.0%
Cap rate
1.4%
Rent to Value Ratio
Active
$185,000
3
bds
|
2
ba
|
1,330
sqft
|
built
1955
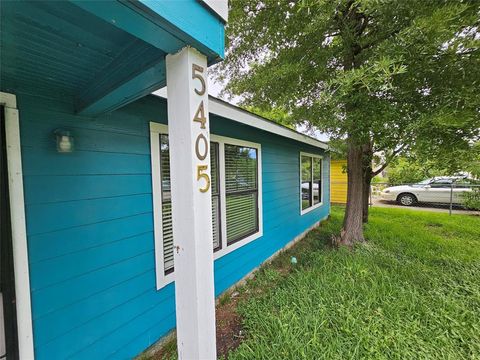
5405 Southlea St, Houston, TX 77033
$65
Cash flow
1.8%
Cash-on-Cash Return
6.1%
Cap rate
1.0%
Rent to Value Ratio
Active
$220,000
4
bds
|
2
ba
|
1,200
sqft
|
built
1950
5822 Beldart St, Houston, TX 77033
$-379
Cash flow
-9.0%
Cash-on-Cash Return
3.6%
Cap rate
0.6%
Rent to Value Ratio
Active
$184,900
3
bds
|
2
ba
|
1,154
sqft
|
built
1950
7330 Hurtgen Forest Rd, Houston, TX 77033
$33
Cash flow
0.9%
Cash-on-Cash Return
5.9%
Cap rate
1.0%
Rent to Value Ratio

Active
$149,000
2
bds
|
1
ba
|
1,002
sqft
|
built
1952
5622 Beldart St, Houston, TX 77033
$77
Cash flow
2.7%
Cash-on-Cash Return
6.3%
Cap rate
1.0%
Rent to Value Ratio
Active
$260,000
4
bds
|
3
ba
|
2,000
sqft
|
built
1950
6155 Ridgeway Dr, Houston, TX 77033
$-304
Cash flow
-6.1%
Cash-on-Cash Return
4.3%
Cap rate
0.7%
Rent to Value Ratio
Active
$99,000
4
bds
|
2
ba
|
1,665
sqft
|
built
1960
5118 Mallow St, Houston, TX 77033
$196
Cash flow
10.3%
Cash-on-Cash Return
8.1%
Cap rate
1.3%
Rent to Value Ratio
Active
$190,000
4
bds
|
2
ba
|
1,550
sqft
|
built
1950
4906 Larkspur St, Houston, TX 77033
$-128
Cash flow
-3.5%
Cash-on-Cash Return
4.9%
Cap rate
0.7%
Rent to Value Ratio
Active
$215,300
7
bds
|
2
ba
|
1,721
sqft
|
built
1956
5742 Schevers St, Houston, TX 77033
$-142
Cash flow
-3.4%
Cash-on-Cash Return
4.9%
Cap rate
0.8%
Rent to Value Ratio
Active
$238,990
3
bds
|
2
ba
|
1,287
sqft
|
built
1945
4914 Pershing St, Houston, TX 77033
$-178
Cash flow
-3.9%
Cash-on-Cash Return
4.8%
Cap rate
0.7%
Rent to Value Ratio
Active
$185,000
3
bds
|
1
ba
|
875
sqft
|
built
1955
5223 Myrtlewood St, Houston, TX 77033
$-151
Cash flow
-4.3%
Cash-on-Cash Return
4.7%
Cap rate
0.7%
Rent to Value Ratio
Active
$187,500
3
bds
|
2
ba
|
1,161
sqft
|
built
1961
5826 Flamingo Dr, Houston, TX 77033
$-18
Cash flow
-0.5%
Cash-on-Cash Return
5.6%
Cap rate
0.9%
Rent to Value Ratio
Active
$850,000
2
bds
|
1
ba
|
5,332
sqft
|
built
1960
5022 Mallow St, Houston, TX 77033
$-3,959
Cash flow
-24.3%
Cash-on-Cash Return
0.1%
Cap rate
0.2%
Rent to Value Ratio
Active
$330,000
5
bds
|
3
ba
|
1,981
sqft
|
built
2019
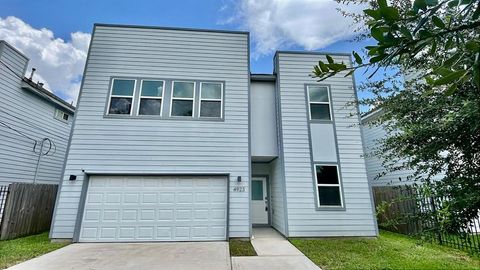
4923 Higgins St, Houston, TX 77033
$-395
Cash flow
-6.2%
Cash-on-Cash Return
4.2%
Cap rate
0.8%
Rent to Value Ratio
Active
$185,000
4
bds
|
2
ba
|
1,300
sqft
|
built
1952
6058 Glenhurst Dr, Houston, TX 77033
$55
Cash flow
1.6%
Cash-on-Cash Return
6.0%
Cap rate
0.9%
Rent to Value Ratio
Active
$213,000
4
bds
|
2
ba
|
1,781
sqft
|
built
1952
4718 Teton St, Houston, TX 77033
$-175
Cash flow
-4.3%
Cash-on-Cash Return
4.7%
Cap rate
0.8%
Rent to Value Ratio
Active
$245,000
3
bds
|
2
ba
|
1,568
sqft
|
built
1955
5631 Westover St, Houston, TX 77033
$-427
Cash flow
-9.1%
Cash-on-Cash Return
3.6%
Cap rate
0.6%
Rent to Value Ratio
Active
$174,999
2
bds
|
2
ba
|
1,163
sqft
|
built
1955
5601 Malmedy Rd, Houston, TX 77033
$-1
Cash flow
0.0%
Cash-on-Cash Return
5.7%
Cap rate
0.9%
Rent to Value Ratio
Active
$199,999
5
bds
|
3
ba
|
1,464
sqft
|
built
1955
5102 Lyndhurst Dr, Houston, TX 77033
$135
Cash flow
3.5%
Cash-on-Cash Return
6.5%
Cap rate
1.0%
Rent to Value Ratio
Active
$275,000
3
bds
|
3
ba
|
1,684
sqft
|
built
1959
5727 Thrush Dr, Houston, TX 77033
$-579
Cash flow
-11.0%
Cash-on-Cash Return
3.2%
Cap rate
0.5%
Rent to Value Ratio