77036 Investment Properties for Sale
Browse homes for sale and investment properties in 77036. Refine your search by price, property type, or more.
Best cash flowing properties in 77036

Active
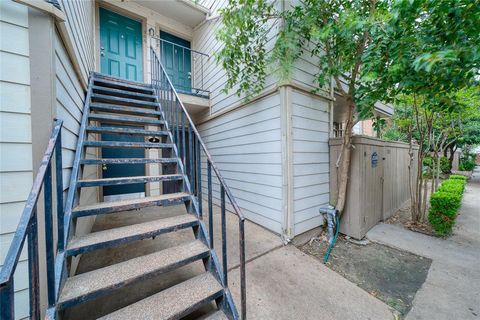
$67,500
1
bds
|
1
ba
|
713
sqft
|
built
1981
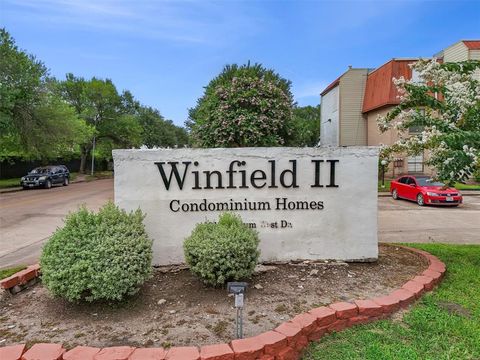
10110 Forum West Dr, Houston, TX 77036
$569
Cash flow
9.8%
Cash-on-Cash Return
10.1%
Cap rate
1.5%
Rent to Value Ratio

Active
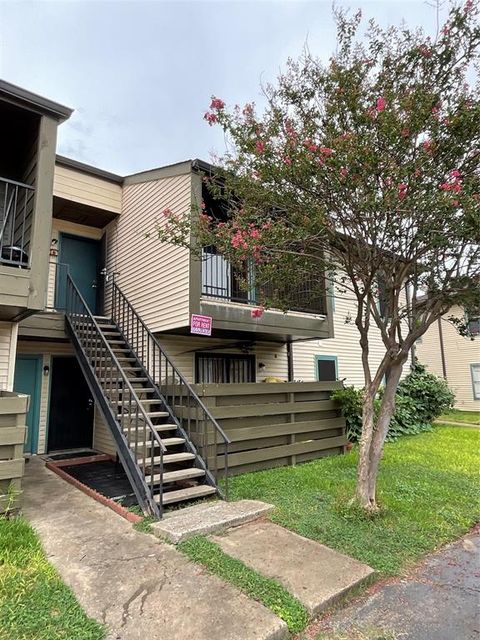
$67,500
1
bds
|
1
ba
|
713
sqft
|
built
1981
10110 Forum West Dr, Houston, TX 77036
$569
Cash flow
9.8%
Cash-on-Cash Return
10.1%
Cap rate
1.5%
Rent to Value Ratio
61 out of 70 properties for sale in 77036
Limited Results Shown
Create a free account, or log in to reveal all property listings and enjoy the complete experience.
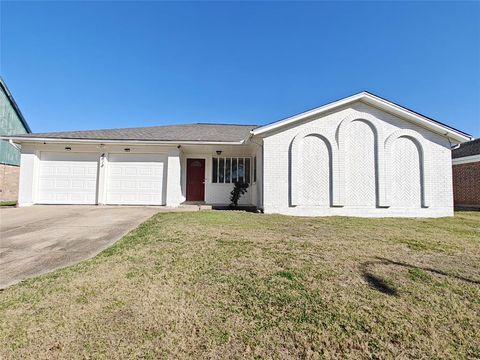
Active
$380,000
4
bds
|
4
ba
|
2,612
sqft
|
built
2001
6107 S Arrowana Ln, Houston, TX 77036
$-894
Cash flow
-12.3%
Cash-on-Cash Return
2.9%
Cap rate
0.7%
Rent to Value Ratio
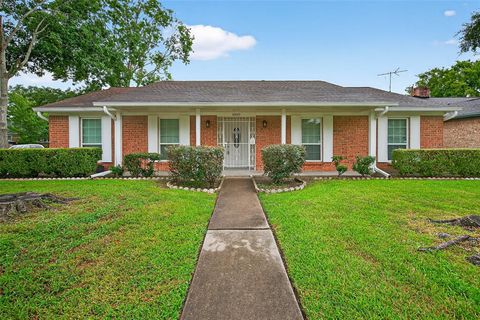
Active
$159,000
2
bds
|
2
ba
|
1,103
sqft
|
built
1980
8435 Sands Point Dr, Houston, TX 77036
$-286
Cash flow
-9.4%
Cash-on-Cash Return
3.5%
Cap rate
0.9%
Rent to Value Ratio
Active
$146,000
2
bds
|
2
ba
|
1,250
sqft
|
built
1979
9201 Clarewood Dr, Houston, TX 77036
$-263
Cash flow
-9.4%
Cash-on-Cash Return
3.5%
Cap rate
1.0%
Rent to Value Ratio
Active
$80,000
1
bds
|
1
ba
|
693
sqft
|
built
1979
6001 Reims Rd, Houston, TX 77036
$-72
Cash flow
-4.7%
Cash-on-Cash Return
4.6%
Cap rate
1.3%
Rent to Value Ratio
Active
$75,000
2
bds
|
2
ba
|
1,002
sqft
|
built
1981
10110 Forum West Dr, Houston, TX 77036
$386
Cash flow
26.9%
Cash-on-Cash Return
11.9%
Cap rate
1.7%
Rent to Value Ratio

Active
$379,000
3
bds
|
3
ba
|
2,422
sqft
|
built
2007
7143 Windwater Lagoon, Houston, TX 77036
$-877
Cash flow
-12.1%
Cash-on-Cash Return
2.9%
Cap rate
0.7%
Rent to Value Ratio
Active
$120,000
2
bds
|
2
ba
|
1,108
sqft
|
built
1984
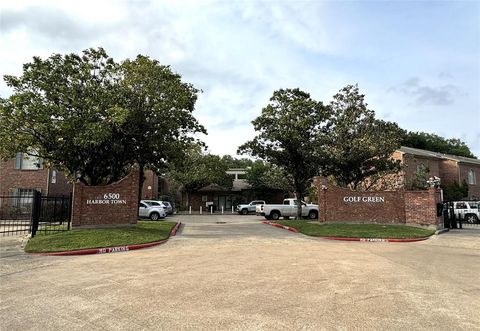
6500 Harbor Town Dr, Houston, TX 77036
$-216
Cash flow
-9.4%
Cash-on-Cash Return
3.5%
Cap rate
1.2%
Rent to Value Ratio
Active
$59,900
1
bds
|
1
ba
|
693
sqft
|
built
1979
6001 Reims Rd, Houston, TX 77036
$238
Cash flow
4.6%
Cash-on-Cash Return
4.8%
Cap rate
1.5%
Rent to Value Ratio
Active
$368,000
4
bds
|
2
ba
|
1,681
sqft
|
built
1967
8711 Bellaire Blvd, Houston, TX 77036
$-696
Cash flow
-9.9%
Cash-on-Cash Return
3.4%
Cap rate
0.5%
Rent to Value Ratio
Active
$71,900
1
bds
|
1
ba
|
710
sqft
|
built
1979
9350 Country Creek Dr, Houston, TX 77036
$316
Cash flow
5.1%
Cash-on-Cash Return
5.3%
Cap rate
1.4%
Rent to Value Ratio
Active
$299,000
3
bds
|
2
ba
|
1,583
sqft
|
built
1966
8419 Stroud Dr, Houston, TX 77036
$-474
Cash flow
-8.3%
Cash-on-Cash Return
3.8%
Cap rate
0.7%
Rent to Value Ratio
Active
$325,000
5
bds
|
2
ba
|
2,038
sqft
|
built
1966
8218 Hazen St, Houston, TX 77036
$-41
Cash flow
-0.7%
Cash-on-Cash Return
5.5%
Cap rate
0.7%
Rent to Value Ratio
Active
$333,000
3
bds
|
4
ba
|
2,241
sqft
|
built
2000
7150 Windwater Pkwy N, Houston, TX 77036
$-803
Cash flow
-12.6%
Cash-on-Cash Return
2.8%
Cap rate
0.8%
Rent to Value Ratio
Active
$360,000
4
bds
|
3
ba
|
2,436
sqft
|
built
1998
8360 Golf Green Cir, Houston, TX 77036
$-48
Cash flow
-0.7%
Cash-on-Cash Return
5.5%
Cap rate
0.7%
Rent to Value Ratio
Active
$378,000
4
bds
|
3
ba
|
2,558
sqft
|
built
1965
7807 Bellerive Dr, Houston, TX 77036
$-462
Cash flow
-6.4%
Cash-on-Cash Return
4.2%
Cap rate
0.7%
Rent to Value Ratio
Active
$158,000
2
bds
|
2
ba
|
1,218
sqft
|
built
1980
9901 Sharpcrest St, Houston, TX 77036
$-293
Cash flow
-9.7%
Cash-on-Cash Return
3.5%
Cap rate
0.9%
Rent to Value Ratio
Active
$94,500
2
bds
|
1
ba
|
885
sqft
|
built
1977
7200 Clarewood Dr, Houston, TX 77036
$-187
Cash flow
-10.3%
Cash-on-Cash Return
3.3%
Cap rate
1.3%
Rent to Value Ratio
Active
$162,000
2
bds
|
2
ba
|
1,196
sqft
|
built
1975
8979 Imogene St, Houston, TX 77036
$199
Cash flow
6.4%
Cash-on-Cash Return
7.2%
Cap rate
0.9%
Rent to Value Ratio

Active
$94,000
2
bds
|
2
ba
|
934
sqft
|
built
1977
6161 Reims Rd, Houston, TX 77036
$-100
Cash flow
-5.6%
Cash-on-Cash Return
4.4%
Cap rate
1.2%
Rent to Value Ratio

Active
$138,000
2
bds
|
3
ba
|
1,374
sqft
|
built
1964
7655 Bellerive Dr, Houston, TX 77036
$-225
Cash flow
-8.5%
Cash-on-Cash Return
3.7%
Cap rate
1.0%
Rent to Value Ratio
Active
$349,000
3
bds
|
2
ba
|
1,697
sqft
|
built
1966
9006 Roos Rd, Houston, TX 77036
$-877
Cash flow
-13.1%
Cash-on-Cash Return
2.7%
Cap rate
0.6%
Rent to Value Ratio
Active
$127,500
2
bds
|
2
ba
|
1,103
sqft
|
built
1983
8267 Sands Point Dr, Houston, TX 77036
$-364
Cash flow
-14.9%
Cash-on-Cash Return
2.2%
Cap rate
1.1%
Rent to Value Ratio
Active
$120,000
2
bds
|
2
ba
|
1,016
sqft
|
built
1984
6500 Harbor Town Dr, Houston, TX 77036
$-145
Cash flow
-6.3%
Cash-on-Cash Return
4.2%
Cap rate
1.0%
Rent to Value Ratio

Active
$99,000
2
bds
|
1
ba
|
1,011
sqft
|
built
1966
7520 Hornwood Dr, Houston, TX 77036
$-147
Cash flow
-7.7%
Cash-on-Cash Return
3.9%
Cap rate
1.3%
Rent to Value Ratio
Active
$94,500
2
bds
|
1
ba
|
876
sqft
|
built
1977
6161 Reims Rd, Houston, TX 77036
$-138
Cash flow
-7.6%
Cash-on-Cash Return
3.9%
Cap rate
1.1%
Rent to Value Ratio
Active
$120,000
2
bds
|
3
ba
|
1,312
sqft
|
built
1979
9350 Country Creek Dr, Houston, TX 77036
$-214
Cash flow
-9.3%
Cash-on-Cash Return
3.5%
Cap rate
1.2%
Rent to Value Ratio

Active
$67,000
1
bds
|
1
ba
|
693
sqft
|
built
1979
6001 Reims Rd, Houston, TX 77036
$290
Cash flow
5.0%
Cash-on-Cash Return
5.2%
Cap rate
1.5%
Rent to Value Ratio

Active
$389,900
5
bds
|
4
ba
|
2,224
sqft
|
built
1968
8335 Hazen St, Houston, TX 77036
$-818
Cash flow
-10.9%
Cash-on-Cash Return
3.2%
Cap rate
0.6%
Rent to Value Ratio

Active
$79,000
1
bds
|
1
ba
|
713
sqft
|
built
1981
10110 Forum West Dr, Houston, TX 77036
$51
Cash flow
3.4%
Cash-on-Cash Return
6.5%
Cap rate
1.4%
Rent to Value Ratio
Active
$64,875
1
bds
|
1
ba
|
784
sqft
|
built
1981
10211 Sugar Branch Dr, Houston, TX 77036
$337
Cash flow
6.1%
Cash-on-Cash Return
6.2%
Cap rate
1.7%
Rent to Value Ratio

Active
$160,000
2
bds
|
3
ba
|
1,640
sqft
|
built
1984
6000 Reims Rd, Houston, TX 77036
$-264
Cash flow
-8.6%
Cash-on-Cash Return
3.7%
Cap rate
1.1%
Rent to Value Ratio
Active
$80,000
1
bds
|
1
ba
|
693
sqft
|
built
1979
6001 Reims Rd, Houston, TX 77036
$-72
Cash flow
-4.7%
Cash-on-Cash Return
4.6%
Cap rate
1.3%
Rent to Value Ratio
Active
$92,000
2
bds
|
1
ba
|
917
sqft
|
built
1979
6001 Reims Rd, Houston, TX 77036
$-168
Cash flow
-9.5%
Cash-on-Cash Return
3.5%
Cap rate
1.2%
Rent to Value Ratio

Active
$100,000
2
bds
|
1
ba
|
876
sqft
|
built
1977
6161 Reims Rd, Houston, TX 77036
$-51
Cash flow
-2.7%
Cash-on-Cash Return
5.1%
Cap rate
1.2%
Rent to Value Ratio
Active
$94,500
2
bds
|
1
ba
|
876
sqft
|
built
1977
6161 Reims Rd, Houston, TX 77036
$0
Cash flow
0.0%
Cash-on-Cash Return
5.7%
Cap rate
1.3%
Rent to Value Ratio

Active
$106,900
1
bds
|
1
ba
|
870
sqft
|
built
1982
8543 Sands Point Dr, Houston, TX 77036
$-158
Cash flow
-7.7%
Cash-on-Cash Return
3.9%
Cap rate
1.1%
Rent to Value Ratio
Active
$329,000
4
bds
|
2
ba
|
1,713
sqft
|
built
1969
8818 Roos Rd, Houston, TX 77036
$-543
Cash flow
-8.6%
Cash-on-Cash Return
3.7%
Cap rate
0.7%
Rent to Value Ratio
Active
$399,900
3
bds
|
2
ba
|
1,819
sqft
|
built
1965
8530 Roos Rd, Houston, TX 77036
$-994
Cash flow
-13.0%
Cash-on-Cash Return
2.7%
Cap rate
0.6%
Rent to Value Ratio