77048 Investment Properties for Sale
Browse homes for sale and investment properties in 77048. Refine your search by price, property type, or more.
Best cash flowing properties in 77048
Active
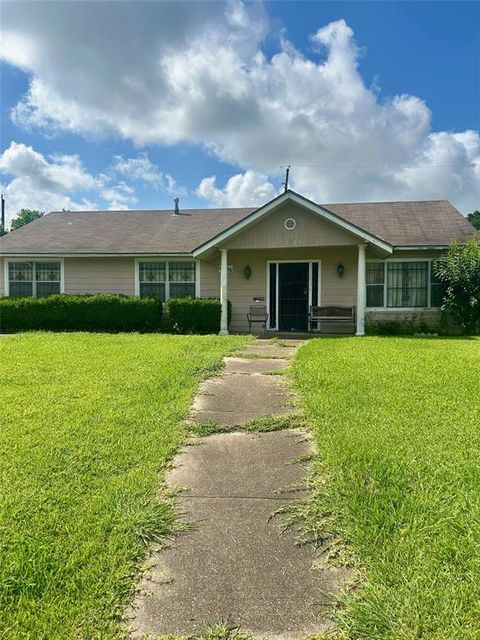
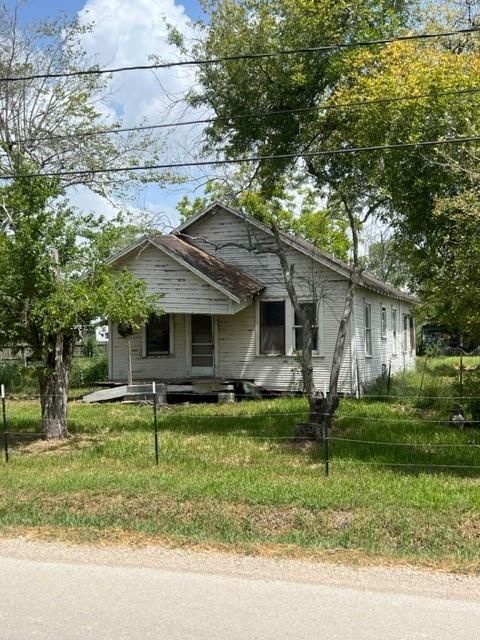
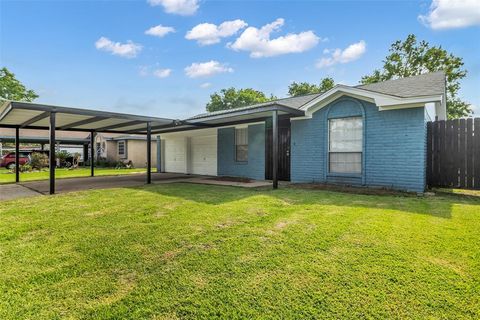
$169,999
3
bds
|
2
ba
|
2,040
sqft
|
built
1950
4906 Meadow Park Dr, Houston, TX 77048
$576
Cash flow
17.7%
Cash-on-Cash Return
9.7%
Cap rate
1.2%
Rent to Value Ratio

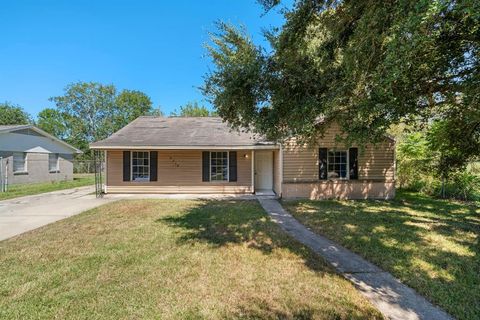
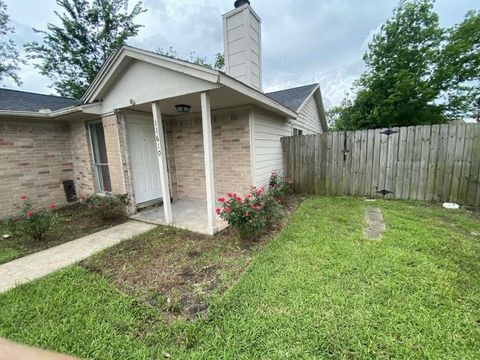
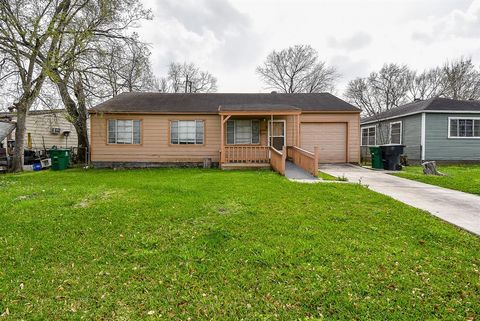
Active
$160,000
3
bds
|
3
ba
|
1,802
sqft
|
built
1971
11807 Martin Luther King Blvd, Houston, TX 77048
$347
Cash flow
11.3%
Cash-on-Cash Return
8.3%
Cap rate
1.0%
Rent to Value Ratio
41 out of 42 properties for sale in 77048
Limited Results Shown
Create a free account, or log in to reveal all property listings and enjoy the complete experience.
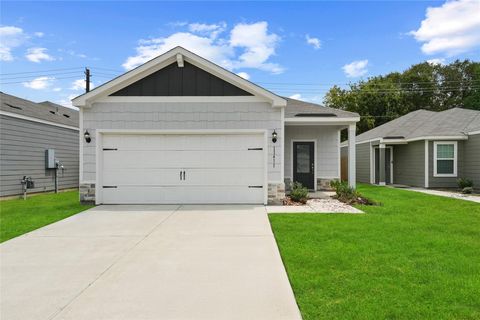
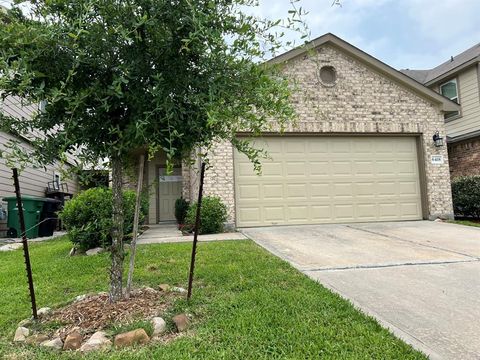
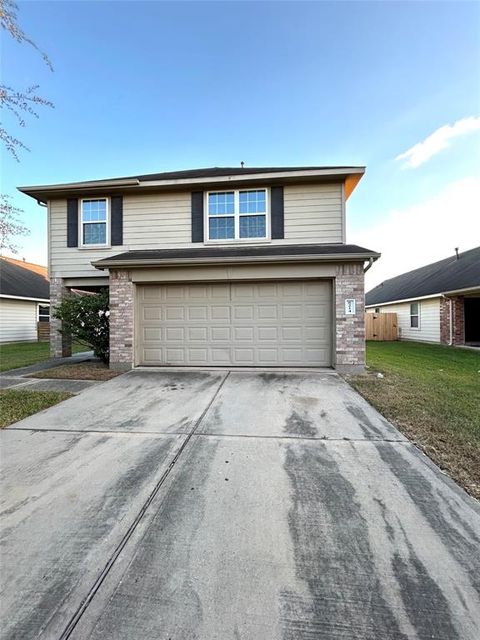
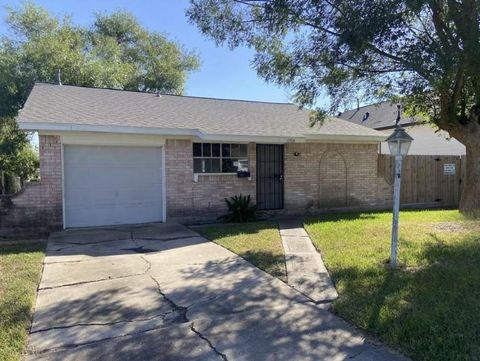
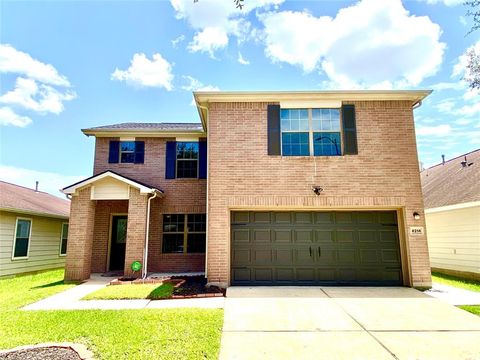
Active
$279,000
3
bds
|
2
ba
|
1,579
sqft
|
built
2023
11411 Bright Sun Dr, Houston, TX 77048
$-329
Cash flow
-6.2%
Cash-on-Cash Return
4.3%
Cap rate
0.8%
Rent to Value Ratio
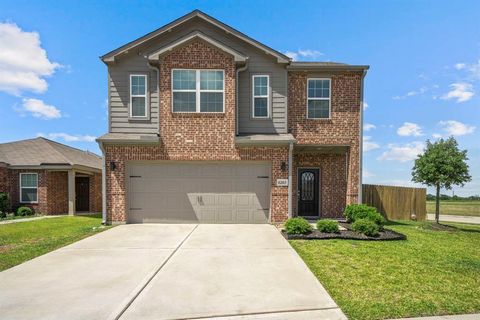
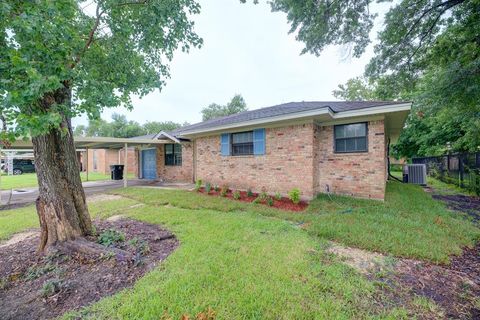
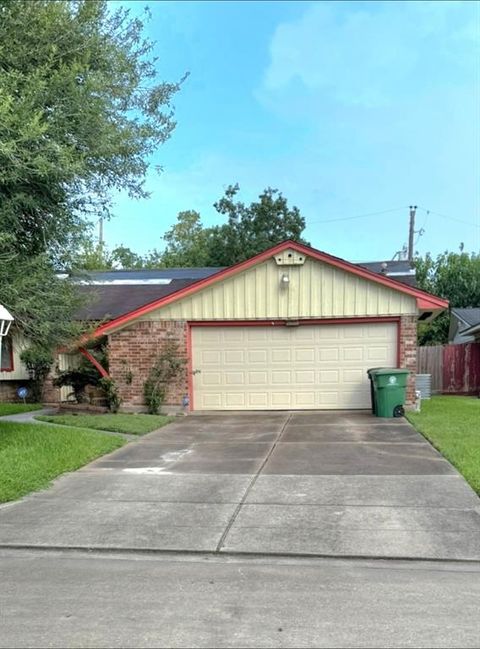
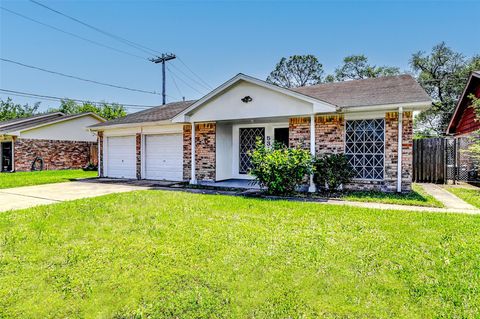
Active
$209,999
7
bds
|
3
ba
|
1,780
sqft
|
built
1970
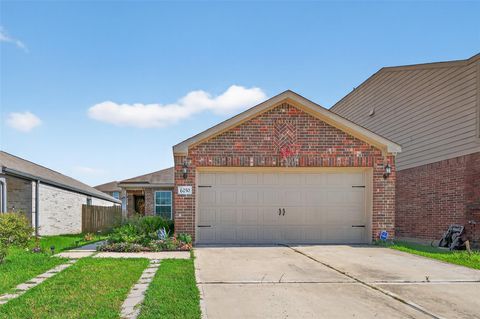
5319 Greylog Dr, Houston, TX 77048
$74
Cash flow
1.8%
Cash-on-Cash Return
6.1%
Cap rate
1.0%
Rent to Value Ratio
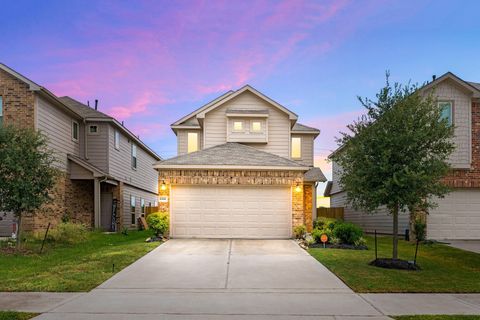
Active
$338,800
4
bds
|
3
ba
|
2,453
sqft
|
built
2019
6263 El Turquesa Dr, Houston, TX 77048
$-605
Cash flow
-9.3%
Cash-on-Cash Return
3.5%
Cap rate
0.7%
Rent to Value Ratio
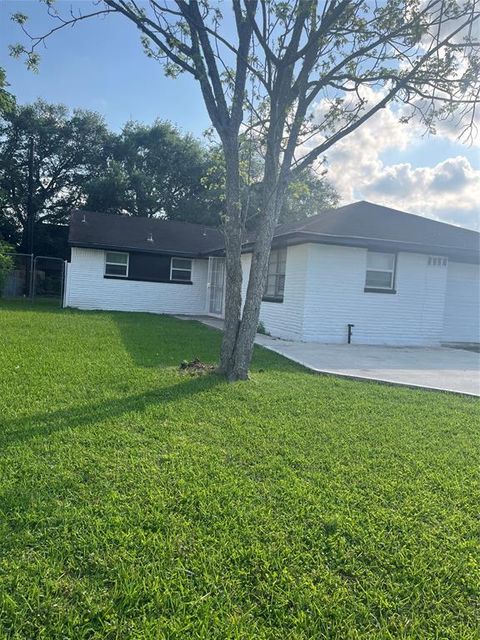
Active
$239,900
3
bds
|
2
ba
|
1,537
sqft
|
built
2019
6418 Macroom Meadows Ln, Houston, TX 77048
$-366
Cash flow
-8.0%
Cash-on-Cash Return
3.8%
Cap rate
0.8%
Rent to Value Ratio
Active
$245,000
3
bds
|
2
ba
|
1,846
sqft
|
built
1965
5535 Elm Springs Dr, Houston, TX 77048
$-260
Cash flow
-5.5%
Cash-on-Cash Return
4.4%
Cap rate
0.7%
Rent to Value Ratio
Active
$265,000
3
bds
|
3
ba
|
1,656
sqft
|
built
2021
6518 Macroom Meadows Ln, Houston, TX 77048
$-500
Cash flow
-9.8%
Cash-on-Cash Return
3.4%
Cap rate
0.8%
Rent to Value Ratio
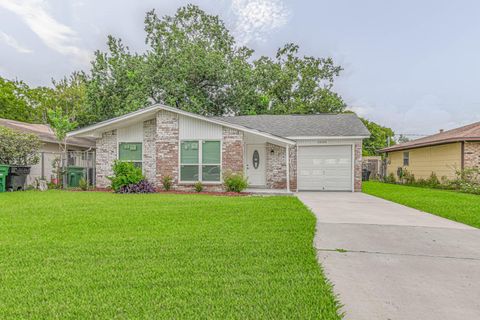
Active
$175,000
3
bds
|
2
ba
|
1,216
sqft
|
built
1961
5502 Elm Tree Dr, Houston, TX 77048
$43
Cash flow
1.3%
Cash-on-Cash Return
6.0%
Cap rate
0.9%
Rent to Value Ratio
Active
$189,500
3
bds
|
2
ba
|
1,271
sqft
|
built
1976
12211 Roandale Dr, Houston, TX 77048
$-49
Cash flow
-1.3%
Cash-on-Cash Return
5.4%
Cap rate
0.8%
Rent to Value Ratio
Active
$189,999
3
bds
|
2
ba
|
1,380
sqft
|
built
1965
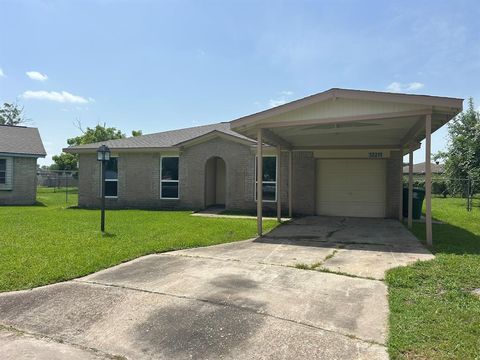
5023 Denoron Dr, Houston, TX 77048
$-46
Cash flow
-1.3%
Cash-on-Cash Return
5.4%
Cap rate
0.9%
Rent to Value Ratio
Active
$279,900
3
bds
|
3
ba
|
1,832
sqft
|
built
2021
6522 Macroom Meadows Ln, Houston, TX 77048
$-592
Cash flow
-11.0%
Cash-on-Cash Return
3.1%
Cap rate
0.7%
Rent to Value Ratio
Active
$264,999
3
bds
|
2
ba
|
1,663
sqft
|
built
1963
11614 Sandrock Dr, Houston, TX 77048
$-74
Cash flow
-1.5%
Cash-on-Cash Return
5.3%
Cap rate
0.8%
Rent to Value Ratio
Active
$265,000
3
bds
|
2
ba
|
1,754
sqft
|
built
1997
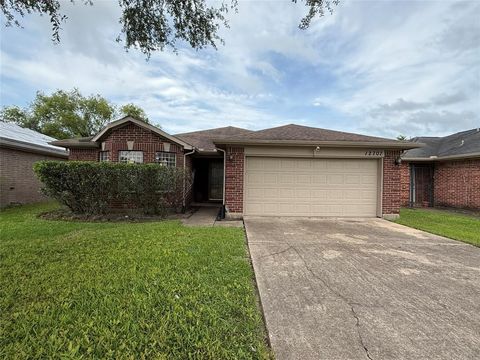
12707 Rockford Dr, Houston, TX 77048
$-156
Cash flow
-3.1%
Cash-on-Cash Return
5.0%
Cap rate
0.8%
Rent to Value Ratio
Active
$150,000
3
bds
|
2
ba
|
1,565
sqft
|
built
1963
11302 Murr Way, Houston, TX 77048
$281
Cash flow
9.8%
Cash-on-Cash Return
7.9%
Cap rate
1.1%
Rent to Value Ratio
Active
$219,990
3
bds
|
2
ba
|
1,352
sqft
|
built
2019
6250 El Topacio Dr, Houston, TX 77048
$-355
Cash flow
-8.4%
Cash-on-Cash Return
3.7%
Cap rate
0.8%
Rent to Value Ratio
Active
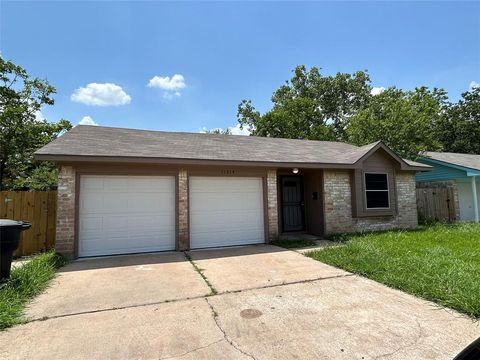
$265,000
4
bds
|
2
ba
|
1,724
sqft
|
built
1964
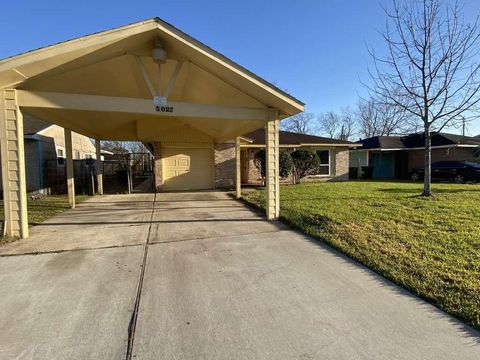
5102 Tavenor Ln, Houston, TX 77048
$-405
Cash flow
-8.0%
Cash-on-Cash Return
3.8%
Cap rate
0.7%
Rent to Value Ratio
Active
$195,000
3
bds
|
2
ba
|
1,250
sqft
|
built
1975
11814 Bay Cedar Dr, Houston, TX 77048
$35
Cash flow
0.9%
Cash-on-Cash Return
5.9%
Cap rate
0.9%
Rent to Value Ratio
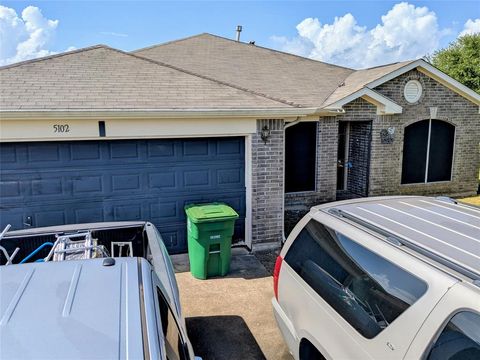
Active
$230,000
4
bds
|
2
ba
|
1,904
sqft
|
built
2007
5102 Park Village Dr, Houston, TX 77048
$-118
Cash flow
-2.7%
Cash-on-Cash Return
5.1%
Cap rate
0.9%
Rent to Value Ratio
Active
$210,000
3
bds
|
2
ba
|
1,671
sqft
|
built
1964
11719 Murr Way, Houston, TX 77048
$-39
Cash flow
-1.0%
Cash-on-Cash Return
5.5%
Cap rate
0.9%
Rent to Value Ratio
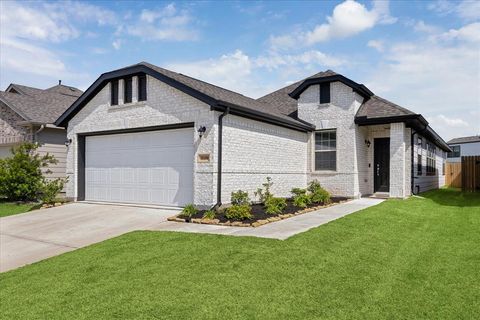
Active
$295,000
3
bds
|
3
ba
|
1,881
sqft
|
built
2023
11404 Bright Sun Dr, Houston, TX 77048
$-425
Cash flow
-7.5%
Cash-on-Cash Return
3.9%
Cap rate
0.8%
Rent to Value Ratio
Active
$225,000
3
bds
|
3
ba
|
1,824
sqft
|
built
2014
6214 El Granate Dr, Houston, TX 77048
$-257
Cash flow
-6.0%
Cash-on-Cash Return
4.3%
Cap rate
0.9%
Rent to Value Ratio
Active
$239,000
3
bds
|
2
ba
|
1,344
sqft
|
built
1965
5003 Denoron Dr, Houston, TX 77048
$-435
Cash flow
-9.5%
Cash-on-Cash Return
3.5%
Cap rate
0.6%
Rent to Value Ratio
Active
$304,000
3
bds
|
2
ba
|
1,790
sqft
|
built
2023
5339 Basquiat Dr, Houston, TX 77048
$-723
Cash flow
-12.4%
Cash-on-Cash Return
2.8%
Cap rate
0.7%
Rent to Value Ratio
Active
$205,000
3
bds
|
2
ba
|
1,429
sqft
|
built
1971
11750 Murr Way, Houston, TX 77048
$-126
Cash flow
-3.2%
Cash-on-Cash Return
4.9%
Cap rate
0.8%
Rent to Value Ratio
Active
$313,999
4
bds
|
3
ba
|
2,391
sqft
|
built
2023
11407 Prairie Walk Dr, Houston, TX 77048
$-361
Cash flow
-6.0%
Cash-on-Cash Return
4.3%
Cap rate
0.9%
Rent to Value Ratio
Active
$249,999
3
bds
|
2
ba
|
1,467
sqft
|
built
2021
11608 Moonstruck Ln, Houston, TX 77048
$-437
Cash flow
-9.1%
Cash-on-Cash Return
3.6%
Cap rate
0.8%
Rent to Value Ratio
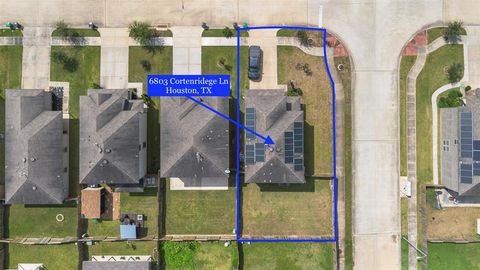
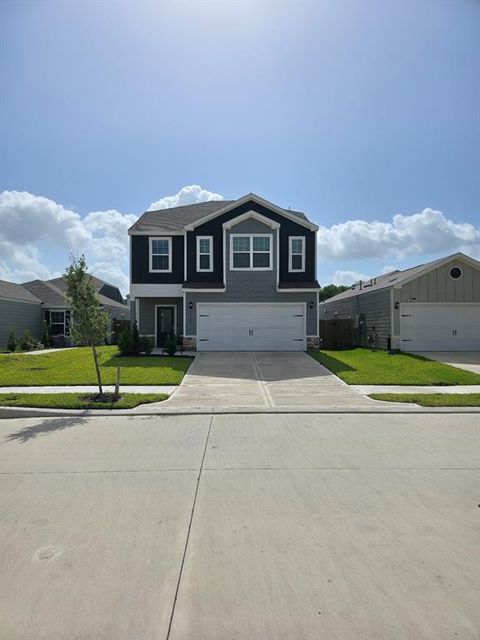
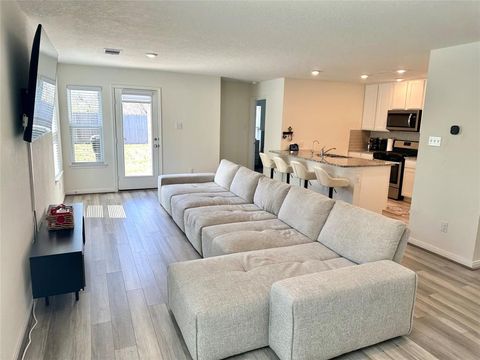
Active
$279,000
3
bds
|
3
ba
|
2,085
sqft
|
built
2017
6803 Cortenridge Ln, Houston, TX 77048
$-450
Cash flow
-8.4%
Cash-on-Cash Return
3.7%
Cap rate
0.8%
Rent to Value Ratio
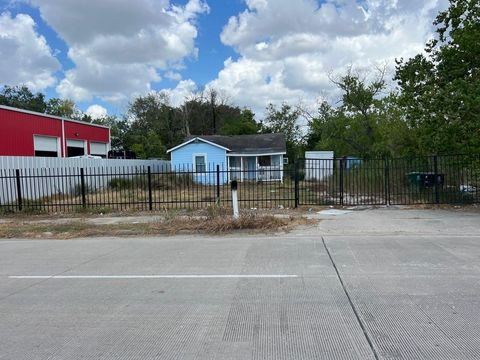
Active
$259,900
2
bds
|
1
ba
|
784
sqft
|
built
1940
6513 Airport Blvd, Houston, TX 77048
$-529
Cash flow
-10.6%
Cash-on-Cash Return
3.2%
Cap rate
0.5%
Rent to Value Ratio
Active
$399,000
2
bds
|
1
ba
|
960
sqft
|
built
1940
4905 Fuqua St, Houston, TX 77048
$-1,227
Cash flow
-16.0%
Cash-on-Cash Return
2.0%
Cap rate
0.4%
Rent to Value Ratio
Active
$191,999
3
bds
|
2
ba
|
1,336
sqft
|
built
1983
11610 Roandale Dr, Houston, TX 77048
$53
Cash flow
1.4%
Cash-on-Cash Return
6.0%
Cap rate
0.9%
Rent to Value Ratio
Active
$179,999
3
bds
|
2
ba
|
1,149
sqft
|
built
1963
11503 Bay Cedar Dr, Houston, TX 77048
$4
Cash flow
0.1%
Cash-on-Cash Return
5.7%
Cap rate
0.9%
Rent to Value Ratio
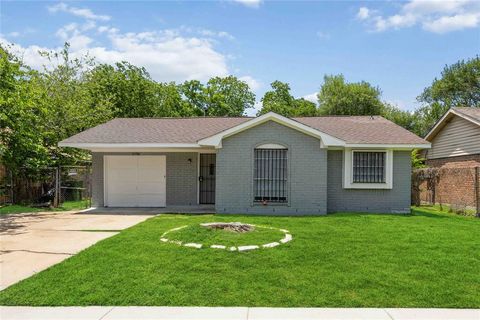
Active
$135,000
3
bds
|
2
ba
|
1,192
sqft
|
built
1960
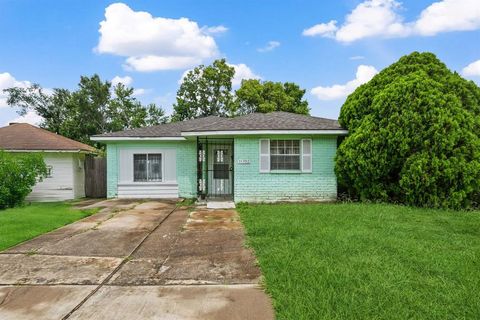
5150 Howcher St, Houston, TX 77048
$263
Cash flow
10.2%
Cash-on-Cash Return
8.0%
Cap rate
1.2%
Rent to Value Ratio

Active
$315,200
3
bds
|
2
ba
|
1,405
sqft
|
built
2021
5602 Giving Grace Way, Houston, TX 77048
$-579
Cash flow
-9.6%
Cash-on-Cash Return
3.5%
Cap rate
0.7%
Rent to Value Ratio
Active
$234,900
3
bds
|
2
ba
|
1,250
sqft
|
built
1974
12127 Redfern Dr, Houston, TX 77048
$-274
Cash flow
-6.1%
Cash-on-Cash Return
4.3%
Cap rate
0.7%
Rent to Value Ratio
Active
$125,000
3
bds
|
1
ba
|
924
sqft
|
built
1955
4814 Scenic Dr, Houston, TX 77048
$198
Cash flow
8.3%
Cash-on-Cash Return
7.6%
Cap rate
1.2%
Rent to Value Ratio
Active
$279,900
3
bds
|
3
ba
|
2,380
sqft
|
built
2006
4214 Landshire Bend Dr, Houston, TX 77048
$-245
Cash flow
-4.6%
Cash-on-Cash Return
4.6%
Cap rate
0.9%
Rent to Value Ratio
Active
$198,500
4
bds
|
2
ba
|
1,544
sqft
|
built
1966
5318 Botany Ln, Houston, TX 77048
$303
Cash flow
8.0%
Cash-on-Cash Return
7.5%
Cap rate
0.9%
Rent to Value Ratio
Active
$199,000
3
bds
|
2
ba
|
1,290
sqft
|
built
1982
12818 Redfern Dr, Houston, TX 77048
$17
Cash flow
0.4%
Cash-on-Cash Return
5.8%
Cap rate
0.9%
Rent to Value Ratio
Active
$245,000
3
bds
|
2
ba
|
1,244
sqft
|
built
2017
6806 Brimridge Ln, Houston, TX 77048
$-523
Cash flow
-11.1%
Cash-on-Cash Return
3.1%
Cap rate
0.7%
Rent to Value Ratio