77057 Investment Properties for Sale
Browse homes for sale and investment properties in 77057. Refine your search by price, property type, or more.
Best cash flowing properties in 77057
Active
$65,000
1
bds
|
1
ba
|
664
sqft
|
built
1969
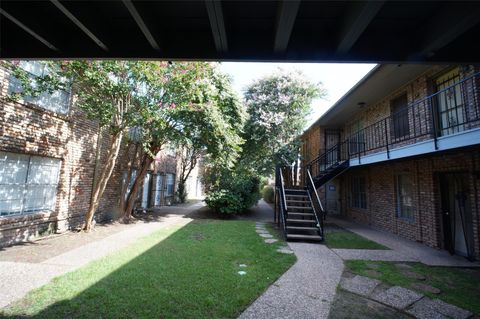
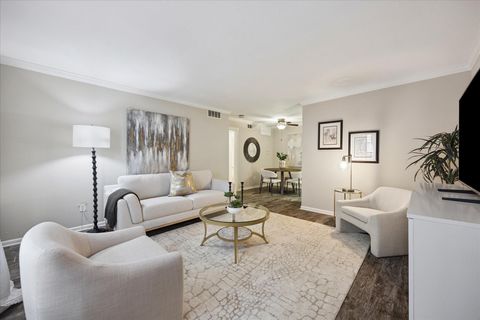
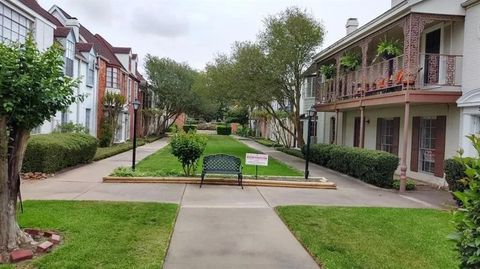
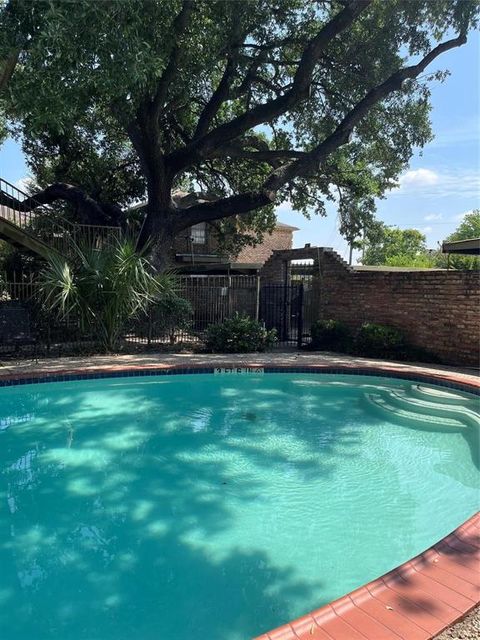
6401 Skyline Dr, Houston, TX 77057
$397
Cash flow
7.1%
Cash-on-Cash Return
7.3%
Cap rate
1.8%
Rent to Value Ratio

Active
$74,000
1
bds
|
1
ba
|
706
sqft
|
built
1965
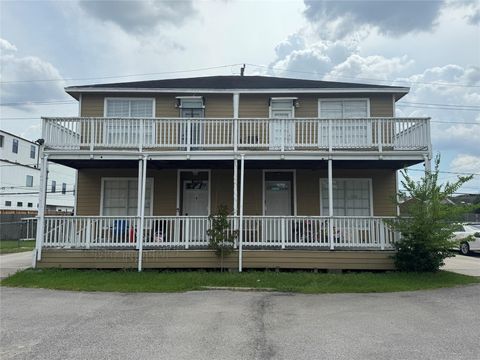
2824 Briarhurst Dr, Houston, TX 77057
$280
Cash flow
4.4%
Cash-on-Cash Return
4.5%
Cap rate
1.5%
Rent to Value Ratio
128 out of 145 properties for sale in 77057
Limited Results Shown
Create a free account, or log in to reveal all property listings and enjoy the complete experience.
Active
$110,000
1
bds
|
1
ba
|
678
sqft
|
built
1978
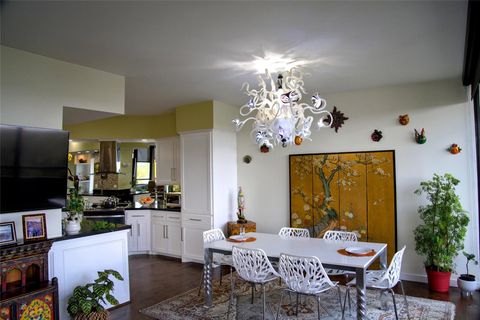
2350 Bering Dr, Houston, TX 77057
$17
Cash flow
0.8%
Cash-on-Cash Return
5.9%
Cap rate
1.1%
Rent to Value Ratio

Active
$330,000
3
bds
|
3
ba
|
2,115
sqft
|
built
1980
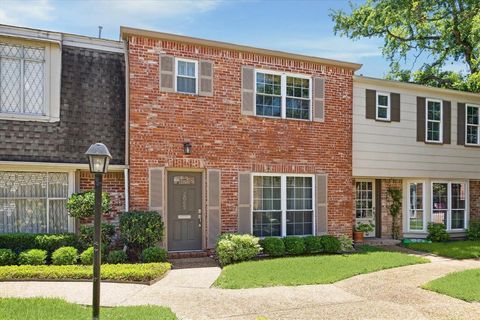
661 Bering Dr, Houston, TX 77057
$-2,375
Cash flow
-37.5%
Cash-on-Cash Return
-3.0%
Cap rate
0.7%
Rent to Value Ratio
Active
$314,999
2
bds
|
3
ba
|
1,666
sqft
|
built
2001
1616 Fountain View Dr, Houston, TX 77057
$-1,468
Cash flow
-24.3%
Cash-on-Cash Return
0.1%
Cap rate
0.7%
Rent to Value Ratio

Active
$789,000
3
bds
|
4
ba
|
3,529
sqft
|
built
2007
2217 Nantucket Dr, Houston, TX 77057
$-1,281
Cash flow
-8.5%
Cash-on-Cash Return
3.7%
Cap rate
0.7%
Rent to Value Ratio
Active
$120,000
1
bds
|
1
ba
|
660
sqft
|
built
1968
2121 Fountain View Dr, Houston, TX 77057
$-126
Cash flow
-5.5%
Cash-on-Cash Return
4.4%
Cap rate
1.1%
Rent to Value Ratio

Active
$244,000
2
bds
|
2
ba
|
1,640
sqft
|
built
1979
2512 Bering Dr, Houston, TX 77057
$-399
Cash flow
-8.5%
Cash-on-Cash Return
3.7%
Cap rate
0.7%
Rent to Value Ratio

Active
$135,000
1
bds
|
1
ba
|
818
sqft
|
built
1963
2727 Briarhurst Dr, Houston, TX 77057
$-331
Cash flow
-12.8%
Cash-on-Cash Return
2.7%
Cap rate
1.0%
Rent to Value Ratio
Active
$91,500
1
bds
|
1
ba
|
788
sqft
|
built
1965
2503 Marilee Ln, Houston, TX 77057
$-229
Cash flow
-13.1%
Cash-on-Cash Return
2.7%
Cap rate
1.4%
Rent to Value Ratio

Active
$275,000
2
bds
|
3
ba
|
1,088
sqft
|
built
1977
2323 Augusta Dr, Houston, TX 77057
$-573
Cash flow
-10.9%
Cash-on-Cash Return
3.2%
Cap rate
0.7%
Rent to Value Ratio

Active
$139,000
1
bds
|
1
ba
|
995
sqft
|
built
1978
1818 Augusta Dr, Houston, TX 77057
$-505
Cash flow
-19.0%
Cash-on-Cash Return
1.3%
Cap rate
1.0%
Rent to Value Ratio
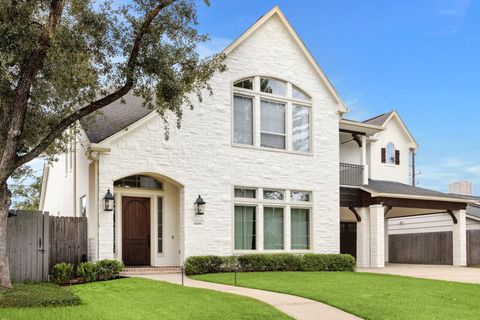
Active
$2,300,000
3
bds
|
3
ba
|
15,349
sqft
|
built
1970
5621 Val Verde St, Houston, TX 77057
$-12,030
Cash flow
-27.3%
Cash-on-Cash Return
-0.6%
Cap rate
0.1%
Rent to Value Ratio
Active
$479,000
3
bds
|
3
ba
|
2,169
sqft
|
built
1981
1111 Bering Dr, Houston, TX 77057
$-2,708
Cash flow
-29.5%
Cash-on-Cash Return
-1.1%
Cap rate
0.8%
Rent to Value Ratio
Active
$235,000
3
bds
|
3
ba
|
1,640
sqft
|
built
1970
2065 Winrock Blvd, Houston, TX 77057
$-645
Cash flow
-14.3%
Cash-on-Cash Return
2.4%
Cap rate
0.9%
Rent to Value Ratio
Active
$190,000
2
bds
|
2
ba
|
1,347
sqft
|
built
1968
2101 Fountain View Dr, Houston, TX 77057
$-634
Cash flow
-17.4%
Cash-on-Cash Return
1.7%
Cap rate
0.9%
Rent to Value Ratio

Active
$357,500
3
bds
|
3
ba
|
1,722
sqft
|
built
1975
5823 Valley Forge Dr, Houston, TX 77057
$-1,037
Cash flow
-15.1%
Cash-on-Cash Return
2.2%
Cap rate
0.7%
Rent to Value Ratio
Active
$5,995,000
6
bds
|
7
ba
|
9,280
sqft
|
built
2016
311 Brown Saddle St, Houston, TX 77057
$-25,576
Cash flow
-22.3%
Cash-on-Cash Return
0.6%
Cap rate
0.1%
Rent to Value Ratio

Active
$282,000
2
bds
|
2
ba
|
1,823
sqft
|
built
1979
1114 Augusta Dr, Houston, TX 77057
$-638
Cash flow
-11.8%
Cash-on-Cash Return
3.0%
Cap rate
0.8%
Rent to Value Ratio

Active
$220,000
2
bds
|
2
ba
|
1,177
sqft
|
built
1978
1201 Bering Dr, Houston, TX 77057
$-512
Cash flow
-12.1%
Cash-on-Cash Return
2.9%
Cap rate
0.9%
Rent to Value Ratio
Active
$208,500
2
bds
|
3
ba
|
1,480
sqft
|
built
1970
6354 Del Monte Dr, Houston, TX 77057
$-604
Cash flow
-15.1%
Cash-on-Cash Return
2.2%
Cap rate
1.0%
Rent to Value Ratio
Active
$888,000
4
bds
|
5
ba
|
4,695
sqft
|
built
1994
1211 Nantucket Dr, Houston, TX 77057
$-2,182
Cash flow
-12.8%
Cash-on-Cash Return
2.7%
Cap rate
0.7%
Rent to Value Ratio

Active
$219,000
2
bds
|
2
ba
|
1,932
sqft
|
built
1964
2711 Briarhurst Dr, Houston, TX 77057
$-968
Cash flow
-23.1%
Cash-on-Cash Return
0.4%
Cap rate
0.9%
Rent to Value Ratio
Active
$2,225,000
4
bds
|
5
ba
|
4,612
sqft
|
built
2006
6206 Piping Rock Ln, Houston, TX 77057
$-8,443
Cash flow
-19.8%
Cash-on-Cash Return
1.1%
Cap rate
0.3%
Rent to Value Ratio
Active
$147,000
2
bds
|
1
ba
|
909
sqft
|
built
1976
1100 Augusta Dr, Houston, TX 77057
$-355
Cash flow
-12.6%
Cash-on-Cash Return
2.8%
Cap rate
1.0%
Rent to Value Ratio

Active
$135,000
2
bds
|
1
ba
|
909
sqft
|
built
1977
5711 Sugar Hill Dr, Houston, TX 77057
$-279
Cash flow
-10.8%
Cash-on-Cash Return
3.2%
Cap rate
1.2%
Rent to Value Ratio

Active
$118,500
1
bds
|
1
ba
|
680
sqft
|
built
1970
6402 Del Monte Dr, Houston, TX 77057
$-323
Cash flow
-14.2%
Cash-on-Cash Return
2.4%
Cap rate
1.0%
Rent to Value Ratio

Active
$255,000
3
bds
|
3
ba
|
1,935
sqft
|
built
1979
2588 Bering Dr, Houston, TX 77057
$-629
Cash flow
-12.9%
Cash-on-Cash Return
2.7%
Cap rate
1.0%
Rent to Value Ratio
Active
$259,000
2
bds
|
3
ba
|
1,616
sqft
|
built
1978
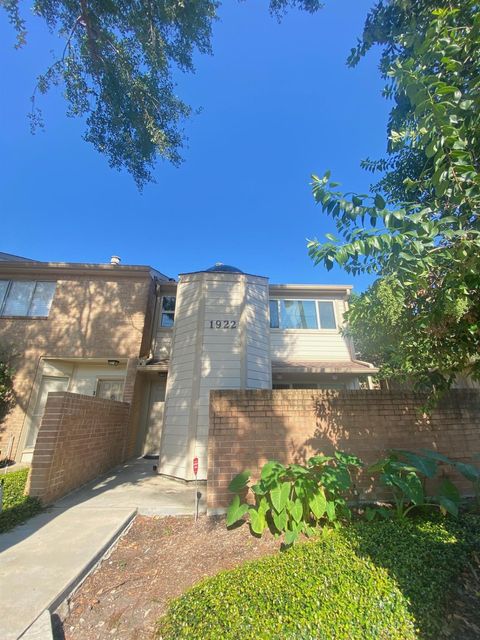
1922 Augusta Dr, Houston, TX 77057
$-605
Cash flow
-12.2%
Cash-on-Cash Return
2.9%
Cap rate
0.8%
Rent to Value Ratio

Active
$389,000
2
bds
|
2
ba
|
1,506
sqft
|
built
1981
1111 Bering Dr, Houston, TX 77057
$-2,184
Cash flow
-29.3%
Cash-on-Cash Return
-1.1%
Cap rate
0.6%
Rent to Value Ratio

Active
$135,000
2
bds
|
2
ba
|
989
sqft
|
built
1960
2574 Marilee Ln, Houston, TX 77057
$-310
Cash flow
-12.0%
Cash-on-Cash Return
2.9%
Cap rate
1.2%
Rent to Value Ratio

Active
$219,000
2
bds
|
2
ba
|
1,173
sqft
|
built
1978
1201 Bering Dr, Houston, TX 77057
$-641
Cash flow
-15.3%
Cash-on-Cash Return
2.2%
Cap rate
0.8%
Rent to Value Ratio

Active
$275,000
2
bds
|
3
ba
|
1,616
sqft
|
built
1978
2014 Augusta Dr, Houston, TX 77057
$-708
Cash flow
-13.4%
Cash-on-Cash Return
2.6%
Cap rate
0.8%
Rent to Value Ratio

Active
$1,150,000
3
bds
|
3
ba
|
4,219
sqft
|
built
1991
311 Indian Byu, Houston, TX 77057
$-3,537
Cash flow
-16.0%
Cash-on-Cash Return
2.0%
Cap rate
0.4%
Rent to Value Ratio
Active
$260,000
2
bds
|
3
ba
|
1,613
sqft
|
built
1981
2444 Bering Dr, Houston, TX 77057
$-631
Cash flow
-12.7%
Cash-on-Cash Return
2.8%
Cap rate
0.8%
Rent to Value Ratio
Active
$100,000
3
bds
|
1
ba
|
911
sqft
|
built
1969
6401 Skyline Dr, Houston, TX 77057
$-84
Cash flow
-4.4%
Cash-on-Cash Return
4.7%
Cap rate
1.4%
Rent to Value Ratio

Active
$235,000
2
bds
|
2
ba
|
1,173
sqft
|
built
1978
1201 Bering Dr, Houston, TX 77057
$-529
Cash flow
-11.7%
Cash-on-Cash Return
3.0%
Cap rate
0.9%
Rent to Value Ratio
Active
$185,000
2
bds
|
2
ba
|
1,028
sqft
|
built
1978
2300 Augusta Dr, Houston, TX 77057
$-280
Cash flow
-7.9%
Cash-on-Cash Return
3.9%
Cap rate
1.0%
Rent to Value Ratio
Active
$355,000
3
bds
|
4
ba
|
2,532
sqft
|
built
2009
3426 Skyline Village Dr, Houston, TX 77057
$-526
Cash flow
-7.7%
Cash-on-Cash Return
3.9%
Cap rate
0.8%
Rent to Value Ratio

Active
$469,900
3
bds
|
4
ba
|
2,275
sqft
|
built
2021
5841 Dolores St, Houston, TX 77057
$-914
Cash flow
-10.1%
Cash-on-Cash Return
3.3%
Cap rate
0.7%
Rent to Value Ratio