77059 Investment Properties for Sale
Browse homes for sale and investment properties in 77059. Refine your search by price, property type, or more.
Best cash flowing properties in 77059
Active
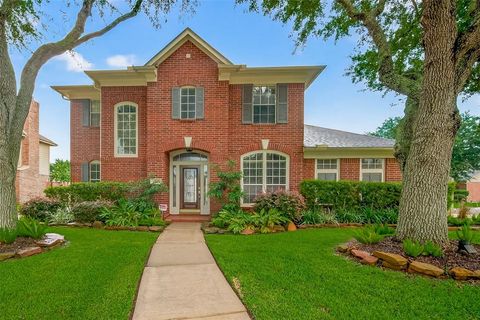
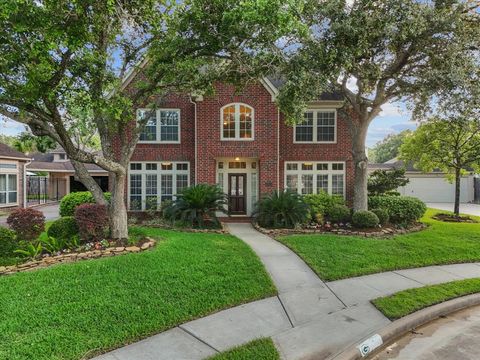
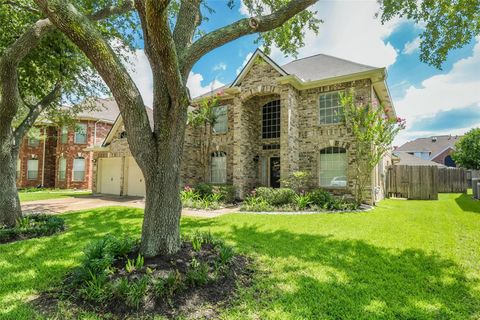
$450,000
5
bds
|
4
ba
|
3,428
sqft
|
built
1998
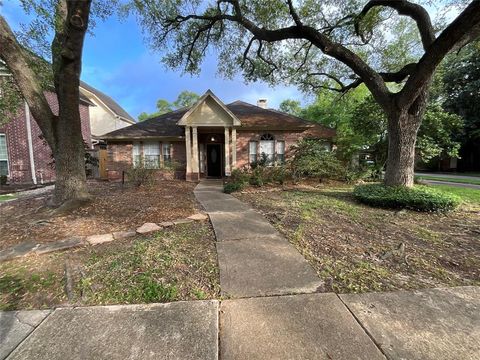
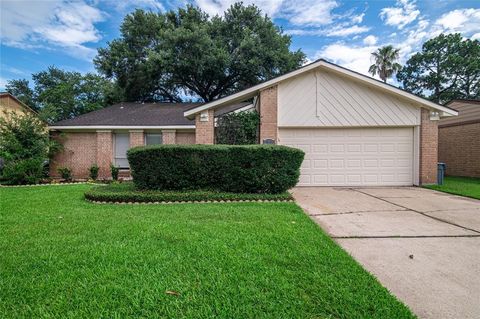
4103 Oak Blossom Ct, Houston, TX 77059
$166
Cash flow
1.9%
Cash-on-Cash Return
6.1%
Cap rate
0.8%
Rent to Value Ratio
Active
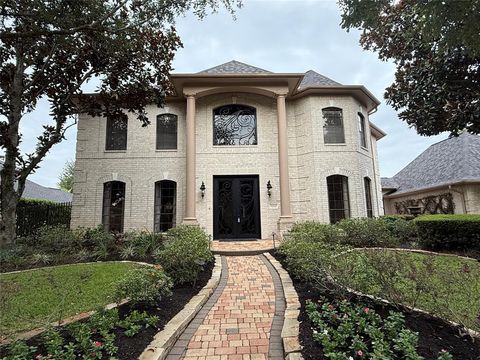
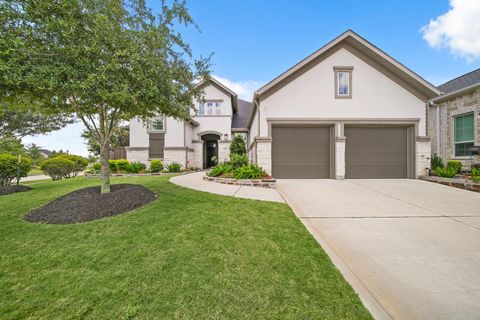
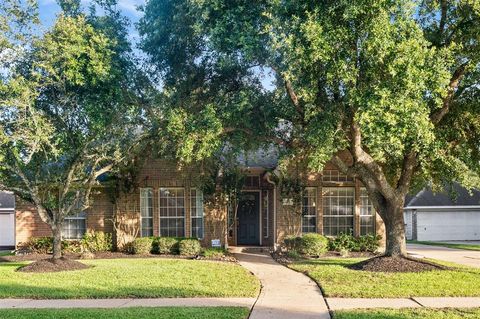
$609,500
5
bds
|
4
ba
|
4,210
sqft
|
built
1995
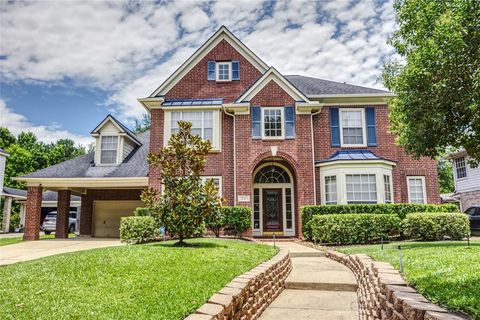
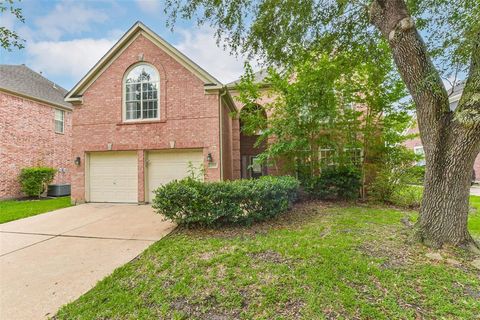
3419 Scenic Elm St, Houston, TX 77059
$-155
Cash flow
-1.3%
Cash-on-Cash Return
5.4%
Cap rate
0.7%
Rent to Value Ratio
54 out of 54 properties for sale in 77059
Limited Results Shown
Create a free account, or log in to reveal all property listings and enjoy the complete experience.
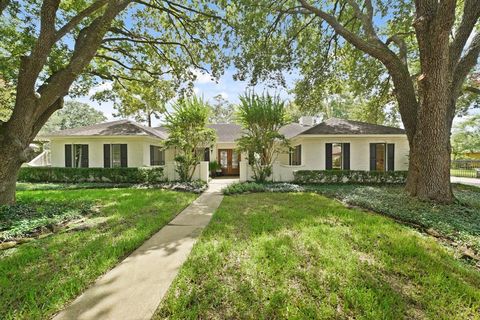
Active
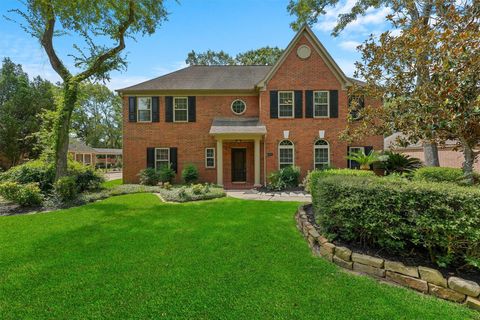
$399,000
4
bds
|
4
ba
|
2,757
sqft
|
built
1992
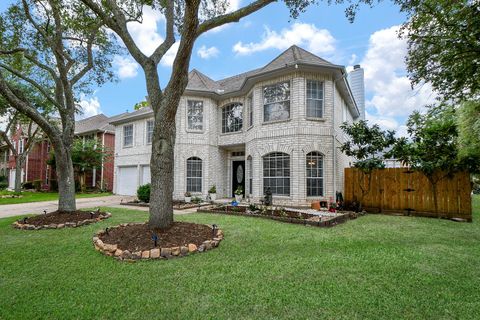
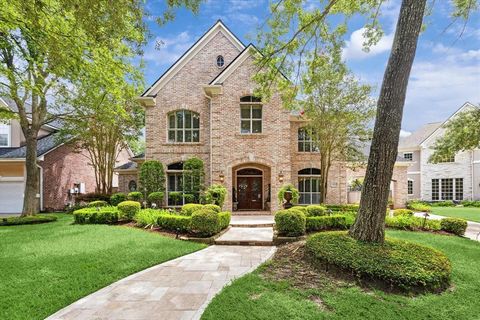
13819 Marbledale Ct, Houston, TX 77059
$-639
Cash flow
-8.4%
Cash-on-Cash Return
3.8%
Cap rate
0.7%
Rent to Value Ratio
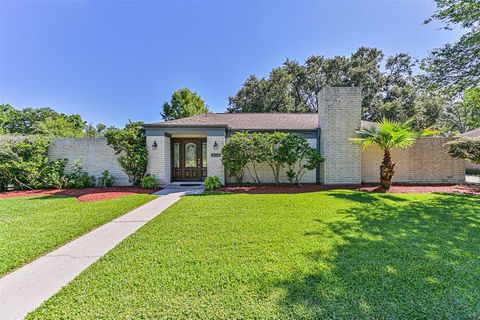
Active
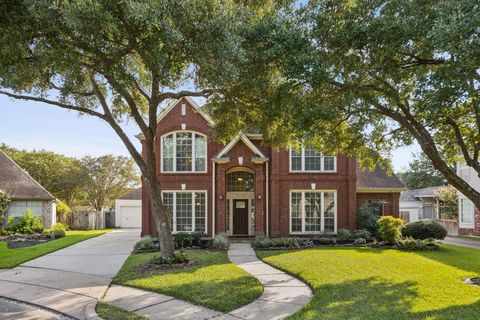
$545,000
4
bds
|
4
ba
|
3,695
sqft
|
built
2002
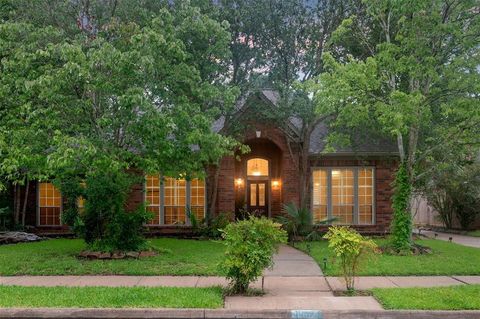
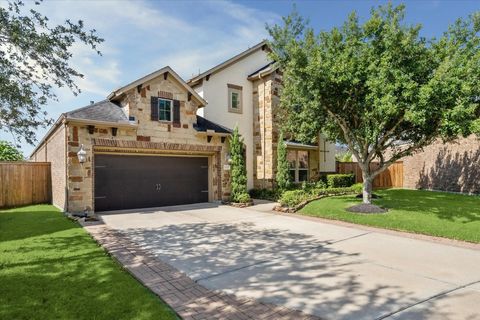
4815 N Pine Brook Way, Houston, TX 77059
$-1,294
Cash flow
-12.4%
Cash-on-Cash Return
2.8%
Cap rate
0.6%
Rent to Value Ratio
Active
$400,000
4
bds
|
3
ba
|
2,446
sqft
|
built
1997
13227 Golden Field Dr, Houston, TX 77059
$-938
Cash flow
-12.2%
Cash-on-Cash Return
2.9%
Cap rate
0.6%
Rent to Value Ratio

Active
$485,000
5
bds
|
4
ba
|
3,276
sqft
|
built
1996
3222 Mossy Elm Ct, Houston, TX 77059
$-994
Cash flow
-10.7%
Cash-on-Cash Return
3.2%
Cap rate
0.6%
Rent to Value Ratio
Active
$995,000
5
bds
|
5
ba
|
4,548
sqft
|
built
1998
3014 Acorn Wood Way, Houston, TX 77059
$-3,193
Cash flow
-16.7%
Cash-on-Cash Return
1.8%
Cap rate
0.4%
Rent to Value Ratio
Active
$479,999
4
bds
|
3
ba
|
3,194
sqft
|
built
1979
15722 Falmouth Dr, Houston, TX 77059
$-819
Cash flow
-8.9%
Cash-on-Cash Return
3.6%
Cap rate
0.7%
Rent to Value Ratio

Active
$749,000
4
bds
|
4
ba
|
4,069
sqft
|
built
1996
15415 Parkwood Way, Houston, TX 77059
$-1,756
Cash flow
-12.2%
Cash-on-Cash Return
2.9%
Cap rate
0.6%
Rent to Value Ratio
Active
$349,000
4
bds
|
2
ba
|
2,476
sqft
|
built
1976
16358 Havenpark Ct, Houston, TX 77059
$-550
Cash flow
-8.2%
Cash-on-Cash Return
3.8%
Cap rate
0.7%
Rent to Value Ratio
Active
$498,000
5
bds
|
4
ba
|
3,241
sqft
|
built
2002
4802 N Pine Brook Way, Houston, TX 77059
$-1,213
Cash flow
-12.7%
Cash-on-Cash Return
2.8%
Cap rate
0.6%
Rent to Value Ratio
Active
$585,000
5
bds
|
4
ba
|
4,056
sqft
|
built
1995
3423 Scenic Elm St, Houston, TX 77059
$-1,482
Cash flow
-13.2%
Cash-on-Cash Return
2.6%
Cap rate
0.6%
Rent to Value Ratio
Active
$589,000
4
bds
|
4
ba
|
3,355
sqft
|
built
1993
3207 Scenic Elm St, Houston, TX 77059
$-1,621
Cash flow
-14.4%
Cash-on-Cash Return
2.4%
Cap rate
0.6%
Rent to Value Ratio
Active
$530,000
5
bds
|
4
ba
|
3,960
sqft
|
built
2002
4619 Jade Green Ct, Houston, TX 77059
$-1,161
Cash flow
-11.4%
Cash-on-Cash Return
3.0%
Cap rate
0.7%
Rent to Value Ratio
Active
$372,500
4
bds
|
3
ba
|
2,535
sqft
|
built
1990
11722 Orchard Mountain Dr, Houston, TX 77059
$-713
Cash flow
-10.0%
Cash-on-Cash Return
3.4%
Cap rate
0.8%
Rent to Value Ratio
Active
$563,000
4
bds
|
4
ba
|
3,885
sqft
|
built
1996
3718 W Pine Brook Way, Houston, TX 77059
$-1,373
Cash flow
-12.7%
Cash-on-Cash Return
2.8%
Cap rate
0.6%
Rent to Value Ratio
Active
$509,900
5
bds
|
3
ba
|
3,243
sqft
|
built
1996
3151 Mossy Elm Ct, Houston, TX 77059
$-1,092
Cash flow
-11.2%
Cash-on-Cash Return
3.1%
Cap rate
0.6%
Rent to Value Ratio
Active
$430,000
4
bds
|
3
ba
|
2,844
sqft
|
built
1993
11603 Orchard Mountain Dr, Houston, TX 77059
$-899
Cash flow
-10.9%
Cash-on-Cash Return
3.2%
Cap rate
0.7%
Rent to Value Ratio
Active
$479,000
4
bds
|
3
ba
|
2,811
sqft
|
built
1991
4407 Island Hills Dr, Houston, TX 77059
$-1,153
Cash flow
-12.6%
Cash-on-Cash Return
2.8%
Cap rate
0.6%
Rent to Value Ratio
Active
$525,000
5
bds
|
3
ba
|
2,919
sqft
|
built
1995
3219 Almond Creek Dr, Houston, TX 77059
$-1,103
Cash flow
-11.0%
Cash-on-Cash Return
3.2%
Cap rate
0.6%
Rent to Value Ratio
Active
$549,999
5
bds
|
4
ba
|
3,600
sqft
|
built
1996
16910 Cottonwood Way, Houston, TX 77059
$-1,240
Cash flow
-11.8%
Cash-on-Cash Return
3.0%
Cap rate
0.6%
Rent to Value Ratio
Active
$500,000
3
bds
|
3
ba
|
2,438
sqft
|
built
2018
13234 James Terrace Ln, Houston, TX 77059
$-1,732
Cash flow
-18.1%
Cash-on-Cash Return
1.5%
Cap rate
0.6%
Rent to Value Ratio
Active
$364,999
4
bds
|
2
ba
|
2,379
sqft
|
built
1977
15706 Dunmoor Dr, Houston, TX 77059
$-657
Cash flow
-9.4%
Cash-on-Cash Return
3.5%
Cap rate
0.7%
Rent to Value Ratio
Active
$405,000
4
bds
|
2
ba
|
2,533
sqft
|
built
1993
2806 Village Dale Ave, Houston, TX 77059
$-1,002
Cash flow
-12.9%
Cash-on-Cash Return
2.7%
Cap rate
0.6%
Rent to Value Ratio
Active
$659,900
4
bds
|
4
ba
|
3,784
sqft
|
built
2017
14062 Dunsmore Landing Dr, Houston, TX 77059
$-2,285
Cash flow
-18.1%
Cash-on-Cash Return
1.5%
Cap rate
0.5%
Rent to Value Ratio
Active
$599,900
5
bds
|
4
ba
|
4,285
sqft
|
built
1999
4410 Towering Oak Ct, Houston, TX 77059
$-1,647
Cash flow
-14.3%
Cash-on-Cash Return
2.4%
Cap rate
0.6%
Rent to Value Ratio
Active
$534,000
4
bds
|
4
ba
|
3,310
sqft
|
built
1994
3823 Deer Grass Ct, Houston, TX 77059
$-1,320
Cash flow
-12.9%
Cash-on-Cash Return
2.7%
Cap rate
0.6%
Rent to Value Ratio
Active
$650,000
3
bds
|
4
ba
|
2,697
sqft
|
built
2021
13305 Newcastle Creek Ct, Houston, TX 77059
$-2,005
Cash flow
-16.1%
Cash-on-Cash Return
2.0%
Cap rate
0.6%
Rent to Value Ratio
Active
$399,900
5
bds
|
3
ba
|
3,164
sqft
|
built
1988
4318 Island Hills Dr, Houston, TX 77059
$-671
Cash flow
-8.8%
Cash-on-Cash Return
3.7%
Cap rate
0.8%
Rent to Value Ratio
Active
$400,000
4
bds
|
4
ba
|
3,327
sqft
|
built
1992
13910 Inland Spring Ct, Houston, TX 77059
$-618
Cash flow
-8.1%
Cash-on-Cash Return
3.8%
Cap rate
0.8%
Rent to Value Ratio
Active
$294,500
3
bds
|
2
ba
|
1,920
sqft
|
built
1976
15814 Brookford Dr, Houston, TX 77059
$-410
Cash flow
-7.3%
Cash-on-Cash Return
4.0%
Cap rate
0.7%
Rent to Value Ratio
Active
$435,000
4
bds
|
3
ba
|
3,092
sqft
|
built
1995
13719 Country Green Ct, Houston, TX 77059
$-995
Cash flow
-11.9%
Cash-on-Cash Return
2.9%
Cap rate
0.6%
Rent to Value Ratio
Active
$854,000
5
bds
|
5
ba
|
4,561
sqft
|
built
1997
4519 Amble Oak Ct, Houston, TX 77059
$-2,568
Cash flow
-15.7%
Cash-on-Cash Return
2.1%
Cap rate
0.5%
Rent to Value Ratio
Active
$700,000
3
bds
|
4
ba
|
3,228
sqft
|
built
2015
13710 Banks View Ct, Houston, TX 77059
$-2,344
Cash flow
-17.5%
Cash-on-Cash Return
1.7%
Cap rate
0.6%
Rent to Value Ratio
Active
$675,000
4
bds
|
4
ba
|
3,013
sqft
|
built
2020
14018 Wyndham Terrace Trl, Houston, TX 77059
$-1,992
Cash flow
-15.4%
Cash-on-Cash Return
2.1%
Cap rate
0.6%
Rent to Value Ratio
Active
$756,900
4
bds
|
4
ba
|
3,727
sqft
|
built
2017
13906 Bell Valley Ct, Houston, TX 77059
$-2,179
Cash flow
-15.0%
Cash-on-Cash Return
2.2%
Cap rate
0.6%
Rent to Value Ratio
Active
$824,880
6
bds
|
6
ba
|
5,577
sqft
|
built
1977
16310 Brook Forest Dr, Houston, TX 77059
$-1,350
Cash flow
-8.5%
Cash-on-Cash Return
3.7%
Cap rate
0.8%
Rent to Value Ratio
Active
$475,000
5
bds
|
4
ba
|
3,549
sqft
|
built
1998
4210 Olive Oak Ct, Houston, TX 77059
$-823
Cash flow
-9.0%
Cash-on-Cash Return
3.6%
Cap rate
0.7%
Rent to Value Ratio
Active
$455,000
4
bds
|
3
ba
|
2,922
sqft
|
built
1995
13611 Country Green Ct, Houston, TX 77059
$-1,034
Cash flow
-11.9%
Cash-on-Cash Return
3.0%
Cap rate
0.6%
Rent to Value Ratio
Active
$385,000
3
bds
|
3
ba
|
2,395
sqft
|
built
1995
3014 Cherry Mill Ct, Houston, TX 77059
$-773
Cash flow
-10.5%
Cash-on-Cash Return
3.3%
Cap rate
0.7%
Rent to Value Ratio