77065 Investment Properties for Sale
Browse homes for sale and investment properties in 77065. Refine your search by price, property type, or more.
Best cash flowing properties in 77065
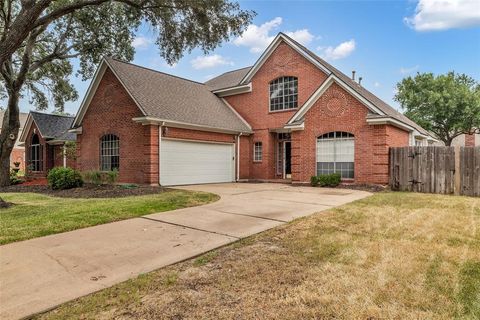
Active
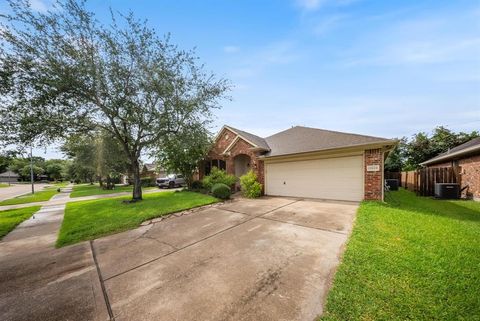
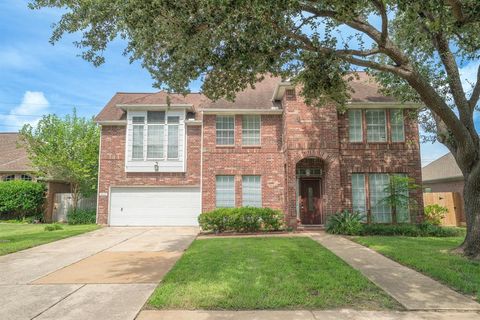
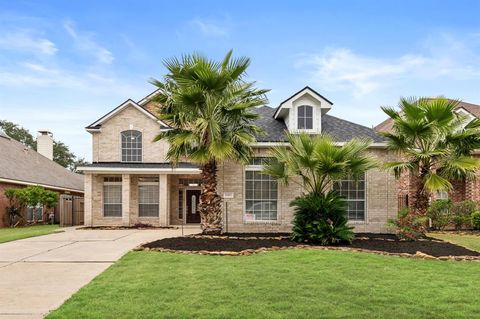
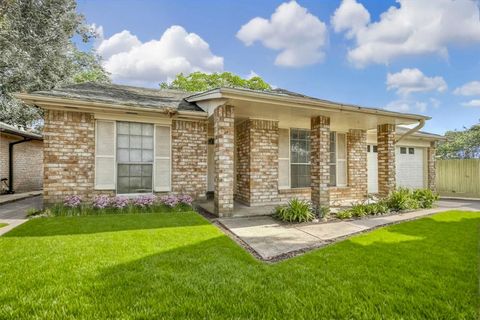
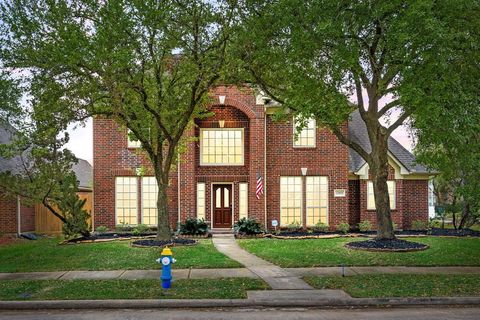
$324,999
3
bds
|
2
ba
|
2,193
sqft
|
built
2005
13210 Wortham Brook Ln, Houston, TX 77065
$206
Cash flow
3.3%
Cash-on-Cash Return
6.4%
Cap rate
0.8%
Rent to Value Ratio
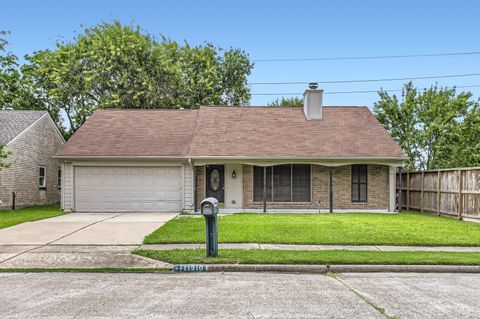
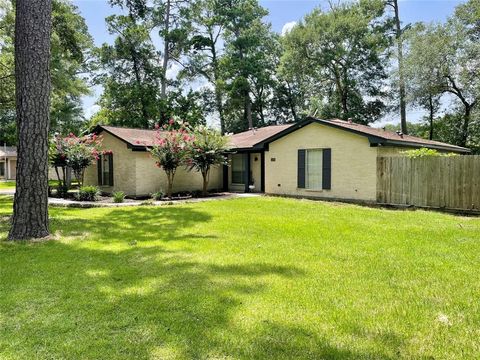
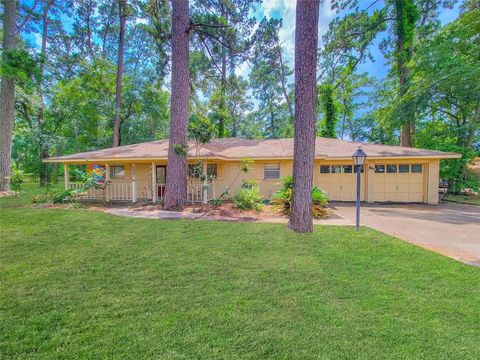
Active
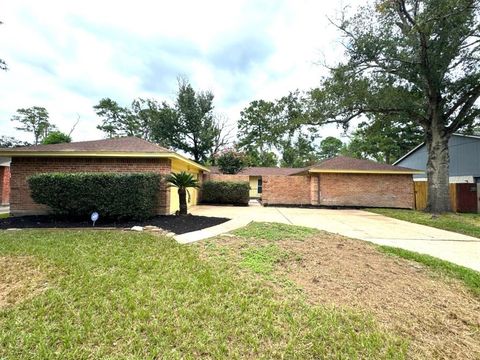
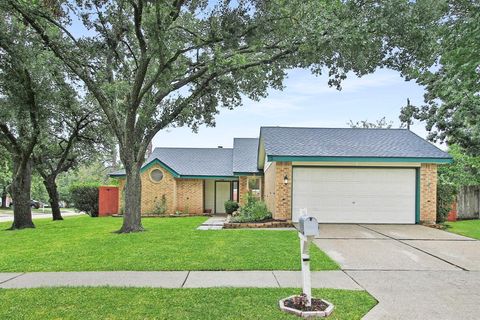
$229,900
3
bds
|
2
ba
|
1,915
sqft
|
built
1976
12414 Advance Dr, Houston, TX 77065
$29
Cash flow
0.7%
Cash-on-Cash Return
5.8%
Cap rate
1.0%
Rent to Value Ratio
41 out of 41 properties for sale in 77065
Limited Results Shown
Create a free account, or log in to reveal all property listings and enjoy the complete experience.
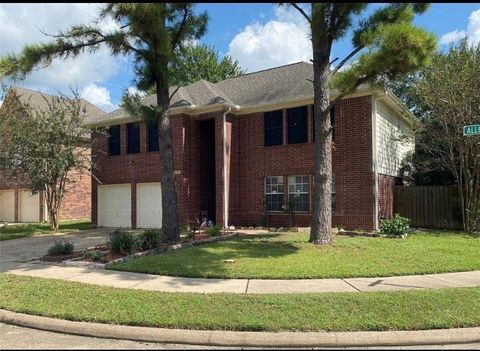
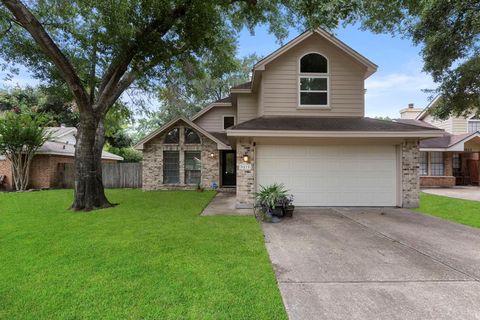
Active
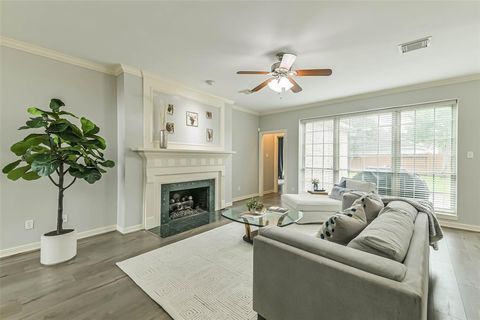
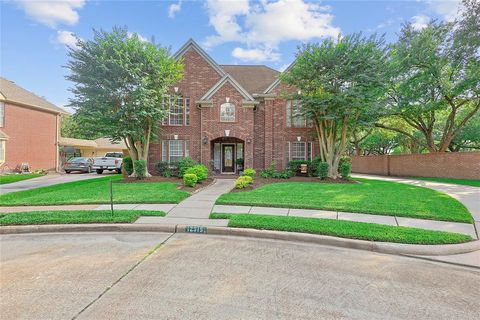
$449,999
4
bds
|
4
ba
|
3,397
sqft
|
built
1994
13023 Dogwood Blossom Trl, Houston, TX 77065
$-987
Cash flow
-11.4%
Cash-on-Cash Return
3.0%
Cap rate
0.6%
Rent to Value Ratio
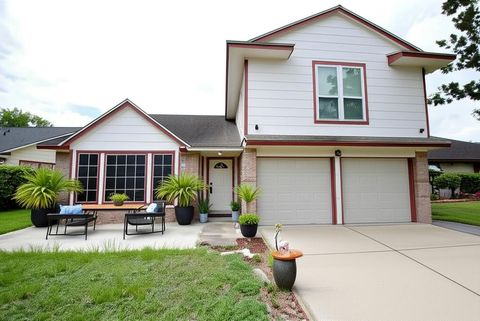
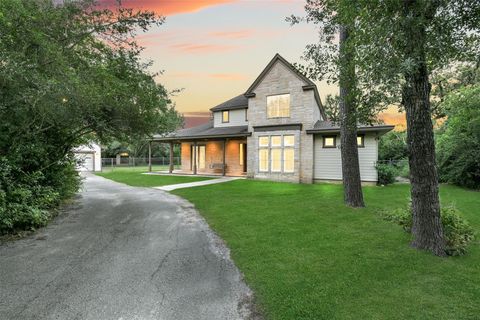
Active
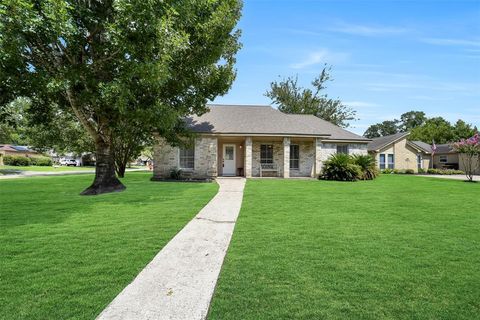
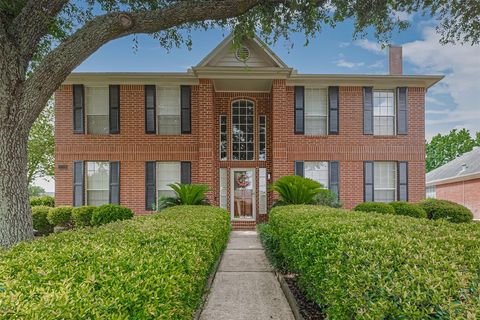
$295,000
4
bds
|
2
ba
|
1,902
sqft
|
built
1978
11710 One Token Dr, Houston, TX 77065
$-431
Cash flow
-7.6%
Cash-on-Cash Return
3.9%
Cap rate
0.7%
Rent to Value Ratio
Active
$335,000
4
bds
|
3
ba
|
2,358
sqft
|
built
1993
10115 Hedge Way Dr, Houston, TX 77065
$-507
Cash flow
-7.9%
Cash-on-Cash Return
3.9%
Cap rate
0.7%
Rent to Value Ratio
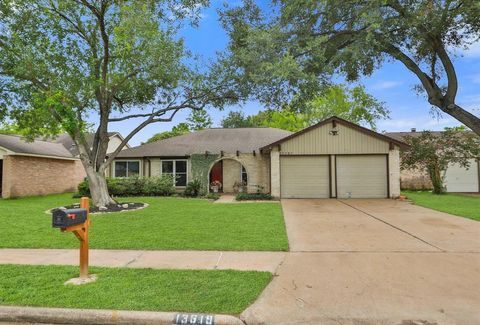
Active
$280,000
3
bds
|
2
ba
|
1,870
sqft
|
built
1981
13619 Splintered Oak Dr, Houston, TX 77065
$-437
Cash flow
-8.1%
Cash-on-Cash Return
3.8%
Cap rate
0.7%
Rent to Value Ratio
Active
$350,000
4
bds
|
3
ba
|
2,450
sqft
|
built
2001
13134 Durbridge Trail Dr, Houston, TX 77065
$-670
Cash flow
-10.0%
Cash-on-Cash Return
3.4%
Cap rate
0.7%
Rent to Value Ratio
Active
$369,900
4
bds
|
3
ba
|
2,819
sqft
|
built
1996
9434 Barretts Glen Ct, Houston, TX 77065
$-83
Cash flow
-1.2%
Cash-on-Cash Return
5.4%
Cap rate
0.7%
Rent to Value Ratio
Active
$264,999
3
bds
|
2
ba
|
1,886
sqft
|
built
1978
11603 Counselor St, Houston, TX 77065
$-267
Cash flow
-5.3%
Cash-on-Cash Return
4.5%
Cap rate
0.8%
Rent to Value Ratio
Active
$245,000
4
bds
|
2
ba
|
1,538
sqft
|
built
1975
13202 Gautier Ct, Houston, TX 77065
$-318
Cash flow
-6.8%
Cash-on-Cash Return
4.1%
Cap rate
0.7%
Rent to Value Ratio
Active
$365,000
4
bds
|
3
ba
|
2,664
sqft
|
built
1998
11811 Miramar Shores Dr, Houston, TX 77065
$-680
Cash flow
-9.7%
Cash-on-Cash Return
3.4%
Cap rate
0.7%
Rent to Value Ratio
Active
$290,000
3
bds
|
2
ba
|
1,713
sqft
|
built
1980
10306 Pear Oak Dr, Houston, TX 77065
$-467
Cash flow
-8.4%
Cash-on-Cash Return
3.7%
Cap rate
0.7%
Rent to Value Ratio
Active
$465,000
4
bds
|
3
ba
|
2,795
sqft
|
built
1998
11902 Miramar Shores Dr, Houston, TX 77065
$-835
Cash flow
-9.4%
Cash-on-Cash Return
3.5%
Cap rate
0.7%
Rent to Value Ratio
Active
$248,000
3
bds
|
2
ba
|
1,490
sqft
|
built
1984
11910 Yearling Dr, Houston, TX 77065
$-392
Cash flow
-8.2%
Cash-on-Cash Return
3.8%
Cap rate
0.7%
Rent to Value Ratio
Active
$304,000
4
bds
|
3
ba
|
2,380
sqft
|
built
1992
10702 Allens Landing Dr, Houston, TX 77065
$-488
Cash flow
-8.4%
Cash-on-Cash Return
3.8%
Cap rate
0.7%
Rent to Value Ratio
Active
$272,900
3
bds
|
3
ba
|
2,200
sqft
|
built
1982
13507 White Cliff Dr, Houston, TX 77065
$-240
Cash flow
-4.6%
Cash-on-Cash Return
4.6%
Cap rate
0.8%
Rent to Value Ratio
Active
$289,000
4
bds
|
2
ba
|
1,882
sqft
|
built
1980
13403 Splintered Oak Dr, Houston, TX 77065
$-281
Cash flow
-5.1%
Cash-on-Cash Return
4.5%
Cap rate
0.7%
Rent to Value Ratio
Active
$305,000
3
bds
|
2
ba
|
1,871
sqft
|
built
1978
11634 Chuckson Dr, Houston, TX 77065
$-494
Cash flow
-8.5%
Cash-on-Cash Return
3.7%
Cap rate
0.7%
Rent to Value Ratio
Active
$264,900
3
bds
|
2
ba
|
1,578
sqft
|
built
2005
11230 Chelsea Oak St, Houston, TX 77065
$-336
Cash flow
-6.6%
Cash-on-Cash Return
4.2%
Cap rate
0.8%
Rent to Value Ratio
Active
$290,000
4
bds
|
2
ba
|
2,015
sqft
|
built
1982
13619 Tara Oak Dr, Houston, TX 77065
$-454
Cash flow
-8.2%
Cash-on-Cash Return
3.8%
Cap rate
0.7%
Rent to Value Ratio
Active
$249,900
3
bds
|
2
ba
|
1,754
sqft
|
built
1980
12115 Swan Creek Dr, Houston, TX 77065
$-223
Cash flow
-4.7%
Cash-on-Cash Return
4.6%
Cap rate
0.8%
Rent to Value Ratio
Active
$435,000
3
bds
|
2
ba
|
2,560
sqft
|
built
1975
12203 W Morgan Dr, Houston, TX 77065
$-902
Cash flow
-10.8%
Cash-on-Cash Return
3.2%
Cap rate
0.6%
Rent to Value Ratio
Active
$320,000
3
bds
|
3
ba
|
2,025
sqft
|
built
1984
9819 Stableway Dr, Houston, TX 77065
$-614
Cash flow
-10.0%
Cash-on-Cash Return
3.4%
Cap rate
0.6%
Rent to Value Ratio
Active
$675,000
3
bds
|
3
ba
|
3,109
sqft
|
built
1998
11310 Glenora Dr, Houston, TX 77065
$-1,727
Cash flow
-13.3%
Cash-on-Cash Return
2.6%
Cap rate
0.5%
Rent to Value Ratio
Active
$375,999
4
bds
|
3
ba
|
2,935
sqft
|
built
1991
12915 Birch Falls Rd, Houston, TX 77065
$-744
Cash flow
-10.3%
Cash-on-Cash Return
3.3%
Cap rate
0.7%
Rent to Value Ratio
Active
$274,900
3
bds
|
2
ba
|
1,521
sqft
|
built
1983
9803 Haverdown Dr, Houston, TX 77065
$-392
Cash flow
-7.4%
Cash-on-Cash Return
4.0%
Cap rate
0.7%
Rent to Value Ratio
Active
$465,000
5
bds
|
4
ba
|
3,305
sqft
|
built
1994
11203 Chestnut Woods Trl, Houston, TX 77065
$-988
Cash flow
-11.1%
Cash-on-Cash Return
3.1%
Cap rate
0.6%
Rent to Value Ratio
Active
$399,000
4
bds
|
4
ba
|
3,146
sqft
|
built
1994
12815 Jubilee Park Ct, Houston, TX 77065
$-629
Cash flow
-8.2%
Cash-on-Cash Return
3.8%
Cap rate
0.7%
Rent to Value Ratio
Active
$251,500
3
bds
|
2
ba
|
1,492
sqft
|
built
1973
13110 Maxim Dr, Houston, TX 77065
$-310
Cash flow
-6.4%
Cash-on-Cash Return
4.2%
Cap rate
0.7%
Rent to Value Ratio
Active
$429,900
4
bds
|
3
ba
|
3,153
sqft
|
built
1992
13210 Sycamore Heights St, Houston, TX 77065
$-595
Cash flow
-7.2%
Cash-on-Cash Return
4.0%
Cap rate
0.7%
Rent to Value Ratio
Active
$495,000
4
bds
|
4
ba
|
2,979
sqft
|
built
1999
12022 Miramar Shores Dr, Houston, TX 77065
$-1,149
Cash flow
-12.1%
Cash-on-Cash Return
2.9%
Cap rate
0.6%
Rent to Value Ratio

Active
$399,000
4
bds
|
2
ba
|
2,140
sqft
|
built
1966
12002 Bexhill Dr, Houston, TX 77065
$-325
Cash flow
-4.2%
Cash-on-Cash Return
4.7%
Cap rate
0.8%
Rent to Value Ratio
Active
$419,900
3
bds
|
2
ba
|
1,791
sqft
|
built
2023
11707 Barwood Bend Dr, Houston, TX 77065
$-1,162
Cash flow
-14.4%
Cash-on-Cash Return
2.4%
Cap rate
0.5%
Rent to Value Ratio
Active
$350,000
3
bds
|
2
ba
|
2,253
sqft
|
built
1966
12119 Beverly Dr, Houston, TX 77065
$-391
Cash flow
-5.8%
Cash-on-Cash Return
4.3%
Cap rate
0.7%
Rent to Value Ratio
Active
$275,000
3
bds
|
3
ba
|
2,274
sqft
|
built
1992
9618 Mystic Crossing Ct, Houston, TX 77065
$-282
Cash flow
-5.4%
Cash-on-Cash Return
4.4%
Cap rate
0.8%
Rent to Value Ratio
Active
$255,000
3
bds
|
2
ba
|
1,713
sqft
|
built
1982
13602 Piney Oaks Dr, Houston, TX 77065
$-357
Cash flow
-7.3%
Cash-on-Cash Return
4.0%
Cap rate
0.7%
Rent to Value Ratio
Active
$309,900
5
bds
|
3
ba
|
2,734
sqft
|
built
1993
11410 Meadowchase Dr, Houston, TX 77065
$-207
Cash flow
-3.5%
Cash-on-Cash Return
4.9%
Cap rate
0.9%
Rent to Value Ratio
Active
$275,000
3
bds
|
2
ba
|
2,142
sqft
|
built
1975
11635 Chuckson Dr, Houston, TX 77065
$-283
Cash flow
-5.4%
Cash-on-Cash Return
4.4%
Cap rate
0.8%
Rent to Value Ratio
Active
$320,000
3
bds
|
3
ba
|
2,633
sqft
|
built
1969
12315 Foxburo Dr, Houston, TX 77065
$-310
Cash flow
-5.1%
Cash-on-Cash Return
4.5%
Cap rate
0.8%
Rent to Value Ratio
Active
$295,000
3
bds
|
3
ba
|
1,964
sqft
|
built
1983
9806 Paddock Park Dr, Houston, TX 77065
$-443
Cash flow
-7.8%
Cash-on-Cash Return
3.9%
Cap rate
0.7%
Rent to Value Ratio