77066 Investment Properties for Sale
Browse homes for sale and investment properties in 77066. Refine your search by price, property type, or more.
Best cash flowing properties in 77066
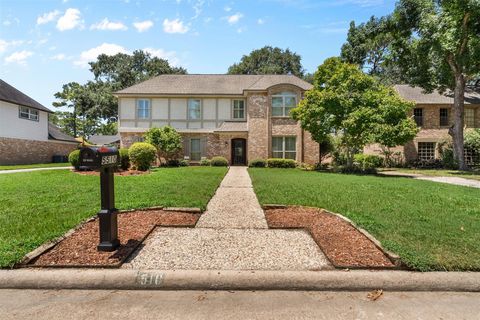
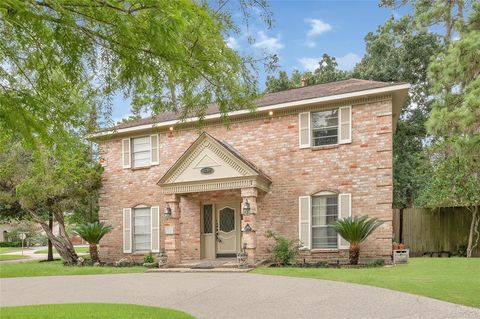
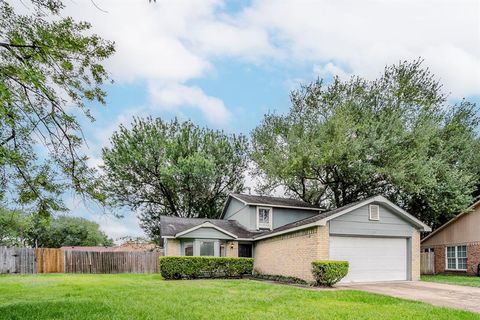
Active
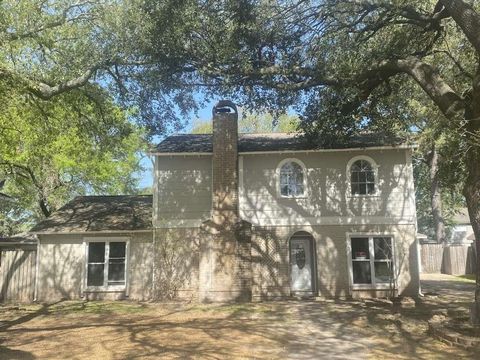
$179,400
3
bds
|
2
ba
|
1,042
sqft
|
built
1984
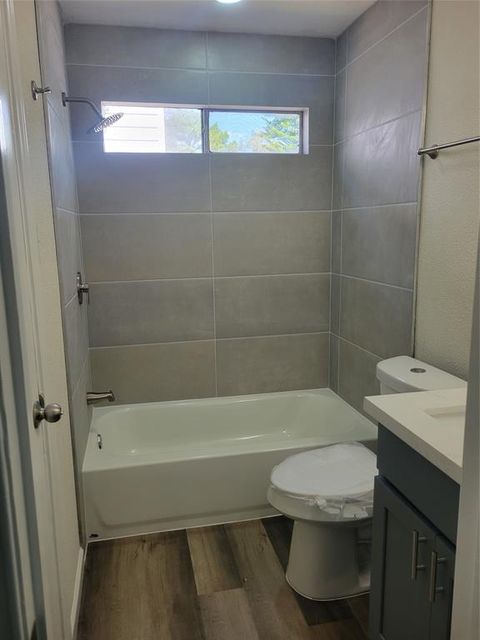
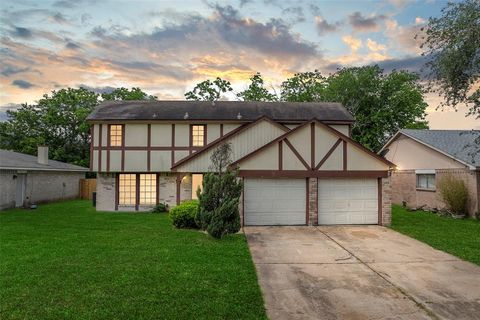
11544 Springshire Dr, Houston, TX 77066
$364
Cash flow
10.6%
Cash-on-Cash Return
8.1%
Cap rate
1.0%
Rent to Value Ratio
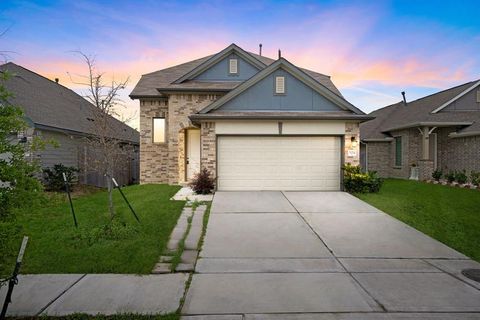
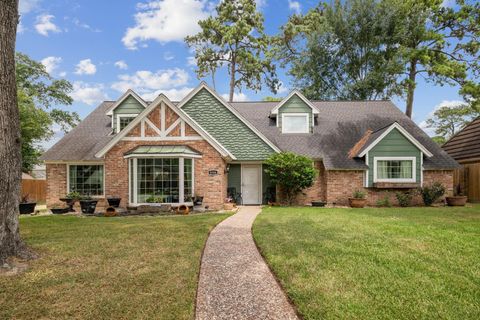
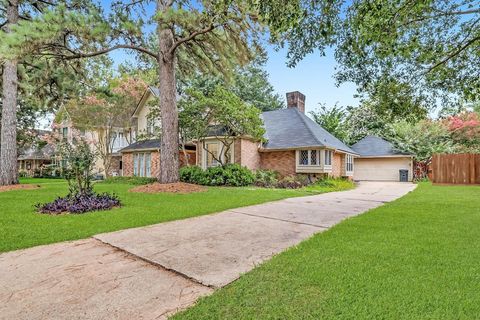
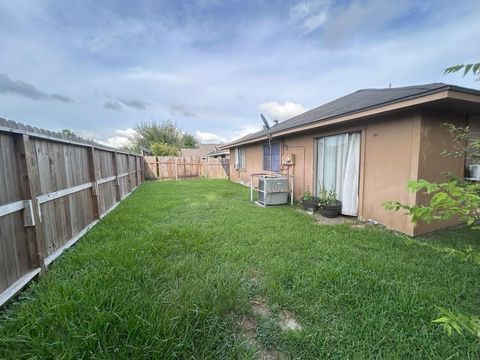
Active
$208,000
3
bds
|
3
ba
|
2,170
sqft
|
built
1984
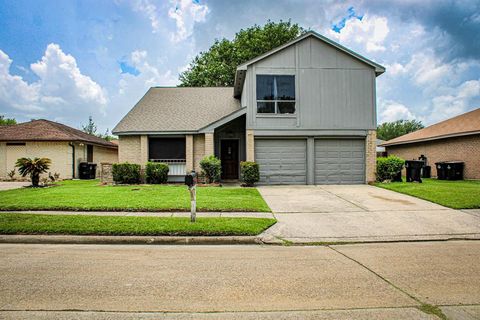
11335 Chelsea Walk Dr, Houston, TX 77066
$139
Cash flow
3.5%
Cash-on-Cash Return
6.5%
Cap rate
1.1%
Rent to Value Ratio
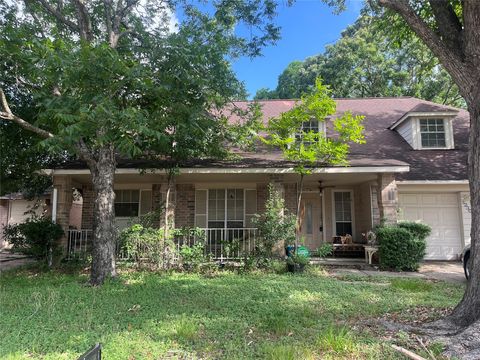
57 out of 61 properties for sale in 77066
Limited Results Shown
Create a free account, or log in to reveal all property listings and enjoy the complete experience.
Active
$270,000
3
bds
|
2
ba
|
1,046
sqft
|
built
1981
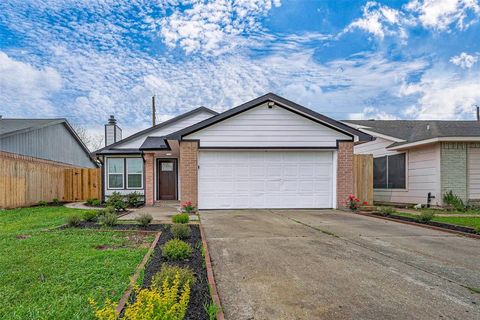
12103 W Marsham Cir, Houston, TX 77066
$-510
Cash flow
-9.9%
Cash-on-Cash Return
3.4%
Cap rate
0.6%
Rent to Value Ratio
Active
$284,990
4
bds
|
3
ba
|
2,857
sqft
|
built
1991
11442 Galbreath Dr, Houston, TX 77066
$-279
Cash flow
-5.1%
Cash-on-Cash Return
4.5%
Cap rate
0.9%
Rent to Value Ratio
Active
$327,289
4
bds
|
4
ba
|
3,346
sqft
|
built
1976
4906 Havenwoods Dr, Houston, TX 77066
$-455
Cash flow
-7.3%
Cash-on-Cash Return
4.0%
Cap rate
0.8%
Rent to Value Ratio
Active
$335,000
4
bds
|
3
ba
|
2,513
sqft
|
built
2022
5014 Aspen Orchard Dr, Houston, TX 77066
$-726
Cash flow
-11.3%
Cash-on-Cash Return
3.1%
Cap rate
0.7%
Rent to Value Ratio
Active
$295,000
4
bds
|
3
ba
|
2,179
sqft
|
built
2005
12430 Heritage Grove Dr, Houston, TX 77066
$-318
Cash flow
-5.6%
Cash-on-Cash Return
4.4%
Cap rate
0.8%
Rent to Value Ratio
Active
$239,750
4
bds
|
3
ba
|
1,677
sqft
|
built
1982
4735 Brownfields Dr, Houston, TX 77066
$-362
Cash flow
-7.9%
Cash-on-Cash Return
3.9%
Cap rate
0.8%
Rent to Value Ratio
Active
$350,000
4
bds
|
4
ba
|
3,564
sqft
|
built
1975
5510 Pine Arbor Dr, Houston, TX 77066
$-596
Cash flow
-8.9%
Cash-on-Cash Return
3.6%
Cap rate
0.7%
Rent to Value Ratio
Active
$349,000
5
bds
|
3
ba
|
3,186
sqft
|
built
1971
5506 Boyce Springs Dr, Houston, TX 77066
$-442
Cash flow
-6.6%
Cash-on-Cash Return
4.2%
Cap rate
0.7%
Rent to Value Ratio
Active
$299,900
3
bds
|
2
ba
|
1,664
sqft
|
built
2019
5111 Azalea Trace Dr, Houston, TX 77066
$-632
Cash flow
-11.0%
Cash-on-Cash Return
3.1%
Cap rate
0.7%
Rent to Value Ratio
Active
$415,000
3
bds
|
3
ba
|
2,657
sqft
|
built
2022
11710 Glossy Oak Ln, Houston, TX 77066
$-987
Cash flow
-12.4%
Cash-on-Cash Return
2.8%
Cap rate
0.7%
Rent to Value Ratio
Active
$240,000
3
bds
|
2
ba
|
1,660
sqft
|
built
1984
5530 Oak Falls Dr, Houston, TX 77066
$-127
Cash flow
-2.8%
Cash-on-Cash Return
5.0%
Cap rate
0.8%
Rent to Value Ratio
Active
$315,000
4
bds
|
3
ba
|
2,324
sqft
|
built
1979
11531 Colonial Trail Dr, Houston, TX 77066
$-501
Cash flow
-8.3%
Cash-on-Cash Return
3.8%
Cap rate
0.7%
Rent to Value Ratio
Active
$334,990
5
bds
|
4
ba
|
2,990
sqft
|
built
1972
5306 Havenwoods Dr, Houston, TX 77066
$-403
Cash flow
-6.3%
Cash-on-Cash Return
4.2%
Cap rate
0.7%
Rent to Value Ratio
Active
$220,000
3
bds
|
2
ba
|
1,607
sqft
|
built
1981
14118 Magnolia Springs Dr, Houston, TX 77066
$-286
Cash flow
-6.8%
Cash-on-Cash Return
4.1%
Cap rate
0.8%
Rent to Value Ratio
Active
$275,000
4
bds
|
4
ba
|
2,442
sqft
|
built
1973
5214 Lawn Arbor Dr, Houston, TX 77066
$-269
Cash flow
-5.1%
Cash-on-Cash Return
4.5%
Cap rate
0.8%
Rent to Value Ratio
Active
$260,000
3
bds
|
2
ba
|
2,008
sqft
|
built
1980
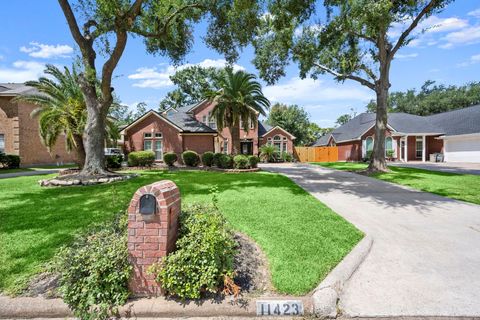
11423 Canyon Trail Dr, Houston, TX 77066
$-327
Cash flow
-6.6%
Cash-on-Cash Return
4.2%
Cap rate
0.8%
Rent to Value Ratio
Active
$219,900
3
bds
|
3
ba
|
2,508
sqft
|
built
1982
3230 Hombly Rd, Houston, TX 77066
$114
Cash flow
2.7%
Cash-on-Cash Return
6.3%
Cap rate
1.0%
Rent to Value Ratio
Active
$284,900
3
bds
|
3
ba
|
2,444
sqft
|
built
1999
5330 Imperial Grove Dr, Houston, TX 77066
$-331
Cash flow
-6.1%
Cash-on-Cash Return
4.3%
Cap rate
0.8%
Rent to Value Ratio
Active
$213,000
3
bds
|
3
ba
|
1,715
sqft
|
built
1981
12210 Innsbruk Ct, Houston, TX 77066
$-193
Cash flow
-4.7%
Cash-on-Cash Return
4.6%
Cap rate
0.8%
Rent to Value Ratio
Active
$160,000
3
bds
|
2
ba
|
1,470
sqft
|
built
1983
3910 Buckhurst Dr, Houston, TX 77066
$69
Cash flow
2.3%
Cash-on-Cash Return
6.2%
Cap rate
1.1%
Rent to Value Ratio
Active
$240,000
3
bds
|
3
ba
|
2,231
sqft
|
built
1992
12134 Winter Brook Dr, Houston, TX 77066
$-344
Cash flow
-7.5%
Cash-on-Cash Return
4.0%
Cap rate
0.8%
Rent to Value Ratio
Active
$238,000
3
bds
|
3
ba
|
1,869
sqft
|
built
1983
12115 Essenbruk Dr, Houston, TX 77066
$-245
Cash flow
-5.4%
Cash-on-Cash Return
4.4%
Cap rate
0.8%
Rent to Value Ratio
Active
$284,900
4
bds
|
3
ba
|
2,585
sqft
|
built
1972
5330 Boyce Springs Dr, Houston, TX 77066
$-488
Cash flow
-8.9%
Cash-on-Cash Return
3.6%
Cap rate
0.7%
Rent to Value Ratio
Active
$242,000
3
bds
|
4
ba
|
1,835
sqft
|
built
1981
11322 Yorklyn Dr, Houston, TX 77066
$-351
Cash flow
-7.6%
Cash-on-Cash Return
3.9%
Cap rate
0.7%
Rent to Value Ratio
Active
$252,000
4
bds
|
2
ba
|
2,800
sqft
|
built
1978
4014 Windrift Dr, Houston, TX 77066
$-277
Cash flow
-5.7%
Cash-on-Cash Return
4.4%
Cap rate
0.7%
Rent to Value Ratio
Active
$319,900
5
bds
|
3
ba
|
2,758
sqft
|
built
1971
5822 Boyce Springs Dr, Houston, TX 77066
$-309
Cash flow
-5.0%
Cash-on-Cash Return
4.5%
Cap rate
0.8%
Rent to Value Ratio

Active
$350,000
4
bds
|
4
ba
|
2,659
sqft
|
built
1976
4803 Charade Dr, Houston, TX 77066
$-466
Cash flow
-6.9%
Cash-on-Cash Return
4.1%
Cap rate
0.7%
Rent to Value Ratio
Active
$275,000
3
bds
|
2
ba
|
1,682
sqft
|
built
1983
3519 Hombly Rd, Houston, TX 77066
$-519
Cash flow
-9.8%
Cash-on-Cash Return
3.4%
Cap rate
0.6%
Rent to Value Ratio
Active
$239,900
5
bds
|
3
ba
|
2,863
sqft
|
built
1972
5727 Pebble Springs Dr, Houston, TX 77066
$66
Cash flow
1.4%
Cash-on-Cash Return
6.0%
Cap rate
1.0%
Rent to Value Ratio
Active
$179,900
3
bds
|
2
ba
|
1,436
sqft
|
built
1985
4319 Conward Dr, Houston, TX 77066
$-86
Cash flow
-2.5%
Cash-on-Cash Return
5.1%
Cap rate
1.0%
Rent to Value Ratio
Active
$314,999
5
bds
|
4
ba
|
2,740
sqft
|
built
1978
4522 Geneva Dr, Houston, TX 77066
$-262
Cash flow
-4.3%
Cash-on-Cash Return
4.7%
Cap rate
0.8%
Rent to Value Ratio
Active
$329,900
4
bds
|
3
ba
|
2,420
sqft
|
built
1979
5111 Pinewilde Dr, Houston, TX 77066
$-366
Cash flow
-5.8%
Cash-on-Cash Return
4.3%
Cap rate
0.5%
Rent to Value Ratio
Active
$275,000
3
bds
|
3
ba
|
1,715
sqft
|
built
1982
5011 Kleinway Dr, Houston, TX 77066
$-556
Cash flow
-10.5%
Cash-on-Cash Return
3.3%
Cap rate
0.7%
Rent to Value Ratio
Active
$220,000
3
bds
|
2
ba
|
1,666
sqft
|
built
1982
4710 Marburg Ct, Houston, TX 77066
$-346
Cash flow
-8.2%
Cash-on-Cash Return
3.8%
Cap rate
0.8%
Rent to Value Ratio
Active
$289,900
5
bds
|
4
ba
|
3,870
sqft
|
built
1972
5914 Foresthaven Dr, Houston, TX 77066
$-66
Cash flow
-1.2%
Cash-on-Cash Return
5.4%
Cap rate
1.0%
Rent to Value Ratio
Active
$225,000
3
bds
|
3
ba
|
2,071
sqft
|
built
1978
4027 Brookhead Trl, Houston, TX 77066
$-135
Cash flow
-3.1%
Cash-on-Cash Return
5.0%
Cap rate
0.9%
Rent to Value Ratio
Active
$385,000
4
bds
|
3
ba
|
2,408
sqft
|
built
1992
11423 Corola Trail Dr, Houston, TX 77066
$-836
Cash flow
-11.3%
Cash-on-Cash Return
3.1%
Cap rate
0.6%
Rent to Value Ratio
Active
$489,000
4
bds
|
4
ba
|
4,898
sqft
|
built
1971
5503 Pebble Springs Dr, Houston, TX 77066
$-362
Cash flow
-3.9%
Cash-on-Cash Return
4.8%
Cap rate
0.8%
Rent to Value Ratio