77068 Investment Properties for Sale
Browse homes for sale and investment properties in 77068. Refine your search by price, property type, or more.
Best cash flowing properties in 77068
Active
$265,000
5
bds
|
3
ba
|
2,898
sqft
|
built
1978
15611 Ripplewind Ln, Houston, TX 77068
$227
Cash flow
4.5%
Cash-on-Cash Return
6.7%
Cap rate
1.1%
Rent to Value Ratio

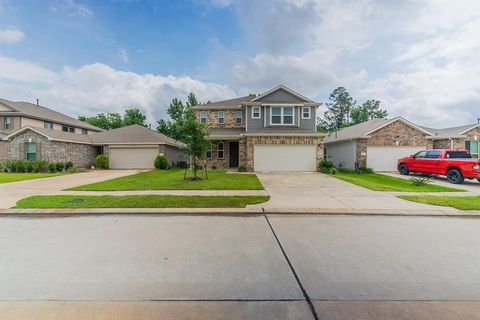
Active
$290,000
4
bds
|
3
ba
|
1,903
sqft
|
built
2021
4354 Tulip Oak Dr, Houston, TX 77068
$182
Cash flow
3.3%
Cash-on-Cash Return
6.4%
Cap rate
0.8%
Rent to Value Ratio
43 out of 69 properties for sale in 77068
Limited Results Shown
Create a free account, or log in to reveal all property listings and enjoy the complete experience.
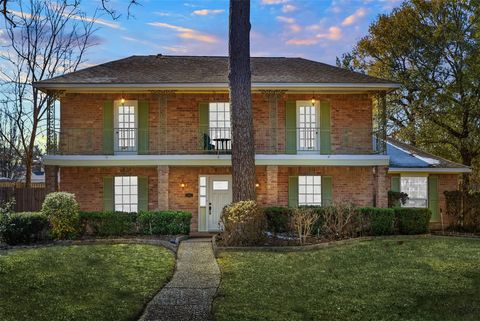
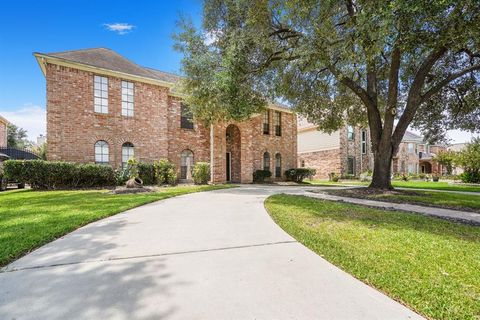
Active
$279,999
3
bds
|
2
ba
|
2,526
sqft
|
built
1979
14911 Walters Rd, Houston, TX 77068
$-304
Cash flow
-5.7%
Cash-on-Cash Return
4.4%
Cap rate
0.8%
Rent to Value Ratio
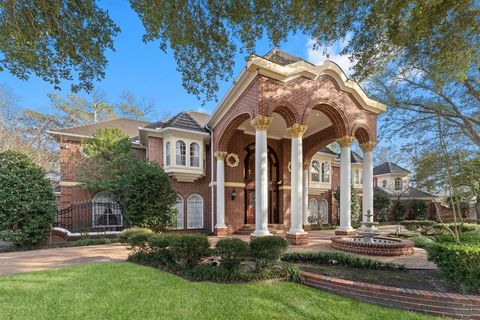
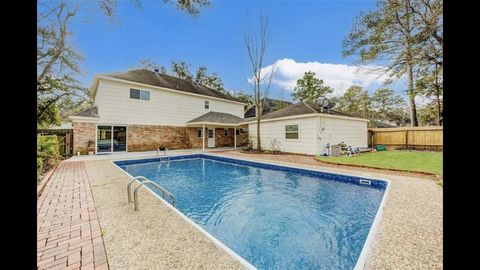
Active
$1,299,000
6
bds
|
8
ba
|
7,686
sqft
|
built
1993
2907 Cedar Woods Pl, Houston, TX 77068
$-2,283
Cash flow
-9.2%
Cash-on-Cash Return
3.6%
Cap rate
0.4%
Rent to Value Ratio
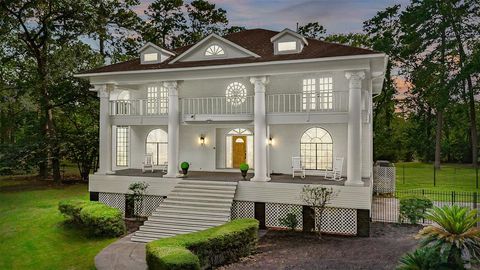
Active
$825,000
5
bds
|
5
ba
|
6,309
sqft
|
built
1982
3204 Ivy Falls Dr, Houston, TX 77068
$-1,425
Cash flow
-9.0%
Cash-on-Cash Return
3.6%
Cap rate
0.7%
Rent to Value Ratio
Active
$270,000
3
bds
|
3
ba
|
2,550
sqft
|
built
2020
4219 Mossy Banks Ln, Houston, TX 77068
$-366
Cash flow
-7.1%
Cash-on-Cash Return
4.1%
Cap rate
0.9%
Rent to Value Ratio
Active
$398,950
4
bds
|
4
ba
|
3,420
sqft
|
built
1983
15311 Dawnbrook Dr, Houston, TX 77068
$-16
Cash flow
-0.2%
Cash-on-Cash Return
5.6%
Cap rate
0.9%
Rent to Value Ratio
Active
$475,000
5
bds
|
4
ba
|
2,862
sqft
|
built
1977
3610 Stoney Oak Dr, Houston, TX 77068
$-116
Cash flow
-1.3%
Cash-on-Cash Return
5.4%
Cap rate
0.7%
Rent to Value Ratio

Active
$273,000
4
bds
|
2
ba
|
1,904
sqft
|
built
2017
14238 Persimmon Woods Dr, Houston, TX 77068
$-372
Cash flow
-7.1%
Cash-on-Cash Return
4.0%
Cap rate
0.8%
Rent to Value Ratio
Active
$800,000
4
bds
|
3
ba
|
4,428
sqft
|
built
1979
17003 Creeksouth Rd, Houston, TX 77068
$-1,669
Cash flow
-10.9%
Cash-on-Cash Return
3.2%
Cap rate
0.5%
Rent to Value Ratio
Active
$395,000
5
bds
|
4
ba
|
3,176
sqft
|
built
1982
15511 Rana Ct, Houston, TX 77068
$-226
Cash flow
-3.0%
Cash-on-Cash Return
5.0%
Cap rate
0.8%
Rent to Value Ratio
Active
$254,000
4
bds
|
3
ba
|
2,532
sqft
|
built
1977
15714 Pebble Bend Dr, Houston, TX 77068
$-355
Cash flow
-7.3%
Cash-on-Cash Return
4.0%
Cap rate
0.8%
Rent to Value Ratio

Active
$414,000
5
bds
|
4
ba
|
3,112
sqft
|
built
1990
15314 Ripplewind Ln, Houston, TX 77068
$-696
Cash flow
-8.8%
Cash-on-Cash Return
3.7%
Cap rate
0.7%
Rent to Value Ratio
Active
$354,900
3
bds
|
3
ba
|
2,535
sqft
|
built
2022
4010 Shady Palmetto Dr, Houston, TX 77068
$-727
Cash flow
-10.7%
Cash-on-Cash Return
3.2%
Cap rate
0.7%
Rent to Value Ratio

Active
$282,500
4
bds
|
3
ba
|
2,462
sqft
|
built
1975
15806 Mindywood Ct, Houston, TX 77068
$-323
Cash flow
-6.0%
Cash-on-Cash Return
4.3%
Cap rate
0.8%
Rent to Value Ratio
Active
$325,000
4
bds
|
4
ba
|
3,489
sqft
|
built
1981
3318 Teawick Ct, Houston, TX 77068
$-320
Cash flow
-5.1%
Cash-on-Cash Return
4.5%
Cap rate
0.9%
Rent to Value Ratio
Active
$444,990
5
bds
|
4
ba
|
3,240
sqft
|
built
1981
3515 Stoney Oak Dr, Houston, TX 77068
$-1,204
Cash flow
-14.1%
Cash-on-Cash Return
2.4%
Cap rate
0.5%
Rent to Value Ratio

Active
$299,900
3
bds
|
2
ba
|
1,891
sqft
|
built
2021
4007 Mossy Banks Ln, Houston, TX 77068
$-381
Cash flow
-6.6%
Cash-on-Cash Return
4.2%
Cap rate
0.8%
Rent to Value Ratio
Active
$549,900
4
bds
|
5
ba
|
4,140
sqft
|
built
1980
15619 Winding Moss Dr, Houston, TX 77068
$-1,365
Cash flow
-13.0%
Cash-on-Cash Return
2.7%
Cap rate
0.5%
Rent to Value Ratio
Active
$349,000
4
bds
|
3
ba
|
3,057
sqft
|
built
1980
15007 Pebble Bend Dr, Houston, TX 77068
$-488
Cash flow
-7.3%
Cash-on-Cash Return
4.0%
Cap rate
0.7%
Rent to Value Ratio
Active
$425,000
5
bds
|
4
ba
|
2,895
sqft
|
built
2022
4015 Mossy Banks Ln, Houston, TX 77068
$-595
Cash flow
-7.3%
Cash-on-Cash Return
4.0%
Cap rate
0.8%
Rent to Value Ratio
Active
$729,900
4
bds
|
4
ba
|
3,706
sqft
|
built
2020
15918 Bridges Fairway Ln, Houston, TX 77068
$-823
Cash flow
-5.9%
Cash-on-Cash Return
4.3%
Cap rate
0.9%
Rent to Value Ratio
Active
$259,900
4
bds
|
3
ba
|
2,246
sqft
|
built
1980
3610 Mossville Ct, Houston, TX 77068
$-285
Cash flow
-5.7%
Cash-on-Cash Return
4.4%
Cap rate
0.8%
Rent to Value Ratio
Active
$10,000,000
4
bds
|
6
ba
|
5,586
sqft
|
built
1995
15214 T C Jester Blvd, Houston, TX 77068
$-44,686
Cash flow
-23.3%
Cash-on-Cash Return
0.3%
Cap rate
0.1%
Rent to Value Ratio
Active
$799,000
4
bds
|
5
ba
|
5,579
sqft
|
built
1991
17314 Cedar Placid Ln, Houston, TX 77068
$-1,471
Cash flow
-9.6%
Cash-on-Cash Return
3.5%
Cap rate
0.6%
Rent to Value Ratio
Active
$280,000
3
bds
|
2
ba
|
2,001
sqft
|
built
2015
4211 False Cypress Ln, Houston, TX 77068
$-551
Cash flow
-10.3%
Cash-on-Cash Return
3.3%
Cap rate
0.7%
Rent to Value Ratio
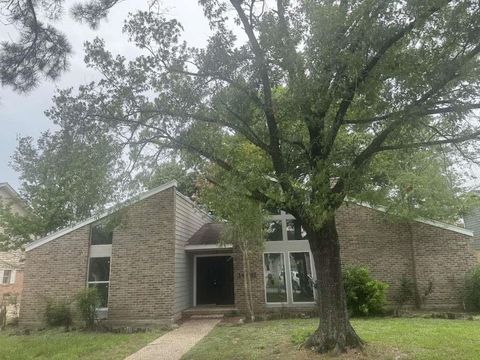
Active
$340,000
4
bds
|
2
ba
|
2,172
sqft
|
built
1967
16506 Amcreek Rd, Houston, TX 77068
$-296
Cash flow
-4.5%
Cash-on-Cash Return
4.6%
Cap rate
0.7%
Rent to Value Ratio
Active
$355,000
4
bds
|
3
ba
|
2,724
sqft
|
built
1975
15335 Poplar Grove Dr, Houston, TX 77068
$-377
Cash flow
-5.5%
Cash-on-Cash Return
4.4%
Cap rate
0.8%
Rent to Value Ratio

Active
$350,000
4
bds
|
3
ba
|
2,428
sqft
|
built
1977
15514 Pebble Bend Dr, Houston, TX 77068
$-255
Cash flow
-3.8%
Cash-on-Cash Return
4.8%
Cap rate
0.8%
Rent to Value Ratio

Active
$650,000
4
bds
|
4
ba
|
3,445
sqft
|
built
2022
15922 Bridges Fairway Ln, Houston, TX 77068
$-1,622
Cash flow
-13.0%
Cash-on-Cash Return
2.7%
Cap rate
0.7%
Rent to Value Ratio
Active
$360,000
4
bds
|
4
ba
|
3,040
sqft
|
built
1980
15411 Fawn Villa Dr, Houston, TX 77068
$-388
Cash flow
-5.6%
Cash-on-Cash Return
4.4%
Cap rate
0.8%
Rent to Value Ratio

Active
$398,800
4
bds
|
5
ba
|
4,101
sqft
|
built
1982
3534 Sierra Pines Dr, Houston, TX 77068
$-492
Cash flow
-6.4%
Cash-on-Cash Return
4.2%
Cap rate
0.8%
Rent to Value Ratio
Active
$369,500
5
bds
|
4
ba
|
2,815
sqft
|
built
1976
3918 Stillview Dr, Houston, TX 77068
$-452
Cash flow
-6.4%
Cash-on-Cash Return
4.2%
Cap rate
0.8%
Rent to Value Ratio
Active
$289,700
4
bds
|
3
ba
|
2,531
sqft
|
built
1975
3714 Woodbriar Dr, Houston, TX 77068
$-328
Cash flow
-5.9%
Cash-on-Cash Return
4.3%
Cap rate
0.8%
Rent to Value Ratio
Active
$309,900
4
bds
|
3
ba
|
2,450
sqft
|
built
1972
3915 Glenheather Dr, Houston, TX 77068
$-260
Cash flow
-4.4%
Cash-on-Cash Return
4.7%
Cap rate
0.8%
Rent to Value Ratio
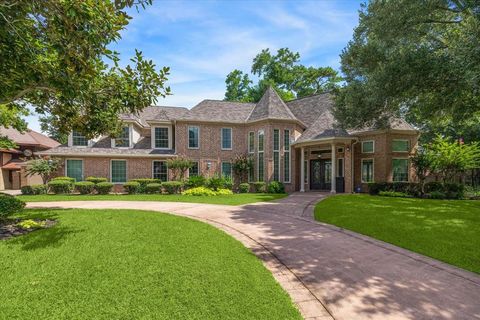
Active
$1,099,000
6
bds
|
6
ba
|
6,053
sqft
|
built
1984
2819 Cedar Woods Pl, Houston, TX 77068
$-1,913
Cash flow
-9.1%
Cash-on-Cash Return
3.6%
Cap rate
0.6%
Rent to Value Ratio
Active
$898,000
3
bds
|
5
ba
|
4,329
sqft
|
built
2008
2802 Twin Fountains Dr, Houston, TX 77068
$-3,196
Cash flow
-18.6%
Cash-on-Cash Return
1.4%
Cap rate
0.5%
Rent to Value Ratio
Active
$345,000
4
bds
|
3
ba
|
2,744
sqft
|
built
1974
3831 Blue Spring Dr, Houston, TX 77068
$-282
Cash flow
-4.3%
Cash-on-Cash Return
4.7%
Cap rate
0.8%
Rent to Value Ratio

Active
$409,379
5
bds
|
3
ba
|
3,250
sqft
|
built
2015
4306 Lake Cypress Cir, Houston, TX 77068
$-941
Cash flow
-12.0%
Cash-on-Cash Return
2.9%
Cap rate
0.6%
Rent to Value Ratio

Active
$339,900
4
bds
|
3
ba
|
2,570
sqft
|
built
1977
15610 Ripplewind Ln, Houston, TX 77068
$-50
Cash flow
-0.8%
Cash-on-Cash Return
5.5%
Cap rate
0.8%
Rent to Value Ratio