77498 Investment Properties for Sale
Browse homes for sale and investment properties in 77498. Refine your search by price, property type, or more.
Best cash flowing properties in 77498

Active
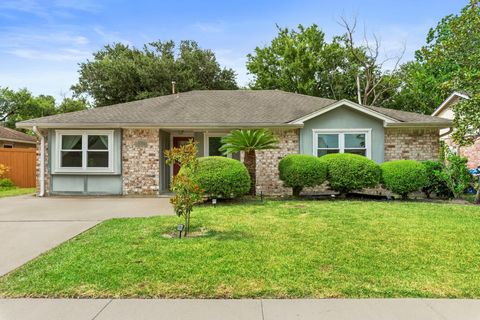
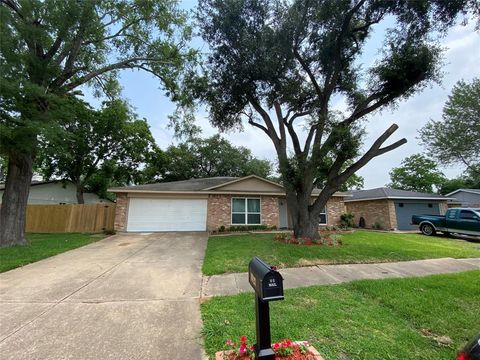
$203,500
3
bds
|
1
ba
|
990
sqft
|
built
1963
106 Avenue G, Sugar Land, TX 77498
$417
Cash flow
10.7%
Cash-on-Cash Return
8.1%
Cap rate
1.0%
Rent to Value Ratio
Active
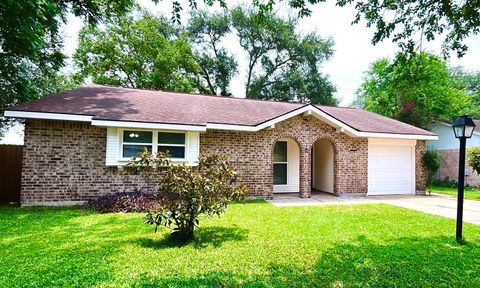
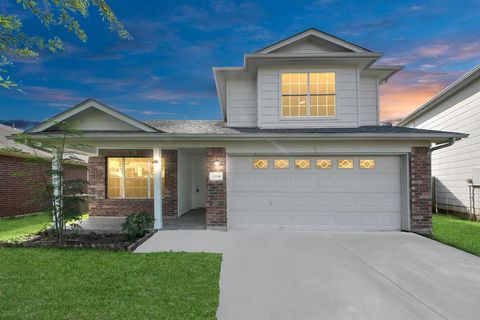
$250,000
3
bds
|
2
ba
|
1,789
sqft
|
built
1971
13430 Greenway Dr, Sugar Land, TX 77498
$-10
Cash flow
-0.2%
Cash-on-Cash Return
5.6%
Cap rate
0.7%
Rent to Value Ratio
54 out of 56 properties for sale in 77498
Limited Results Shown
Create a free account, or log in to reveal all property listings and enjoy the complete experience.
Active
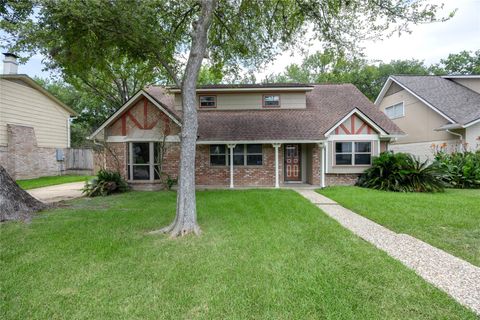
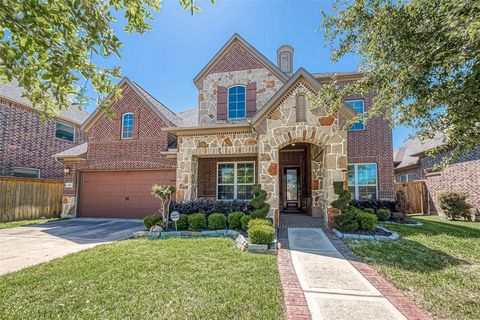
$265,000
3
bds
|
2
ba
|
1,414
sqft
|
built
1970
13419 Greenway Dr, Sugar Land, TX 77498
$-381
Cash flow
-7.5%
Cash-on-Cash Return
4.0%
Cap rate
0.7%
Rent to Value Ratio
Active
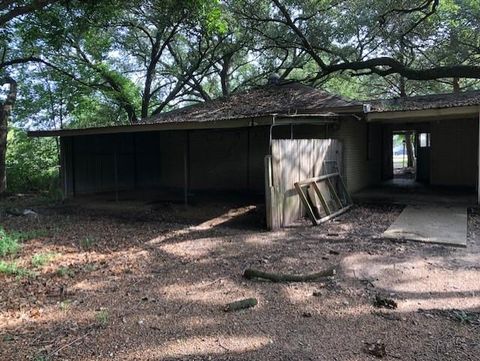
$289,900
4
bds
|
3
ba
|
2,342
sqft
|
built
1975
13910 Baytree Dr, Sugar Land, TX 77498
$-336
Cash flow
-6.0%
Cash-on-Cash Return
4.3%
Cap rate
0.8%
Rent to Value Ratio
Active
$475,000
3
bds
|
3
ba
|
1,465
sqft
|
built
1963
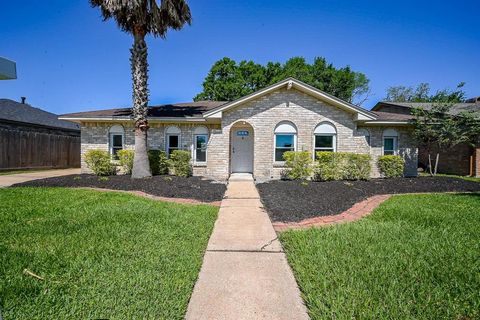
719 Burney Rd, Sugar Land, TX 77498
$-1,494
Cash flow
-16.4%
Cash-on-Cash Return
1.9%
Cap rate
0.4%
Rent to Value Ratio

Active
$535,000
4
bds
|
4
ba
|
3,472
sqft
|
built
2002
3906 Lakeridge Canyon Dr, Sugar Land, TX 77498
$-1,019
Cash flow
-9.9%
Cash-on-Cash Return
3.4%
Cap rate
0.7%
Rent to Value Ratio
Active
$285,000
4
bds
|
3
ba
|
1,716
sqft
|
built
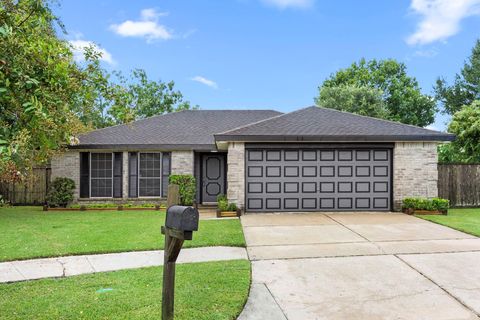
1979
14303 Branchwater Ln, Sugar Land, TX 77498
$-459
Cash flow
-8.4%
Cash-on-Cash Return
3.7%
Cap rate
0.7%
Rent to Value Ratio
Active
$267,000
3
bds
|
2
ba
|
1,618
sqft
|
built
1980
16841 Aprilmont Dr, Sugar Land, TX 77498
$-393
Cash flow
-7.7%
Cash-on-Cash Return
3.9%
Cap rate
0.7%
Rent to Value Ratio
Active
$440,000
5
bds
|
4
ba
|
3,418
sqft
|
built
1998
12915 Stratford Heights Dr, Sugar Land, TX 77498
$-804
Cash flow
-9.5%
Cash-on-Cash Return
3.5%
Cap rate
0.7%
Rent to Value Ratio
Active
$375,000
4
bds
|
3
ba
|
2,562
sqft
|
built
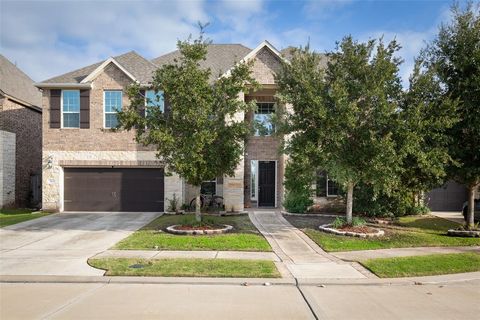
1999
13510 Naples Bridge Rd, Sugar Land, TX 77498
$-665
Cash flow
-9.3%
Cash-on-Cash Return
3.6%
Cap rate
0.7%
Rent to Value Ratio

Active
$535,000
4
bds
|
4
ba
|
3,179
sqft
|
built
2003
14339 Tasmania Ct, Sugar Land, TX 77498
$-1,349
Cash flow
-13.2%
Cash-on-Cash Return
2.7%
Cap rate
0.5%
Rent to Value Ratio
Active
$399,000
4
bds
|
3
ba
|
2,412
sqft
|
built
2011
2403 Ranna Ct, Sugar Land, TX 77498
$-860
Cash flow
-11.2%
Cash-on-Cash Return
3.1%
Cap rate
0.6%
Rent to Value Ratio
Active
$274,900
3
bds
|
2
ba
|
1,584
sqft
|
built
1976
10123 Kent Towne Ln, Sugar Land, TX 77498
$-515
Cash flow
-9.8%
Cash-on-Cash Return
3.4%
Cap rate
0.7%
Rent to Value Ratio
Active
$319,900
4
bds
|
3
ba
|
2,182
sqft
|
built
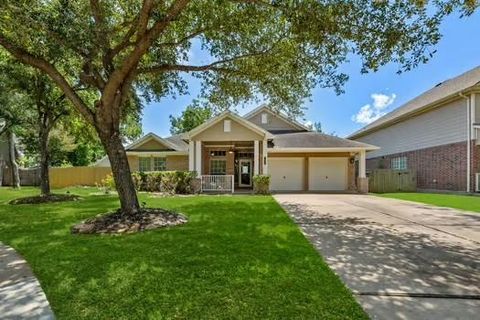
2000
2604 Eldridge Park Way, Sugar Land, TX 77498
$-531
Cash flow
-8.7%
Cash-on-Cash Return
3.7%
Cap rate
0.7%
Rent to Value Ratio
Active
$829,900
4
bds
|
4
ba
|
3,834
sqft
|
built
2016
47 Monarch Trl, Sugar Land, TX 77498
$-2,119
Cash flow
-13.3%
Cash-on-Cash Return
2.6%
Cap rate
0.6%
Rent to Value Ratio
Active
$278,000
3
bds
|
2
ba
|
1,875
sqft
|
built
1974
13722 Woodchester Dr, Sugar Land, TX 77498
$-391
Cash flow
-7.3%
Cash-on-Cash Return
4.0%
Cap rate
0.7%
Rent to Value Ratio
Active
$250,000
3
bds
|
2
ba
|
1,171
sqft
|
built
1981
10327 Hollow Canyon Ct, Sugar Land, TX 77498
$-358
Cash flow
-7.5%
Cash-on-Cash Return
4.0%
Cap rate
0.7%
Rent to Value Ratio
Active
$900,000
5
bds
|
5
ba
|
4,577
sqft
|
built
2017
14 Monarch Ct, Sugar Land, TX 77498
$-3,116
Cash flow
-18.1%
Cash-on-Cash Return
1.5%
Cap rate
0.5%
Rent to Value Ratio
Active
$470,000
4
bds
|
2
ba
|
2,512
sqft
|
built
2000
14005 Imperial Canyon Ln, Sugar Land, TX 77498
$-1,268
Cash flow
-14.1%
Cash-on-Cash Return
2.4%
Cap rate
0.5%
Rent to Value Ratio

Active
$300,000
3
bds
|
3
ba
|
2,105
sqft
|
built
1976
1102 Ashdale Dr, Sugar Land, TX 77498
$-498
Cash flow
-8.7%
Cash-on-Cash Return
3.7%
Cap rate
0.7%
Rent to Value Ratio
Active
$288,000
3
bds
|
2
ba
|
1,680
sqft
|
built
1992
2902 Secluded Dr, Sugar Land, TX 77498
$-509
Cash flow
-9.2%
Cash-on-Cash Return
3.6%
Cap rate
0.7%
Rent to Value Ratio
Active
$319,000
3
bds
|
2
ba
|
1,762
sqft
|
built
2000
16310 Blossomwood Ln, Sugar Land, TX 77498
$-29
Cash flow
-0.5%
Cash-on-Cash Return
5.6%
Cap rate
0.7%
Rent to Value Ratio
Active
$479,888
4
bds
|
4
ba
|
3,542
sqft
|
built
2001
13226 Dusty Grove Ln, Sugar Land, TX 77498
$-1,232
Cash flow
-13.4%
Cash-on-Cash Return
2.6%
Cap rate
0.6%
Rent to Value Ratio

Active
$1,990,000
5
bds
|
6
ba
|
5,295
sqft
|
built
2019
11 Laurel Wreath Trl, Sugar Land, TX 77498
$-8,045
Cash flow
-21.1%
Cash-on-Cash Return
0.8%
Cap rate
0.4%
Rent to Value Ratio

Active
$569,000
4
bds
|
4
ba
|
3,033
sqft
|
built
2004
14415 Castlemaine Ct, Sugar Land, TX 77498
$-1,102
Cash flow
-10.1%
Cash-on-Cash Return
3.4%
Cap rate
0.6%
Rent to Value Ratio

Active
$640,000
5
bds
|
4
ba
|
4,237
sqft
|
built
2006
5203 Auckland Dr, Sugar Land, TX 77498
$-1,738
Cash flow
-14.2%
Cash-on-Cash Return
2.4%
Cap rate
0.5%
Rent to Value Ratio
Active
$439,900
4
bds
|
4
ba
|
3,334
sqft
|
built
1997
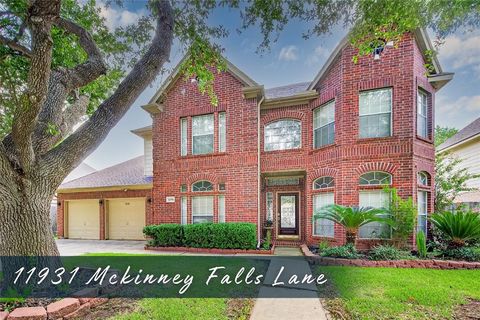
11931 Mc Kinney Falls Ln, Sugar Land, TX 77498
$-936
Cash flow
-11.1%
Cash-on-Cash Return
3.1%
Cap rate
0.6%
Rent to Value Ratio

Active
$329,000
3
bds
|
2
ba
|
2,209
sqft
|
built
2003
15318 Griggs Point Ln, Sugar Land, TX 77498
$-597
Cash flow
-9.5%
Cash-on-Cash Return
3.5%
Cap rate
0.7%
Rent to Value Ratio
Active
$370,000
4
bds
|
3
ba
|
2,173
sqft
|
built
1997
11823 Caprock Canyons Ln, Sugar Land, TX 77498
$-730
Cash flow
-10.3%
Cash-on-Cash Return
3.3%
Cap rate
0.7%
Rent to Value Ratio

Active
$299,900
4
bds
|
3
ba
|
2,417
sqft
|
built
1975
13702 Towne Way Dr, Sugar Land, TX 77498
$-476
Cash flow
-8.3%
Cash-on-Cash Return
3.8%
Cap rate
0.7%
Rent to Value Ratio

Active
$290,000
4
bds
|
2
ba
|
2,048
sqft
|
built
1976
13502 Knottinghill Dr, Sugar Land, TX 77498
$-339
Cash flow
-6.1%
Cash-on-Cash Return
4.3%
Cap rate
0.8%
Rent to Value Ratio

Active
$529,000
6
bds
|
5
ba
|
4,560
sqft
|
built
2003
13822 Blue Vista Dr, Sugar Land, TX 77498
$-1,180
Cash flow
-11.6%
Cash-on-Cash Return
3.0%
Cap rate
0.6%
Rent to Value Ratio

Active
$395,000
3
bds
|
2
ba
|
2,424
sqft
|
built
1983
815 Millpond Dr, Sugar Land, TX 77498
$-781
Cash flow
-10.3%
Cash-on-Cash Return
3.3%
Cap rate
0.6%
Rent to Value Ratio
Active
$339,000
4
bds
|
2
ba
|
1,988
sqft
|
built
1990
16318 Dawncrest Way, Sugar Land, TX 77498
$-560
Cash flow
-8.6%
Cash-on-Cash Return
3.7%
Cap rate
0.7%
Rent to Value Ratio
Active
$849,000
4
bds
|
4
ba
|
4,216
sqft
|
built
2007
934 Poydras St, Sugar Land, TX 77498
$-1,974
Cash flow
-12.1%
Cash-on-Cash Return
2.9%
Cap rate
0.5%
Rent to Value Ratio

Active
$359,999
4
bds
|
3
ba
|
2,260
sqft
|
built
1979
1819 Pinewood Ct, Sugar Land, TX 77498
$-651
Cash flow
-9.4%
Cash-on-Cash Return
3.5%
Cap rate
0.6%
Rent to Value Ratio

Active
$255,000
3
bds
|
2
ba
|
1,584
sqft
|
built
1976
10410 Cedartowne Ln, Sugar Land, TX 77498
$-389
Cash flow
-8.0%
Cash-on-Cash Return
3.8%
Cap rate
0.7%
Rent to Value Ratio

Active
$350,000
3
bds
|
3
ba
|
1,911
sqft
|
built
2003
16142 Crooked Arrow Dr, Sugar Land, TX 77498
$-738
Cash flow
-11.0%
Cash-on-Cash Return
3.1%
Cap rate
0.6%
Rent to Value Ratio
Active
$365,000
4
bds
|
3
ba
|
2,036
sqft
|
built
2013
14315 Branchwater Ln, Sugar Land, TX 77498
$-1,207
Cash flow
-17.3%
Cash-on-Cash Return
1.7%
Cap rate
0.6%
Rent to Value Ratio

Active
$289,900
3
bds
|
2
ba
|
1,625
sqft
|
built
1980
2322 Aprilmont Dr, Sugar Land, TX 77498
$-567
Cash flow
-10.2%
Cash-on-Cash Return
3.3%
Cap rate
0.7%
Rent to Value Ratio