77541 Investment Properties for Sale
Browse homes for sale and investment properties in 77541. Refine your search by price, property type, or more.
Best cash flowing properties in 77541

Active
$98,000
3
bds
|
1
ba
|
1,080
sqft
|
built
1950
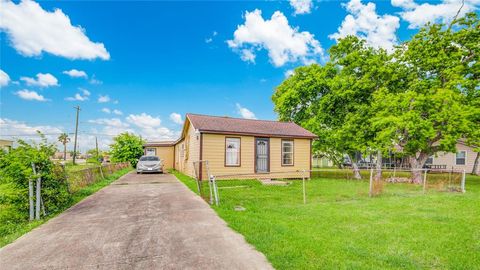
105 N Avenue D, Freeport, TX 77541
$345
Cash flow
18.4%
Cash-on-Cash Return
9.9%
Cap rate
1.4%
Rent to Value Ratio

Active
$119,900
3
bds
|
2
ba
|
1,656
sqft
|
built
1943
619 N Avenue C, Freeport, TX 77541
$180
Cash flow
7.8%
Cash-on-Cash Return
7.5%
Cap rate
1.2%
Rent to Value Ratio
207 out of 304 properties for sale in 77541
Limited Results Shown
Create a free account, or log in to reveal all property listings and enjoy the complete experience.
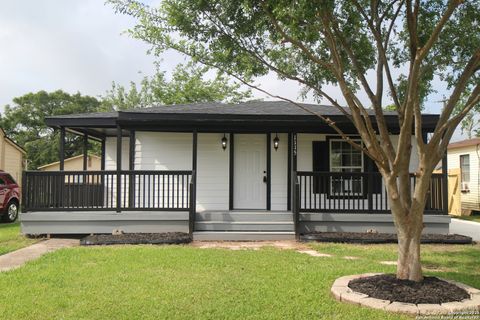
Active
$193,000
3
bds
|
1
ba
|
1,511
sqft
|
built
1942
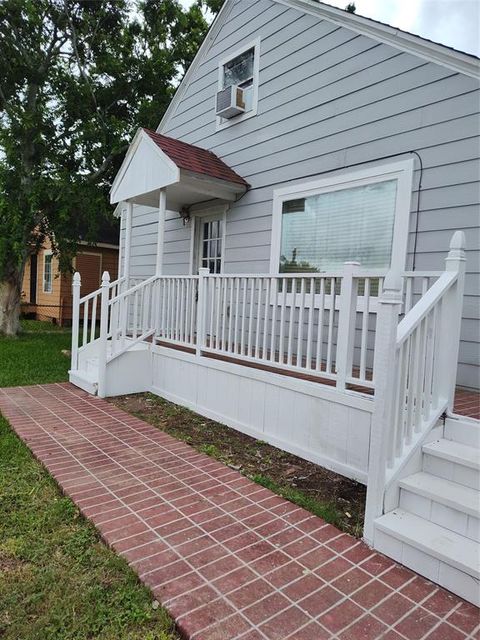
1115 W 4th St, Freeport, TX 77541
$-98
Cash flow
-2.6%
Cash-on-Cash Return
5.1%
Cap rate
0.7%
Rent to Value Ratio
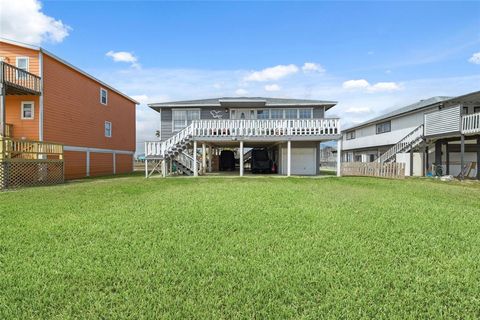
Active
$359,999
3
bds
|
2
ba
|
1,080
sqft
|
built
1965
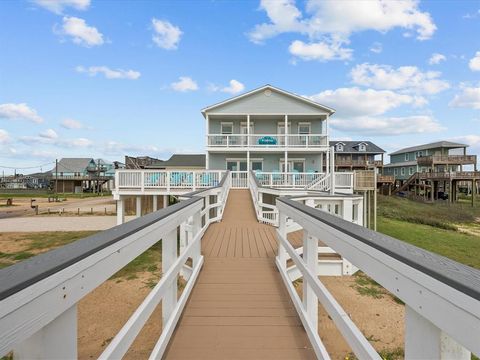
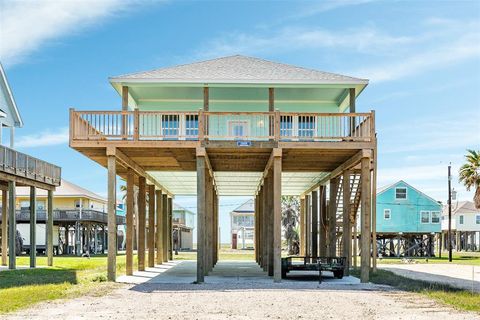
610 Seashell Dr, Surfside Beach, TX 77541
$-816
Cash flow
-11.8%
Cash-on-Cash Return
3.0%
Cap rate
0.6%
Rent to Value Ratio
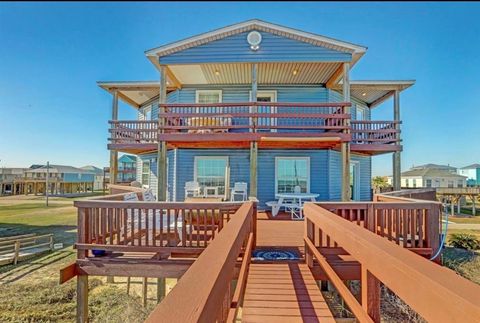
Active
$699,000
4
bds
|
4
ba
|
1,720
sqft
|
built
2007
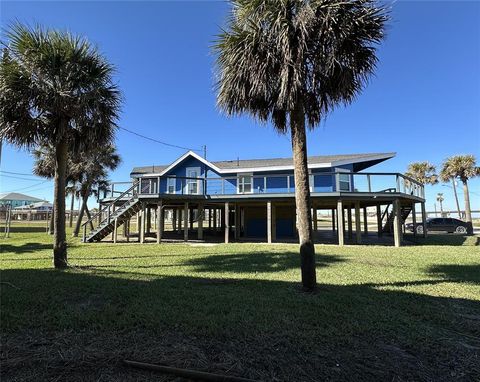
601 Wave Ct, Surfside Beach, TX 77541
$-1,435
Cash flow
-10.7%
Cash-on-Cash Return
3.2%
Cap rate
0.6%
Rent to Value Ratio
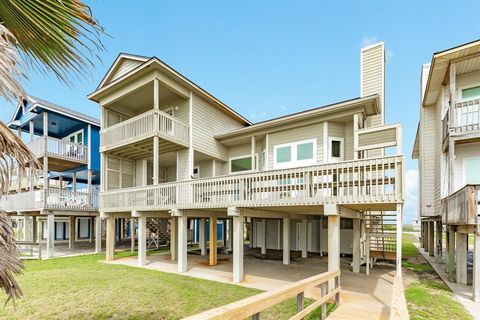
Active
$1,290,000
4
bds
|
4
ba
|
2,755
sqft
|
built
2005
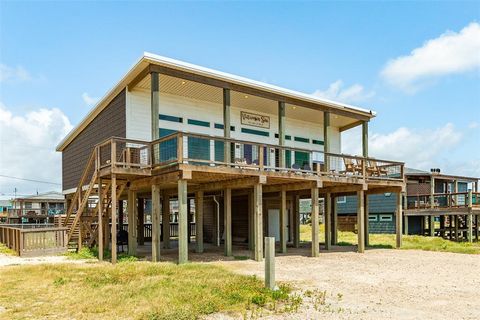
2330 Blue Water Hwy, Surfside Beach, TX 77541
$-4,980
Cash flow
-20.1%
Cash-on-Cash Return
1.0%
Cap rate
0.3%
Rent to Value Ratio
Active
$370,000
2
bds
|
3
ba
|
1,540
sqft
|
built
2018
915 Live Oak Dr, Jones Creek, TX 77541
$-708
Cash flow
-10.0%
Cash-on-Cash Return
3.4%
Cap rate
0.6%
Rent to Value Ratio
Active
$428,000
3
bds
|
3
ba
|
1,280
sqft
|
built
2018
126 Nesmith Pl, Surfside Beach, TX 77541
$-998
Cash flow
-12.2%
Cash-on-Cash Return
2.9%
Cap rate
0.6%
Rent to Value Ratio
Active
$410,000
3
bds
|
2
ba
|
1,104
sqft
|
built
2021
1310 Monument Dr, Surfside Beach, TX 77541
$-1,038
Cash flow
-13.2%
Cash-on-Cash Return
2.6%
Cap rate
0.5%
Rent to Value Ratio

Active
$170,000
3
bds
|
2
ba
|
1,201
sqft
|
built
1956
1510 W 11th St, Freeport, TX 77541
$-125
Cash flow
-3.8%
Cash-on-Cash Return
4.8%
Cap rate
0.8%
Rent to Value Ratio
Active
$395,900
3
bds
|
2
ba
|
1,152
sqft
|
built
2012
818 Surf Dr, Surfside Beach, TX 77541
$-957
Cash flow
-12.6%
Cash-on-Cash Return
2.8%
Cap rate
0.5%
Rent to Value Ratio
Active
$1,300,000
5
bds
|
4
ba
|
1,904
sqft
|
built
2014
106 Sand Dune Ct, Surfside Beach, TX 77541
$-4,013
Cash flow
-16.1%
Cash-on-Cash Return
2.0%
Cap rate
0.2%
Rent to Value Ratio

Active
$569,000
4
bds
|
3
ba
|
2,505
sqft
|
built
1972
6 Trout Ln, Oyster Creek, TX 77541
$-1,890
Cash flow
-17.3%
Cash-on-Cash Return
1.7%
Cap rate
0.4%
Rent to Value Ratio
Active
$143,559
2
bds
|
1
ba
|
1,040
sqft
|
built
1940
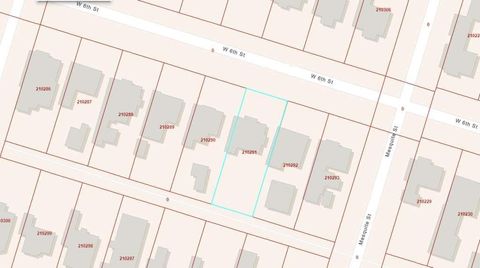
1311 W 6th St, Freeport, TX 77541
$52
Cash flow
1.9%
Cash-on-Cash Return
6.1%
Cap rate
1.0%
Rent to Value Ratio

Active
$359,000
3
bds
|
2
ba
|
960
sqft
|
built
1965
411 Seashell Dr, Surfside Beach, TX 77541
$-758
Cash flow
-11.0%
Cash-on-Cash Return
3.1%
Cap rate
0.6%
Rent to Value Ratio
Active
$355,000
3
bds
|
2
ba
|
1,548
sqft
|
built
1975
206 Beachcomber Ave, Surfside Beach, TX 77541
$-709
Cash flow
-10.4%
Cash-on-Cash Return
3.3%
Cap rate
0.6%
Rent to Value Ratio

Active
$184,900
4
bds
|
1
ba
|
1,400
sqft
|
built
1953
1006 W 9th St, Freeport, TX 77541
$-73
Cash flow
-2.1%
Cash-on-Cash Return
5.2%
Cap rate
0.9%
Rent to Value Ratio
Active
$139,900
3
bds
|
2
ba
|
1,412
sqft
|
built
1950
22 N Avenue D, Freeport, TX 77541
$138
Cash flow
5.1%
Cash-on-Cash Return
6.9%
Cap rate
1.0%
Rent to Value Ratio
Active
$650,000
5
bds
|
4
ba
|
1,952
sqft
|
built
2006
115 Southwind Dr, Surfside Beach, TX 77541
$-2,042
Cash flow
-16.4%
Cash-on-Cash Return
1.9%
Cap rate
0.5%
Rent to Value Ratio

Active
$530,000
3
bds
|
5
ba
|
1,680
sqft
|
built
1940
602 W 1st St, Freeport, TX 77541
$-1,701
Cash flow
-16.7%
Cash-on-Cash Return
1.8%
Cap rate
0.3%
Rent to Value Ratio
Active
$559,000
4
bds
|
4
ba
|
1,995
sqft
|
built
2005
206 Sand Dune Ct, Surfside Beach, TX 77541
$-1,366
Cash flow
-12.7%
Cash-on-Cash Return
2.7%
Cap rate
0.6%
Rent to Value Ratio
Active
$899,999
4
bds
|
5
ba
|
2,407
sqft
|
built
2016
107 Yucca Ave, Surfside Beach, TX 77541
$-2,575
Cash flow
-14.9%
Cash-on-Cash Return
2.2%
Cap rate
0.5%
Rent to Value Ratio
Active
$399,900
3
bds
|
2
ba
|
1,269
sqft
|
built
2015
2709 Swan Ct, Surfside Beach, TX 77541
$-1,290
Cash flow
-16.8%
Cash-on-Cash Return
1.8%
Cap rate
0.5%
Rent to Value Ratio
Active
$198,249
2
bds
|
1
ba
|
1,278
sqft
|
built
1936
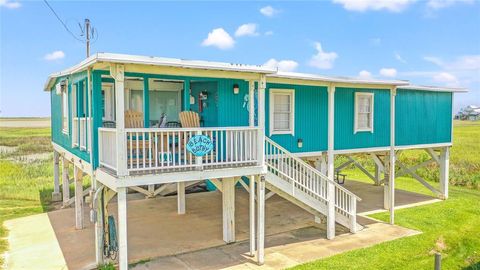
7103 Highway 36, Jones Creek, TX 77541
$-192
Cash flow
-5.1%
Cash-on-Cash Return
4.5%
Cap rate
0.7%
Rent to Value Ratio
Active
$374,900
2
bds
|
1
ba
|
1,064
sqft
|
built
1990
4619 Blue Water Hwy, Freeport, TX 77541
$-914
Cash flow
-12.7%
Cash-on-Cash Return
2.8%
Cap rate
0.5%
Rent to Value Ratio
Active
$650,000
3
bds
|
2
ba
|
1,140
sqft
|
built
1979
1654 Sandpebble Pl, Surfside Beach, TX 77541
$-2,174
Cash flow
-17.5%
Cash-on-Cash Return
1.7%
Cap rate
0.4%
Rent to Value Ratio

Active
$415,000
3
bds
|
2
ba
|
1,280
sqft
|
built
1978
119 Nesmith Pl, Surfside Beach, TX 77541
$-900
Cash flow
-11.3%
Cash-on-Cash Return
3.1%
Cap rate
0.6%
Rent to Value Ratio
Active
$389,000
3
bds
|
2
ba
|
1,624
sqft
|
built
1975
13114 Coronado Dr, Freeport, TX 77541
$-624
Cash flow
-8.4%
Cash-on-Cash Return
3.8%
Cap rate
0.7%
Rent to Value Ratio
Active
$534,900
3
bds
|
3
ba
|
1,500
sqft
|
built
2022
13019 Buccaneer Pkwy, Freeport, TX 77541
$-478
Cash flow
-4.7%
Cash-on-Cash Return
4.6%
Cap rate
0.6%
Rent to Value Ratio

Active
$375,000
2
bds
|
2
ba
|
1,508
sqft
|
built
1960
110 Ocean Ave, Surfside Beach, TX 77541
$-754
Cash flow
-10.5%
Cash-on-Cash Return
3.3%
Cap rate
0.6%
Rent to Value Ratio
Active
$548,800
3
bds
|
2
ba
|
1,678
sqft
|
built
1962
13135 Gulf Beach Dr, Freeport, TX 77541
$-1,164
Cash flow
-11.1%
Cash-on-Cash Return
3.1%
Cap rate
0.6%
Rent to Value Ratio
Active
$109,000
3
bds
|
2
ba
|
1,147
sqft
|
built
1941
527 W 6th St, Freeport, TX 77541
$35
Cash flow
1.7%
Cash-on-Cash Return
6.1%
Cap rate
1.1%
Rent to Value Ratio

Active
$315,000
2
bds
|
2
ba
|
1,050
sqft
|
built
1962
223 Leeward Way, Freeport, TX 77541
$-587
Cash flow
-9.7%
Cash-on-Cash Return
3.4%
Cap rate
0.6%
Rent to Value Ratio
Active
$640,000
3
bds
|
2
ba
|
1,428
sqft
|
built
2018
706 Beach Dr, Surfside Beach, TX 77541
$-2,562
Cash flow
-20.9%
Cash-on-Cash Return
0.9%
Cap rate
0.3%
Rent to Value Ratio
Active
$1,200,000
4
bds
|
3
ba
|
1,224
sqft
|
built
2000
606 Canal Dr, Surfside Beach, TX 77541
$-2,574
Cash flow
-11.2%
Cash-on-Cash Return
3.1%
Cap rate
0.4%
Rent to Value Ratio
Active
$329,000
3
bds
|
2
ba
|
1,006
sqft
|
built
1975
13131 Buccaneer Pkwy, Freeport, TX 77541
$-493
Cash flow
-7.8%
Cash-on-Cash Return
3.9%
Cap rate
0.7%
Rent to Value Ratio

Active
$680,000
3
bds
|
4
ba
|
2,690
sqft
|
built
2019
229 S Front St, Freeport, TX 77541
$-1,347
Cash flow
-10.3%
Cash-on-Cash Return
3.3%
Cap rate
0.6%
Rent to Value Ratio
Active
$334,900
2
bds
|
2
ba
|
1,102
sqft
|
built
1962
101 Pelican Pl, Surfside Beach, TX 77541
$-181
Cash flow
-2.8%
Cash-on-Cash Return
5.0%
Cap rate
0.7%
Rent to Value Ratio
Active
$840,000
4
bds
|
5
ba
|
2,789
sqft
|
built
2021
12926 Coronado Dr, Freeport, TX 77541
$-804
Cash flow
-5.0%
Cash-on-Cash Return
4.5%
Cap rate
0.8%
Rent to Value Ratio
Active
$325,000
2
bds
|
2
ba
|
960
sqft
|
built
1965
402 Seashell Dr, Surfside Beach, TX 77541
$-551
Cash flow
-8.8%
Cash-on-Cash Return
3.6%
Cap rate
0.7%
Rent to Value Ratio