77541 Investment Properties for Sale
Browse homes for sale and investment properties in 77541. Refine your search by price, property type, or more.
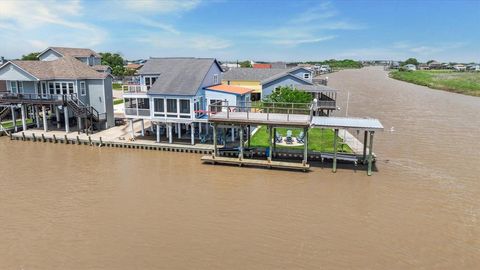
Best cash flowing properties in 77541
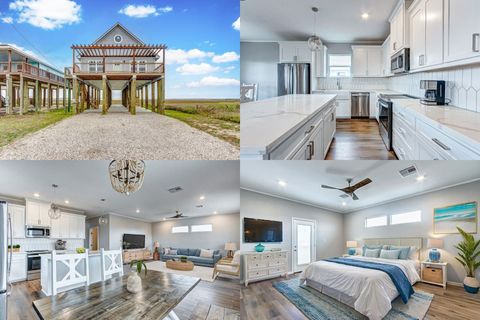
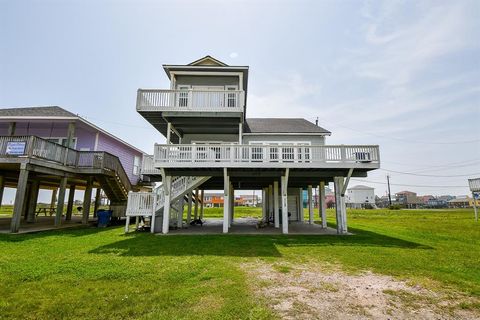
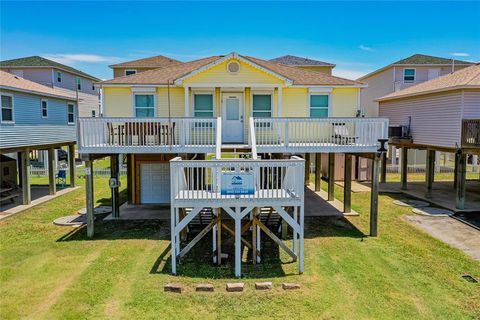
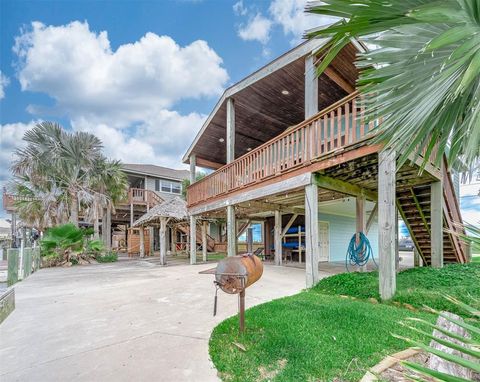
Active
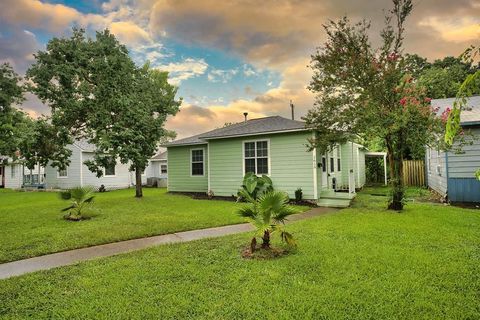
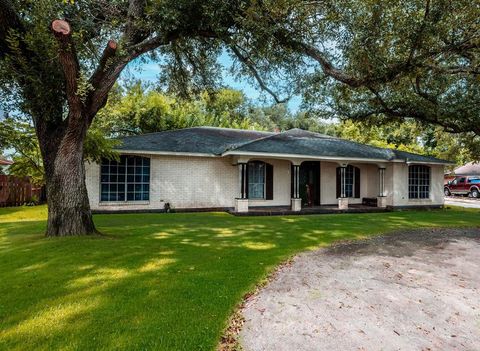
$178,000
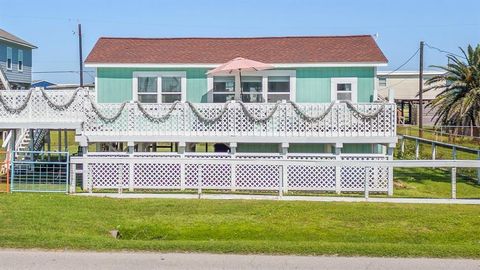
3
bds
|
1
ba
|
1,211
sqft
|
built
1942
1619 W 8th St, Freeport, TX 77541
$262
Cash flow
7.7%
Cash-on-Cash Return
7.4%
Cap rate
0.9%
Rent to Value Ratio
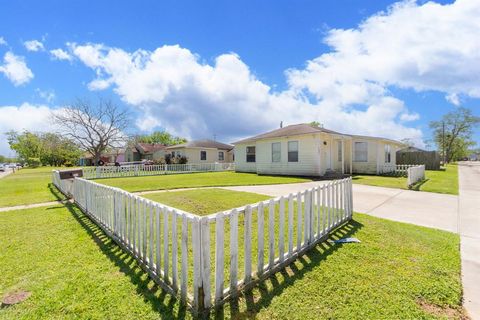
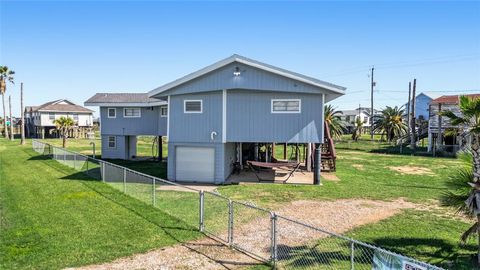
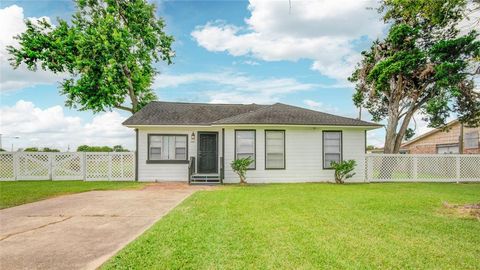
Active
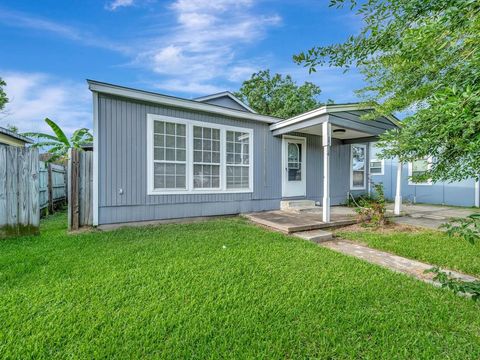
$146,500
4
bds
|
1
ba
|
1,493
sqft
|
built
1942
1231 W 7th St, Freeport, TX 77541
$29
Cash flow
1.0%
Cash-on-Cash Return
5.9%
Cap rate
1.0%
Rent to Value Ratio
195 out of 237 properties for sale in 77541
Limited Results Shown
Create a free account, or log in to reveal all property listings and enjoy the complete experience.
Active
$350,000
2
bds
|
2
ba
|
849
sqft
|
built
1965
702 Seashell Dr, Surfside Beach, TX 77541
$-659
Cash flow
-9.8%
Cash-on-Cash Return
3.4%
Cap rate
0.6%
Rent to Value Ratio
Active
$459,000
2
bds
|
2
ba
|
912
sqft
|
built
2019
116 Howard Ave, Surfside Beach, TX 77541
$-2,191
Cash flow
-24.9%
Cash-on-Cash Return
0.0%
Cap rate
0.3%
Rent to Value Ratio
Active
$267,000
2
bds
|
1
ba
|
512
sqft
|
built
1955
1010 Fort Velasco Dr, Surfside Beach, TX 77541
$-463
Cash flow
-9.0%
Cash-on-Cash Return
3.6%
Cap rate
0.6%
Rent to Value Ratio
Active
$250,000
3
bds
|
2
ba
|
2,450
sqft
|
built
1972
409 S Avenue C, Freeport, TX 77541
$-494
Cash flow
-10.3%
Cash-on-Cash Return
3.3%
Cap rate
0.7%
Rent to Value Ratio
Active
$349,000
3
bds
|
2
ba
|
1,056
sqft
|
built
2005
424 Angel Wing St, Surfside Beach, TX 77541
$-760
Cash flow
-11.4%
Cash-on-Cash Return
3.1%
Cap rate
0.6%
Rent to Value Ratio

Active
$649,900
5
bds
|
4
ba
|
2,120
sqft
|
built
1970
123 Pieces Of Eight, Freeport, TX 77541
$-1,041
Cash flow
-8.4%
Cash-on-Cash Return
3.8%
Cap rate
0.6%
Rent to Value Ratio
Active
$375,000
3
bds
|
2
ba
|
1,517
sqft
|
built
2001
111 Sand Shoals Rd, Freeport, TX 77541
$-782
Cash flow
-10.9%
Cash-on-Cash Return
3.2%
Cap rate
0.6%
Rent to Value Ratio
Active
$235,900
4
bds
|
3
ba
|
2,543
sqft
|
built
1970
1856 Acacia Cir, Freeport, TX 77541
$-189
Cash flow
-4.2%
Cash-on-Cash Return
4.7%
Cap rate
0.8%
Rent to Value Ratio
Active
$175,000
5
bds
|
3
ba
|
1,844
sqft
|
built
1940
1214 W 6th St, Freeport, TX 77541
$-159
Cash flow
-4.7%
Cash-on-Cash Return
4.6%
Cap rate
0.8%
Rent to Value Ratio
Active
$550,000
1
bds
|
2
ba
|
832
sqft
|
built
1950
522 Surf Dr, Surfside Beach, TX 77541
$-1,499
Cash flow
-14.2%
Cash-on-Cash Return
2.4%
Cap rate
0.3%
Rent to Value Ratio
Active
$299,000
1
bds
|
1
ba
|
504
sqft
|
built
1960
123 Sandpiper Ave, Surfside Beach, TX 77541
$-737
Cash flow
-12.9%
Cash-on-Cash Return
2.7%
Cap rate
0.4%
Rent to Value Ratio
Active
$475,000
3
bds
|
2
ba
|
1,676
sqft
|
built
2022
1743 Blue Water Hwy, Surfside Beach, TX 77541
$-1,744
Cash flow
-19.2%
Cash-on-Cash Return
1.3%
Cap rate
0.5%
Rent to Value Ratio
Active
$150,000
2
bds
|
2
ba
|
816
sqft
|
built
1955
415 Oyster St, Surfside Beach, TX 77541
$22
Cash flow
0.8%
Cash-on-Cash Return
5.9%
Cap rate
1.1%
Rent to Value Ratio
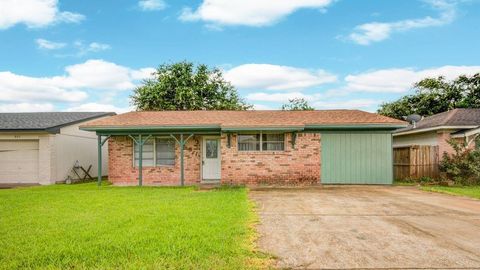
Active
$135,000
3
bds
|
2
ba
|
1,072
sqft
|
built
1950
301 N Avenue D, Freeport, TX 77541
$-96
Cash flow
-3.7%
Cash-on-Cash Return
4.8%
Cap rate
0.8%
Rent to Value Ratio

Active
$249,900
3
bds
|
4
ba
|
1,224
sqft
|
built
1982
9 Flounder Cir, Freeport, TX 77541
$-351
Cash flow
-7.3%
Cash-on-Cash Return
4.0%
Cap rate
0.6%
Rent to Value Ratio
Active
$299,900
3
bds
|
2
ba
|
1,552
sqft
|
built
1965
323 Texas St, Surfside Beach, TX 77541
$-735
Cash flow
-12.8%
Cash-on-Cash Return
2.7%
Cap rate
0.6%
Rent to Value Ratio
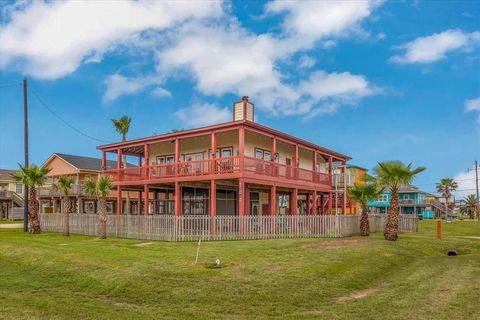
Active
$599,000
3
bds
|
2
ba
|
1,617
sqft
|
built
2007
115 Mar Vista Ct, Surfside Beach, TX 77541
$-1,961
Cash flow
-17.1%
Cash-on-Cash Return
1.8%
Cap rate
0.4%
Rent to Value Ratio
Active
$449,800
2
bds
|
2
ba
|
1,220
sqft
|
built
1962
219 Fort Velasco Dr, Surfside Beach, TX 77541
$-1,178
Cash flow
-13.7%
Cash-on-Cash Return
2.5%
Cap rate
0.6%
Rent to Value Ratio
Active
$169,900
2
bds
|
1
ba
|
814
sqft
|
built
1955
419 Murex St, Surfside Beach, TX 77541
$-24
Cash flow
-0.7%
Cash-on-Cash Return
5.5%
Cap rate
0.8%
Rent to Value Ratio
Active
$399,000
3
bds
|
2
ba
|
1,000
sqft
|
built
2003
904 Surf Dr, Surfside Beach, TX 77541
$-1,106
Cash flow
-14.5%
Cash-on-Cash Return
2.4%
Cap rate
0.6%
Rent to Value Ratio
Active
$599,000
4
bds
|
4
ba
|
2,140
sqft
|
built
1986
395 Redfish Dr, Freeport, TX 77541
$-1,508
Cash flow
-13.1%
Cash-on-Cash Return
2.7%
Cap rate
0.5%
Rent to Value Ratio
Active
$514,900
3
bds
|
2
ba
|
1,206
sqft
|
built
2021
130 Beachcomber Ave, Surfside Beach, TX 77541
$-1,610
Cash flow
-16.3%
Cash-on-Cash Return
1.9%
Cap rate
0.4%
Rent to Value Ratio
Active
$425,000
3
bds
|
2
ba
|
1,176
sqft
|
built
2020
203 Sea Oats Dr, Surfside Beach, TX 77541
$-299
Cash flow
-3.7%
Cash-on-Cash Return
4.8%
Cap rate
0.6%
Rent to Value Ratio
Active
$500,000
4
bds
|
3
ba
|
1,684
sqft
|
built
2005
13011 Coronado Dr, Freeport, TX 77541
$-1,186
Cash flow
-12.4%
Cash-on-Cash Return
2.8%
Cap rate
0.6%
Rent to Value Ratio
Active
$549,900
3
bds
|
2
ba
|
1,202
sqft
|
built
1984
814 Beach Dr, Surfside Beach, TX 77541
$-1,622
Cash flow
-15.4%
Cash-on-Cash Return
2.1%
Cap rate
0.5%
Rent to Value Ratio
Active
$379,000
2
bds
|
1
ba
|
704
sqft
|
built
1950
610 Surf Dr, Surfside Beach, TX 77541
$-1,167
Cash flow
-16.1%
Cash-on-Cash Return
2.0%
Cap rate
0.4%
Rent to Value Ratio

Active
$515,000
3
bds
|
2
ba
|
1,762
sqft
|
built
1964
305 Ocean Blvd, Freeport, TX 77541
$-1,483
Cash flow
-15.0%
Cash-on-Cash Return
2.2%
Cap rate
0.5%
Rent to Value Ratio
Active
$455,000
3
bds
|
3
ba
|
1,270
sqft
|
built
2014
123 Howard Ave, Surfside Beach, TX 77541
$-1,102
Cash flow
-12.6%
Cash-on-Cash Return
2.8%
Cap rate
0.5%
Rent to Value Ratio

Active
$220,000
2
bds
|
1
ba
|
728
sqft
|
built
1976
13106 Coronado Dr, Freeport, TX 77541
$-14
Cash flow
-0.3%
Cash-on-Cash Return
5.6%
Cap rate
0.9%
Rent to Value Ratio
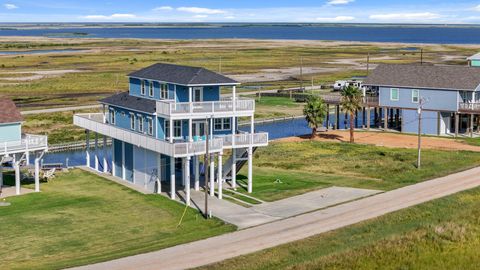
Active
$385,000
4
bds
|
2
ba
|
1,480
sqft
|
built
1970
104 Marlin Ln, Freeport, TX 77541
$-940
Cash flow
-12.7%
Cash-on-Cash Return
2.7%
Cap rate
0.5%
Rent to Value Ratio

Active
$625,000
6
bds
|
5
ba
|
3,223
sqft
|
built
2013
223 S Front St, Freeport, TX 77541
$-329
Cash flow
-2.7%
Cash-on-Cash Return
5.0%
Cap rate
0.9%
Rent to Value Ratio
Active
$444,900
3
bds
|
2
ba
|
1,050
sqft
|
built
2011
81 Santar Loop, Surfside Beach, TX 77541
$-587
Cash flow
-6.9%
Cash-on-Cash Return
4.1%
Cap rate
0.5%
Rent to Value Ratio
Active
$465,000
3
bds
|
2
ba
|
1,408
sqft
|
built
2004
702 Surf Dr, Surfside Beach, TX 77541
$-1,072
Cash flow
-12.0%
Cash-on-Cash Return
2.9%
Cap rate
0.5%
Rent to Value Ratio
Active
$159,900
4
bds
|
1
ba
|
1,572
sqft
|
built
1955
811 W 7th St, Freeport, TX 77541
$-58
Cash flow
-1.9%
Cash-on-Cash Return
5.2%
Cap rate
0.9%
Rent to Value Ratio
Active
$799,900
4
bds
|
3
ba
|
2,064
sqft
|
built
2019
405 Pompano Dr, Freeport, TX 77541
$-2,365
Cash flow
-15.4%
Cash-on-Cash Return
2.1%
Cap rate
0.4%
Rent to Value Ratio
Active
$365,000
2
bds
|
2
ba
|
816
sqft
|
built
1975
211 Anchor Dr, Freeport, TX 77541
$-851
Cash flow
-12.2%
Cash-on-Cash Return
2.9%
Cap rate
0.6%
Rent to Value Ratio
Active
$165,000
3
bds
|
2
ba
|
1,352
sqft
|
built
1960
1805 N Avenue Q, Freeport, TX 77541
$-20
Cash flow
-0.6%
Cash-on-Cash Return
5.5%
Cap rate
0.9%
Rent to Value Ratio
Active
$329,900
3
bds
|
2
ba
|
1,260
sqft
|
built
1979
1571 Blue Water Dr, Freeport, TX 77541
$-851
Cash flow
-13.5%
Cash-on-Cash Return
2.6%
Cap rate
0.6%
Rent to Value Ratio