77630 Investment Properties for Sale
Browse homes for sale and investment properties in 77630. Refine your search by price, property type, or more.
Best cash flowing properties in 77630
Active
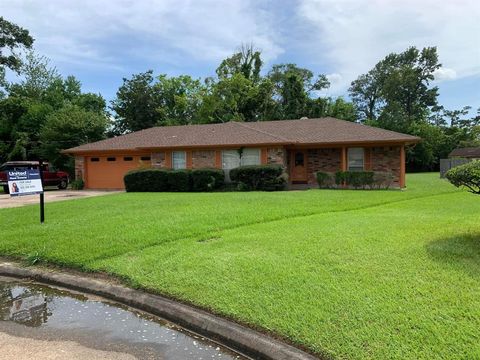
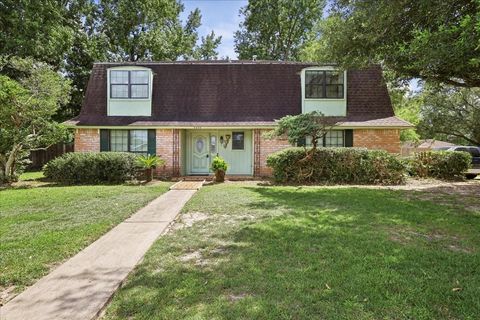
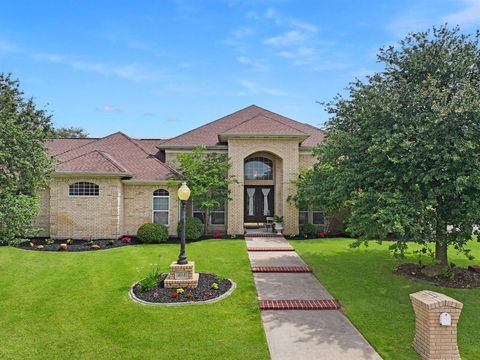
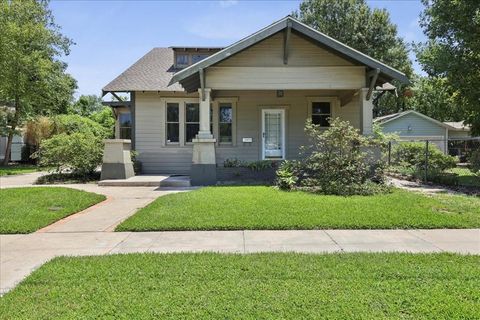
$275,000
6
bds
|
3
ba
|
3,194
sqft
|
built
1976
2800 Country Club Dr, Orange, TX 77630
$2,494
Cash flow
47.3%
Cash-on-Cash Return
16.6%
Cap rate
2.0%
Rent to Value Ratio
Active
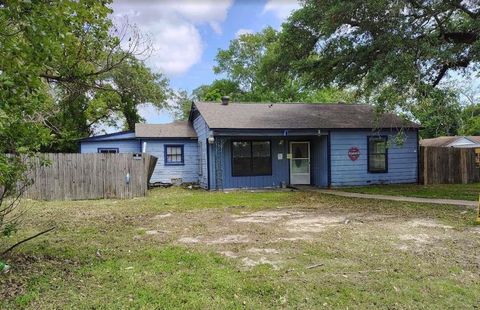
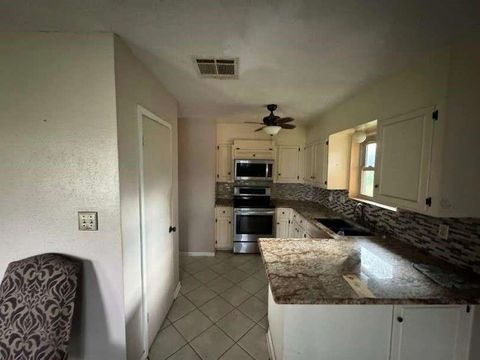
$65,000
3
bds
|
2
ba
|
1,424
sqft
|
built
1957
6168 Inez Ave, Orange, TX 77630
$889
Cash flow
15.9%
Cash-on-Cash Return
16.4%
Cap rate
2.0%
Rent to Value Ratio
36 out of 44 properties for sale in 77630
Limited Results Shown
Create a free account, or log in to reveal all property listings and enjoy the complete experience.

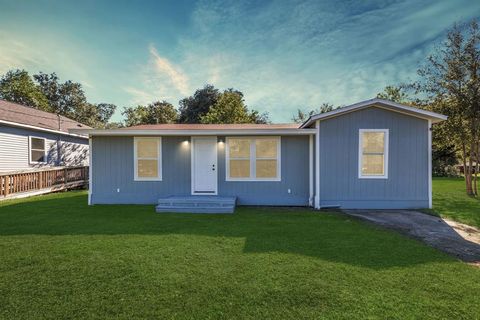
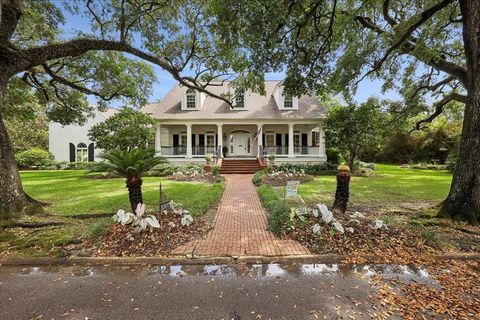
Active
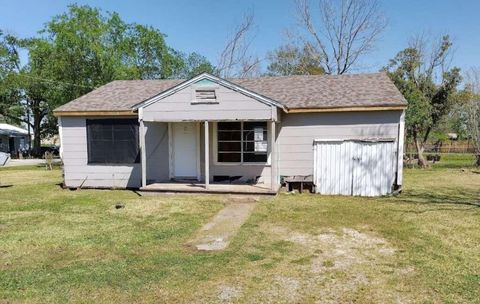
$112,200
3
bds
|
1
ba
|
1,410
sqft
|
built
1954
13 Byron Rd, Orange, TX 77630
$128
Cash flow
6.0%
Cash-on-Cash Return
7.0%
Cap rate
1.1%
Rent to Value Ratio
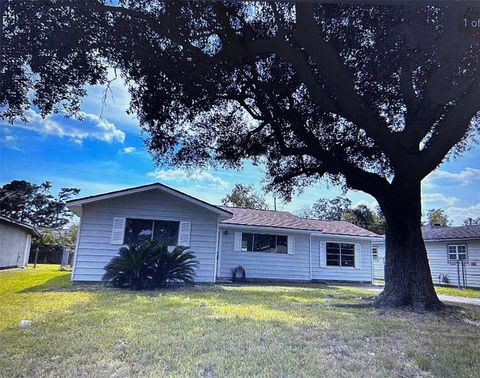
Active
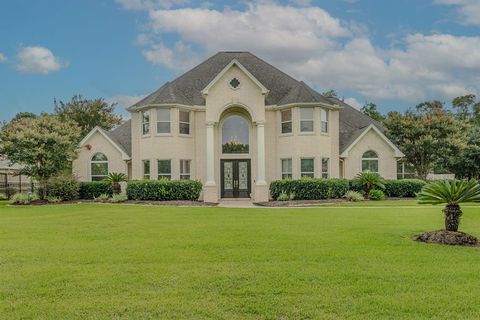
$93,500
2
bds
|
1
ba
|
1,050
sqft
|
built
1930
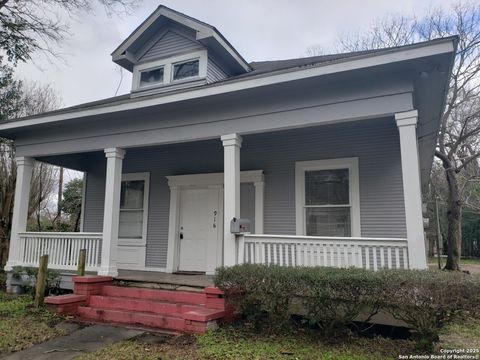
916 5th St, Orange, TX 77630
$338
Cash flow
18.9%
Cash-on-Cash Return
10.0%
Cap rate
1.4%
Rent to Value Ratio

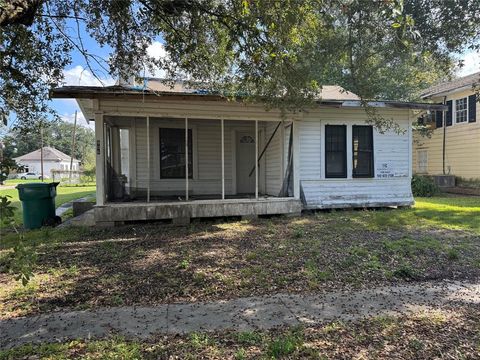
Active
$159,500
4
bds
|
2
ba
|
1,660
sqft
|
built
1940
906 W Scott St, Orange, TX 77630
$-679
Cash flow
-22.2%
Cash-on-Cash Return
0.6%
Cap rate
1.0%
Rent to Value Ratio

Active
$75,999
1
bds
|
1
ba
|
536
sqft
|
built
1969
1205 Rein Ave, Orange, TX 77630
$246
Cash flow
16.9%
Cash-on-Cash Return
9.6%
Cap rate
1.3%
Rent to Value Ratio
Active
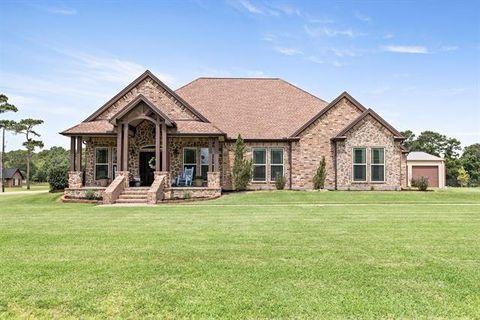
$269,900
3
bds
|
3
ba
|
2,242
sqft
|
built
1960
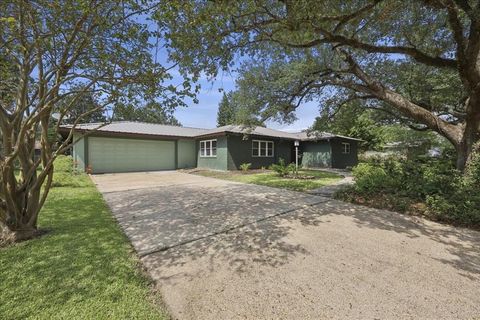
2140 Live Oak Rd, Orange, TX 77630
$-383
Cash flow
-7.4%
Cash-on-Cash Return
4.0%
Cap rate
0.7%
Rent to Value Ratio

Active
$699,900
5
bds
|
5
ba
|
4,087
sqft
|
built
1995
302 Waterwood Dr, Orange, TX 77630
$-2,716
Cash flow
-20.2%
Cash-on-Cash Return
1.0%
Cap rate
0.3%
Rent to Value Ratio
Active
$165,000
3
bds
|
2
ba
|
1,691
sqft
|
built
1977
2017 5th St, Orange, TX 77630
$-9
Cash flow
-0.3%
Cash-on-Cash Return
5.6%
Cap rate
1.0%
Rent to Value Ratio
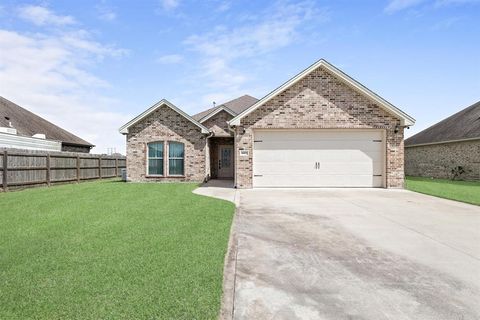
Active
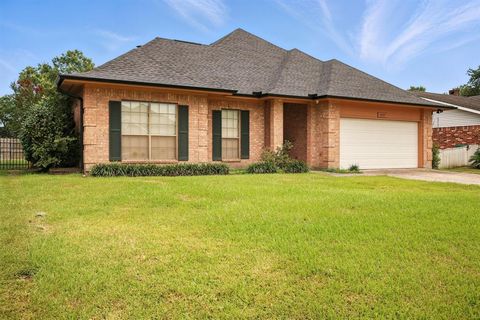
$259,000
3
bds
|
2
ba
|
1,819
sqft
|
built
2018
4403 Persimmon Cir, Orange, TX 77630
$-336
Cash flow
-6.8%
Cash-on-Cash Return
4.1%
Cap rate
0.8%
Rent to Value Ratio
Active
$150,000
3
bds
|
1
ba
|
1,038
sqft
|
built
1949
1112 8th St, Orange, TX 77630
$260
Cash flow
9.0%
Cash-on-Cash Return
7.8%
Cap rate
1.1%
Rent to Value Ratio

Active
$369,900
4
bds
|
3
ba
|
3,414
sqft
|
built
2005
305 Tyler Dr, Orange, TX 77630
$-605
Cash flow
-8.5%
Cash-on-Cash Return
3.7%
Cap rate
0.7%
Rent to Value Ratio
Active
$25,000
2
bds
|
1
ba
|
1,074
sqft
|
built
1925
906 6th St, Orange, TX 77630
$621
Cash flow
28.9%
Cash-on-Cash Return
29.8%
Cap rate
3.6%
Rent to Value Ratio
Active
$189,900
4
bds
|
3
ba
|
2,849
sqft
|
built
1971
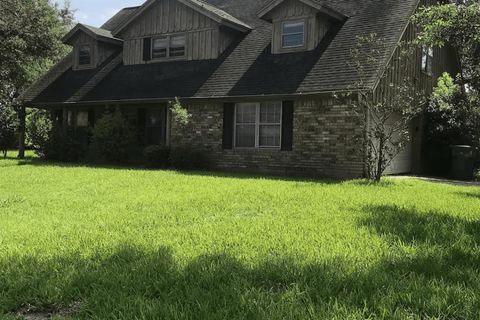
3335 Old Castle Ln, Orange, TX 77630
$-117
Cash flow
-3.2%
Cash-on-Cash Return
4.9%
Cap rate
0.9%
Rent to Value Ratio
Active
$559,900
4
bds
|
3
ba
|
2,891
sqft
|
built
2014
1830 Langham Forest Blvd, Orange, TX 77630
$-1,531
Cash flow
-14.3%
Cash-on-Cash Return
2.4%
Cap rate
0.5%
Rent to Value Ratio
Active
$222,500
3
bds
|
2
ba
|
2,211
sqft
|
built
1989
2517 Thunderbird Dr, Orange, TX 77630
$-386
Cash flow
-9.1%
Cash-on-Cash Return
3.6%
Cap rate
0.8%
Rent to Value Ratio
Active
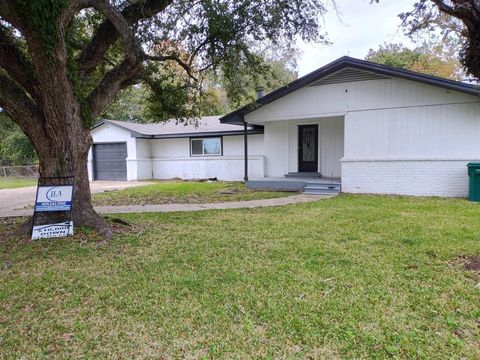
$110,000
3
bds
|
1
ba
|
1,533
sqft
|
built
1952
510 W Decatur Ave, Orange, TX 77630
$158
Cash flow
7.5%
Cash-on-Cash Return
7.4%
Cap rate
1.2%
Rent to Value Ratio

Active
$209,900
4
bds
|
4
ba
|
3,244
sqft
|
built
1979
1625 Lindenwood Dr, Orange, TX 77630
$387
Cash flow
9.6%
Cash-on-Cash Return
7.9%
Cap rate
1.0%
Rent to Value Ratio
Active
$549,999
3
bds
|
3
ba
|
2,833
sqft
|
built
1998
404 Pintail Ln, Orange, TX 77630
$-1,563
Cash flow
-14.8%
Cash-on-Cash Return
2.3%
Cap rate
0.5%
Rent to Value Ratio
Active
$56,249
3
bds
|
2
ba
|
1,571
sqft
|
built
1950
2241 Cross Ln, Orange, TX 77630
$675
Cash flow
14.0%
Cash-on-Cash Return
14.4%
Cap rate
1.8%
Rent to Value Ratio
Active
$59,349
3
bds
|
1
ba
|
948
sqft
|
built
1951
803 Chester St, West Orange, TX 77630
$576
Cash flow
11.3%
Cash-on-Cash Return
11.6%
Cap rate
1.5%
Rent to Value Ratio
Active
$708,750
3
bds
|
5
ba
|
4,788
sqft
|
built
2003
9010 Taylor Cir, Orange, TX 77630
$-2,471
Cash flow
-18.2%
Cash-on-Cash Return
1.5%
Cap rate
0.4%
Rent to Value Ratio
Active
$143,900
4
bds
|
2
ba
|
1,750
sqft
|
built
1960
545 Gardenia Ave, Orange, TX 77630
$310
Cash flow
11.2%
Cash-on-Cash Return
8.3%
Cap rate
1.1%
Rent to Value Ratio
Active
$149,500
2
bds
|
1
ba
|
672
sqft
|
built
1954
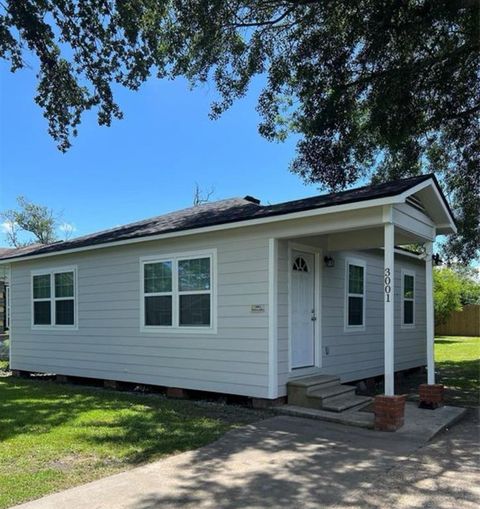
3001 Austin St, West Orange, TX 77630
$-39
Cash flow
-1.4%
Cash-on-Cash Return
5.4%
Cap rate
0.7%
Rent to Value Ratio
Active
$54,999
2
bds
|
1
ba
|
1,704
sqft
|
built
1941
2006 2nd St, Orange, TX 77630
$702
Cash flow
14.9%
Cash-on-Cash Return
15.3%
Cap rate
2.0%
Rent to Value Ratio
Active
$124,900
3
bds
|
2
ba
|
1,368
sqft
|
built
1950
2227 Westway St, Orange, TX 77630
$11
Cash flow
0.5%
Cash-on-Cash Return
5.8%
Cap rate
0.9%
Rent to Value Ratio
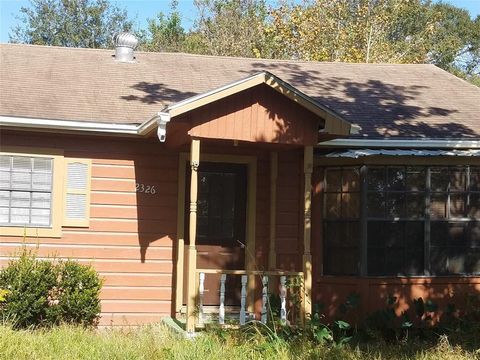
Active
$49,000
3
bds
|
2
ba
|
1,457
sqft
|
built
1950
2326 Houston St, West Orange, TX 77630
$682
Cash flow
16.2%
Cash-on-Cash Return
16.7%
Cap rate
2.2%
Rent to Value Ratio
Active
$119,900
2
bds
|
2
ba
|
1,482
sqft
|
built
2018
1802 29th St, Orange, TX 77630
$187
Cash flow
8.1%
Cash-on-Cash Return
7.5%
Cap rate
1.3%
Rent to Value Ratio
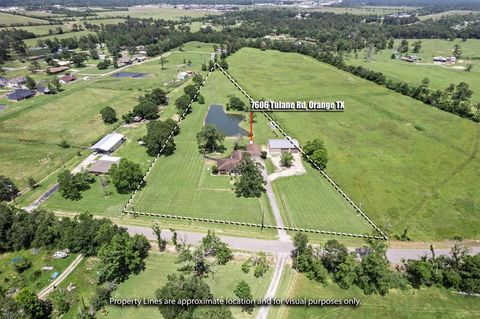
Active
$489,900
3
bds
|
3
ba
|
2,670
sqft
|
built
1976
7606 Tulane Rd, Orange, TX 77630
$-524
Cash flow
-5.6%
Cash-on-Cash Return
4.4%
Cap rate
0.5%
Rent to Value Ratio
Active
$255,000
4
bds
|
3
ba
|
2,205
sqft
|
built
1975
3010 Kelly St, West Orange, TX 77630
$-329
Cash flow
-6.7%
Cash-on-Cash Return
4.1%
Cap rate
0.7%
Rent to Value Ratio
Active
$224,900
3
bds
|
2
ba
|
2,499
sqft
|
built
1930
507 W Orange Ave, Orange, TX 77630
$109
Cash flow
2.5%
Cash-on-Cash Return
6.3%
Cap rate
1.0%
Rent to Value Ratio
Active
$169,999
3
bds
|
2
ba
|
1,121
sqft
|
built
1978
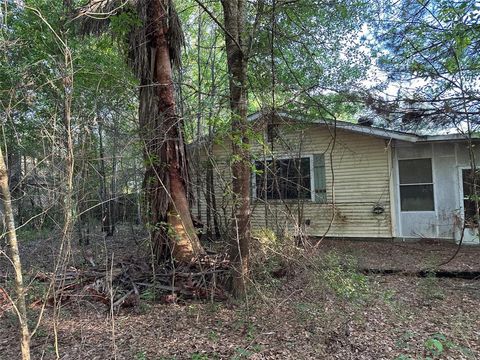
718 Westbury St, West Orange, TX 77630
$-41
Cash flow
-1.3%
Cash-on-Cash Return
5.4%
Cap rate
0.8%
Rent to Value Ratio
Active
$499,900
4
bds
|
4
ba
|
3,871
sqft
|
built
2000
1007 Pine Ave, Orange, TX 77630
$-1,442
Cash flow
-15.0%
Cash-on-Cash Return
2.2%
Cap rate
0.5%
Rent to Value Ratio
Active
$130,000
3
bds
|
1
ba
|
1,360
sqft
|
built
1962
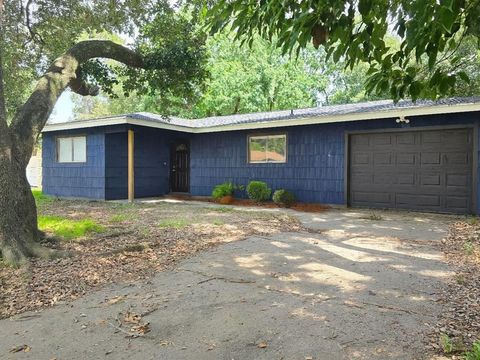
3615 Edgemont Dr, Orange, TX 77630
$213
Cash flow
8.5%
Cash-on-Cash Return
7.6%
Cap rate
0.9%
Rent to Value Ratio
Active
$219,500
3
bds
|
2
ba
|
1,799
sqft
|
built
1991
2514 Thunderbird Dr, Orange, TX 77630
$-246
Cash flow
-5.8%
Cash-on-Cash Return
4.3%
Cap rate
0.8%
Rent to Value Ratio
Active
$189,900
2
bds
|
2
ba
|
1,701
sqft
|
built
1915
606 W Cherry Ave, Orange, TX 77630
$233
Cash flow
6.4%
Cash-on-Cash Return
7.2%
Cap rate
1.1%
Rent to Value Ratio