78240 Investment Properties for Sale
Browse homes for sale and investment properties in 78240. Refine your search by price, property type, or more.
Best cash flowing properties in 78240
Active
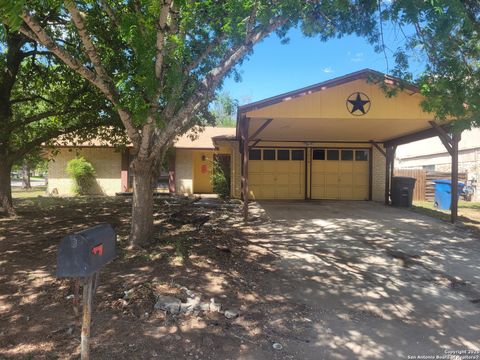
$221,000
4
bds
|
2
ba
|
1,808
sqft
|
built
1977
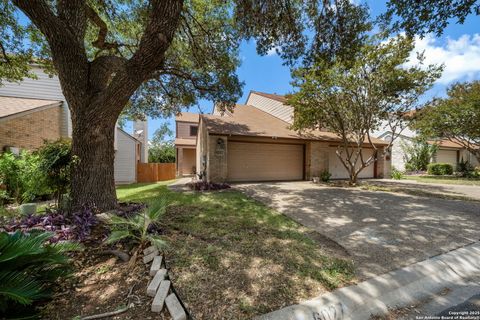
7014 Gary Player St, San Antonio, TX 78240
$196
Cash flow
4.6%
Cash-on-Cash Return
6.7%
Cap rate
0.8%
Rent to Value Ratio
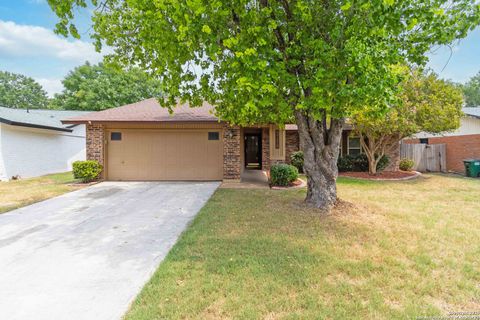
Active
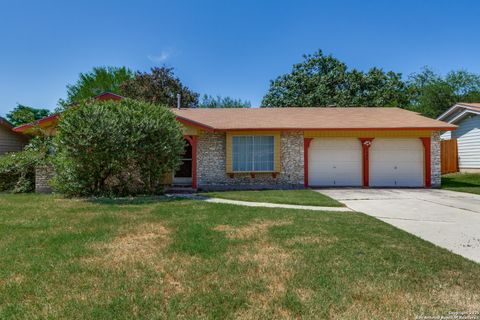
$207,500
3
bds
|
2
ba
|
1,543
sqft
|
built
1966
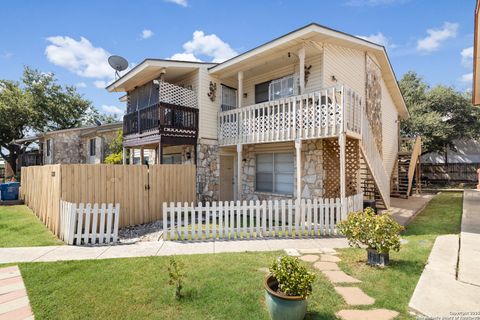
5606 Ponderosa Dr, San Antonio, TX 78240
$-271
Cash flow
-6.8%
Cash-on-Cash Return
4.1%
Cap rate
0.9%
Rent to Value Ratio
83 out of 101 properties for sale in 78240
Limited Results Shown
Create a free account, or log in to reveal all property listings and enjoy the complete experience.
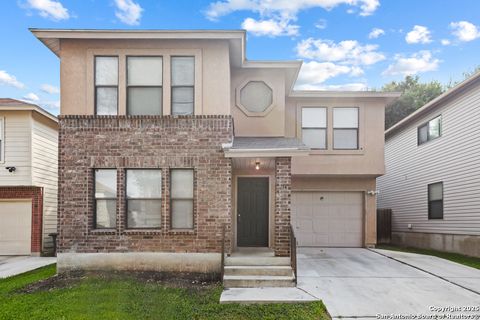
Active
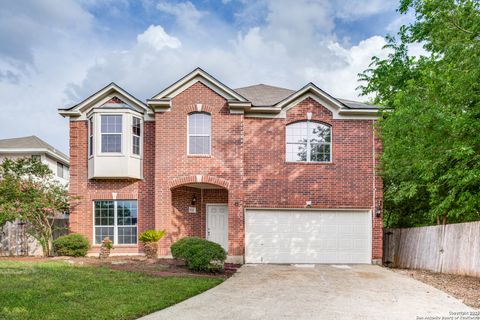
$387,799
4
bds
|
3
ba
|
2,980
sqft
|
built
1996
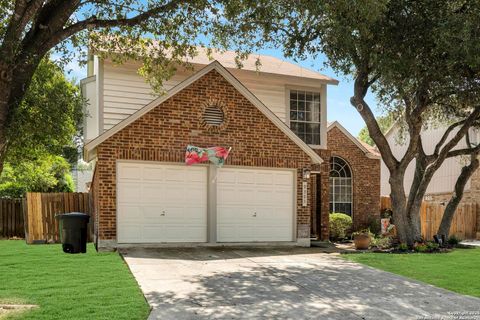
9002 Maggie Ct, San Antonio, TX 78240
$-918
Cash flow
-12.4%
Cash-on-Cash Return
2.8%
Cap rate
0.6%
Rent to Value Ratio

Active
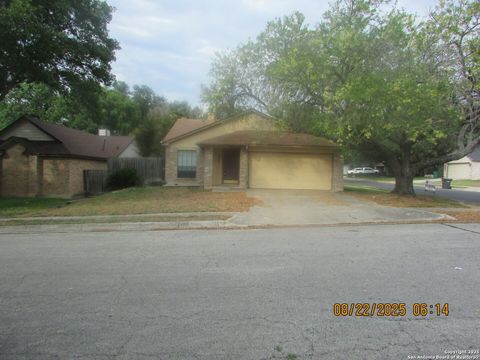
$225,000
3
bds
|
2
ba
|
1,378
sqft
|
built
1977
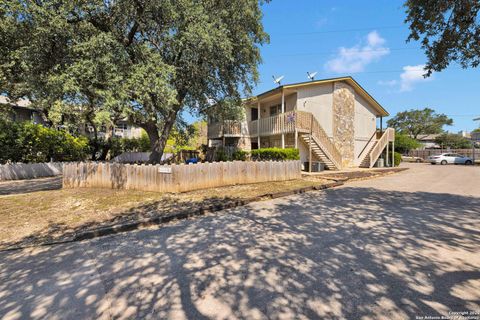
8611 Tanbark Dr, San Antonio, TX 78240
$-368
Cash flow
-8.5%
Cash-on-Cash Return
3.7%
Cap rate
0.7%
Rent to Value Ratio
Active
$285,000
3
bds
|
2
ba
|
1,646
sqft
|
built
1984
6003 Broadmeadow, San Antonio, TX 78240
$-672
Cash flow
-12.3%
Cash-on-Cash Return
2.9%
Cap rate
0.6%
Rent to Value Ratio
Active
$279,000
3
bds
|
2
ba
|
1,730
sqft
|
built
1971
7211 Sulky Ln, San Antonio, TX 78240
$-537
Cash flow
-10.0%
Cash-on-Cash Return
3.4%
Cap rate
0.6%
Rent to Value Ratio
Active
$145,000
2
bds
|
2
ba
|
1,027
sqft
|
built
1984
5322 Medical Dr, San Antonio, TX 78240
$-442
Cash flow
-15.9%
Cash-on-Cash Return
2.0%
Cap rate
0.8%
Rent to Value Ratio
Active
$257,000
3
bds
|
2
ba
|
1,350
sqft
|
built
1978
8214 Devlin Pt, San Antonio, TX 78240
$-471
Cash flow
-9.6%
Cash-on-Cash Return
3.5%
Cap rate
0.7%
Rent to Value Ratio
Active
$287,000
3
bds
|
3
ba
|
1,631
sqft
|
built
1985
7738 Bay Berry, San Antonio, TX 78240
$-531
Cash flow
-9.7%
Cash-on-Cash Return
3.5%
Cap rate
0.7%
Rent to Value Ratio
Active
$549,000
8
bds
|
0
ba
|
3,944
sqft
|
built
1982
5818 Shadow Gln, San Antonio, TX 78240
$-2,664
Cash flow
-25.3%
Cash-on-Cash Return
-0.1%
Cap rate
0.3%
Rent to Value Ratio
Active
$225,000
3
bds
|
2
ba
|
1,607
sqft
|
built
1984
6027 Glen Heather, San Antonio, TX 78240
$-415
Cash flow
-9.6%
Cash-on-Cash Return
3.5%
Cap rate
0.8%
Rent to Value Ratio
Active
$320,000
4
bds
|
3
ba
|
2,018
sqft
|
built
1987
9308 Andersonville Ln, San Antonio, TX 78240
$-684
Cash flow
-11.2%
Cash-on-Cash Return
3.1%
Cap rate
0.6%
Rent to Value Ratio
Active
$549,000
8
bds
|
0
ba
|
3,944
sqft
|
built
1982
5827 Shadow Gln, San Antonio, TX 78240
$-2,514
Cash flow
-23.9%
Cash-on-Cash Return
0.2%
Cap rate
0.3%
Rent to Value Ratio
Active
$237,000
3
bds
|
3
ba
|
1,734
sqft
|
built
2001
14 Fannin Post, San Antonio, TX 78240
$-382
Cash flow
-8.4%
Cash-on-Cash Return
3.7%
Cap rate
0.8%
Rent to Value Ratio
Active
$295,000
4
bds
|
3
ba
|
1,650
sqft
|
built
2002
50 Latrobe Post, San Antonio, TX 78240
$-646
Cash flow
-11.4%
Cash-on-Cash Return
3.1%
Cap rate
0.6%
Rent to Value Ratio
Active
$299,000
4
bds
|
2
ba
|
1,865
sqft
|
built
1977
8718 Thatch Dr, San Antonio, TX 78240
$-556
Cash flow
-9.7%
Cash-on-Cash Return
3.4%
Cap rate
0.7%
Rent to Value Ratio
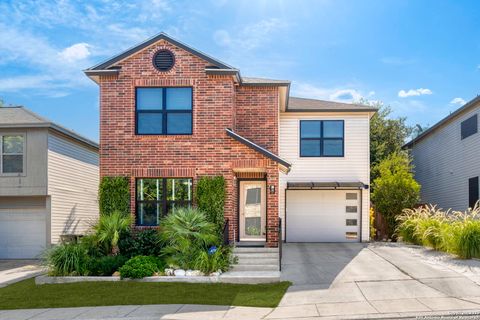
Active
$255,000
3
bds
|
3
ba
|
1,524
sqft
|
built
1996
6022 Bantry Bay, San Antonio, TX 78240
$-487
Cash flow
-10.0%
Cash-on-Cash Return
3.4%
Cap rate
0.7%
Rent to Value Ratio
Active
$384,900
4
bds
|
3
ba
|
2,103
sqft
|
built
2021
6806 Prue Rd, San Antonio, TX 78240
$-1,200
Cash flow
-16.3%
Cash-on-Cash Return
1.9%
Cap rate
0.5%
Rent to Value Ratio
Active
$235,000
3
bds
|
3
ba
|
1,727
sqft
|
built
2007
6160 Eckhert Rd, San Antonio, TX 78240
$-573
Cash flow
-12.7%
Cash-on-Cash Return
2.8%
Cap rate
0.9%
Rent to Value Ratio
Active
$274,500
3
bds
|
4
ba
|
1,727
sqft
|
built
2007
6160 Eckhert Rd, San Antonio, TX 78240
$-764
Cash flow
-14.5%
Cash-on-Cash Return
2.3%
Cap rate
0.7%
Rent to Value Ratio
Active
$209,990
3
bds
|
3
ba
|
1,345
sqft
|
built
2007
7323 Snowden Rd, San Antonio, TX 78240
$-591
Cash flow
-14.7%
Cash-on-Cash Return
2.3%
Cap rate
0.7%
Rent to Value Ratio
Active
$239,500
4
bds
|
3
ba
|
1,673
sqft
|
built
2001
9023 Mountain Field Dr, San Antonio, TX 78240
$-361
Cash flow
-7.9%
Cash-on-Cash Return
3.9%
Cap rate
0.8%
Rent to Value Ratio
Active
$259,900
3
bds
|
2
ba
|
1,212
sqft
|
built
2012
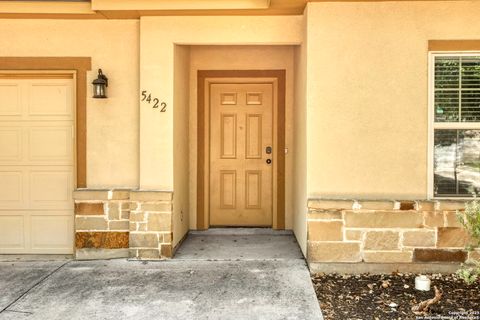
5422 Sunlit Brk, San Antonio, TX 78240
$-461
Cash flow
-9.3%
Cash-on-Cash Return
3.6%
Cap rate
0.7%
Rent to Value Ratio
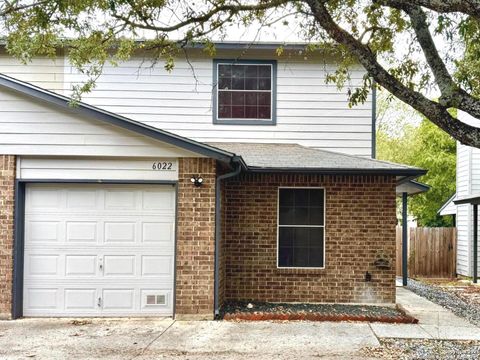
Active
$185,000
2
bds
|
2
ba
|
1,106
sqft
|
built
2007
7323 Snowden Rd, San Antonio, TX 78240
$-465
Cash flow
-13.1%
Cash-on-Cash Return
2.7%
Cap rate
0.7%
Rent to Value Ratio
Active
$335,400
3
bds
|
3
ba
|
2,662
sqft
|
built
1997
9115 Victory Pass Dr, San Antonio, TX 78240
$-710
Cash flow
-11.0%
Cash-on-Cash Return
3.1%
Cap rate
0.7%
Rent to Value Ratio
Active
$285,000
3
bds
|
3
ba
|
1,606
sqft
|
built
1998
9 Pembroke Ct, San Antonio, TX 78240
$-524
Cash flow
-9.6%
Cash-on-Cash Return
3.5%
Cap rate
0.7%
Rent to Value Ratio
Active
$290,000
4
bds
|
2
ba
|
1,782
sqft
|
built
1974
7447 Elderberry St, San Antonio, TX 78240
$-636
Cash flow
-11.4%
Cash-on-Cash Return
3.0%
Cap rate
0.6%
Rent to Value Ratio
Active
$220,000
3
bds
|
2
ba
|
1,149
sqft
|
built
1963
5811 Gabor Dr, San Antonio, TX 78240
$-349
Cash flow
-8.3%
Cash-on-Cash Return
3.8%
Cap rate
0.7%
Rent to Value Ratio
Active
$190,000
2
bds
|
2
ba
|
886
sqft
|
built
1985
8642 Fredericksburg Rd, San Antonio, TX 78240
$-432
Cash flow
-11.9%
Cash-on-Cash Return
2.9%
Cap rate
0.9%
Rent to Value Ratio
Active
$362,500
4
bds
|
3
ba
|
3,162
sqft
|
built
1998
10515 Westfield Pl, San Antonio, TX 78240
$-761
Cash flow
-11.0%
Cash-on-Cash Return
3.2%
Cap rate
0.7%
Rent to Value Ratio
Active
$257,900
3
bds
|
2
ba
|
1,195
sqft
|
built
1972
7206 Sulky Ln, San Antonio, TX 78240
$-525
Cash flow
-10.6%
Cash-on-Cash Return
3.2%
Cap rate
0.6%
Rent to Value Ratio
Active
$328,000
3
bds
|
2
ba
|
2,162
sqft
|
built
1991
7747 Sandia Blf, San Antonio, TX 78240
$-784
Cash flow
-12.5%
Cash-on-Cash Return
2.8%
Cap rate
0.6%
Rent to Value Ratio
Active
$329,000
3
bds
|
3
ba
|
2,575
sqft
|
built
1999
9511 Marshall Pt, San Antonio, TX 78240
$-702
Cash flow
-11.1%
Cash-on-Cash Return
3.1%
Cap rate
0.7%
Rent to Value Ratio
Active
$280,000
3
bds
|
2
ba
|
2,370
sqft
|
built
1993
10462 Trailway Oak, San Antonio, TX 78240
$-466
Cash flow
-8.7%
Cash-on-Cash Return
3.7%
Cap rate
0.8%
Rent to Value Ratio
Active
$285,000
3
bds
|
2
ba
|
1,282
sqft
|
built
1983
6226 Cherrywest Cir, San Antonio, TX 78240
$-452
Cash flow
-8.3%
Cash-on-Cash Return
3.8%
Cap rate
0.7%
Rent to Value Ratio
Active
$255,000
3
bds
|
3
ba
|
1,712
sqft
|
built
1998
7119 Snowden Crst, San Antonio, TX 78240
$-435
Cash flow
-8.9%
Cash-on-Cash Return
3.6%
Cap rate
0.7%
Rent to Value Ratio
Active
$300,000
4
bds
|
2
ba
|
1,729
sqft
|
built
1972
5822 Gomer Pyle, San Antonio, TX 78240
$-678
Cash flow
-11.8%
Cash-on-Cash Return
3.0%
Cap rate
0.6%
Rent to Value Ratio
Active
$299,999
3
bds
|
2
ba
|
1,782
sqft
|
built
1976
7414 Elderberry St, San Antonio, TX 78240
$-506
Cash flow
-8.8%
Cash-on-Cash Return
3.7%
Cap rate
0.7%
Rent to Value Ratio
Active
$930,000
5
bds
|
4
ba
|
2,647
sqft
|
built
1980
6970 Stonykirk Rd, San Antonio, TX 78240
$-3,193
Cash flow
-17.9%
Cash-on-Cash Return
1.6%
Cap rate
0.3%
Rent to Value Ratio
Active
$357,900
3
bds
|
2
ba
|
2,046
sqft
|
built
1971
5830 Gomer Pyle, San Antonio, TX 78240
$-986
Cash flow
-14.4%
Cash-on-Cash Return
2.4%
Cap rate
0.5%
Rent to Value Ratio