78648 Investment Properties for Sale
Browse homes for sale and investment properties in 78648. Refine your search by price, property type, or more.
Best cash flowing properties in 78648
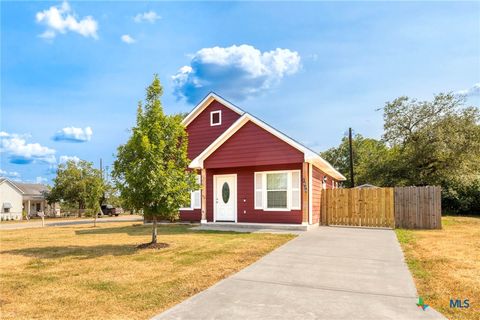
Active
$165,000
2
bds
|
0
ba
|
1,256
sqft
|
built
1945
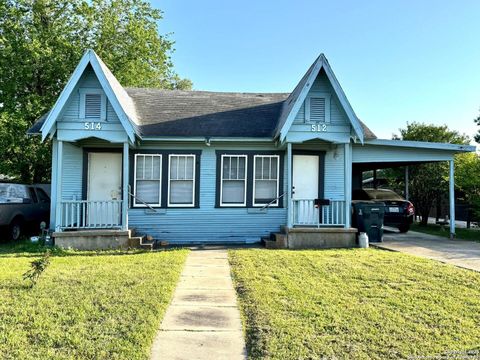
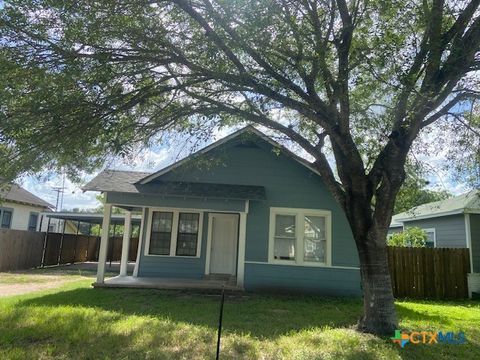
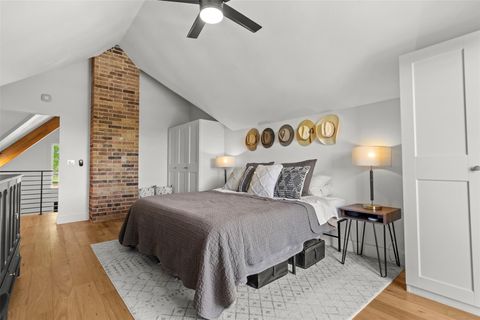
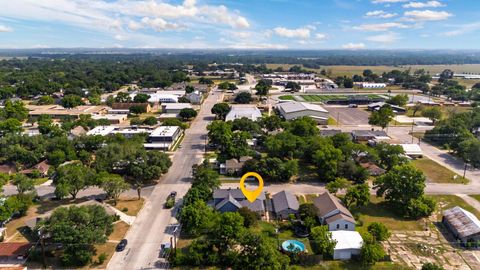
512 E Travis St, Luling, TX 78648
$145
Cash flow
4.6%
Cash-on-Cash Return
6.7%
Cap rate
1.0%
Rent to Value Ratio
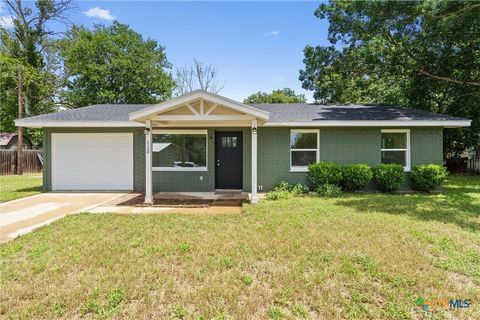
Active
$225,000
3
bds
|
2
ba
|
1,964
sqft
|
built
1922
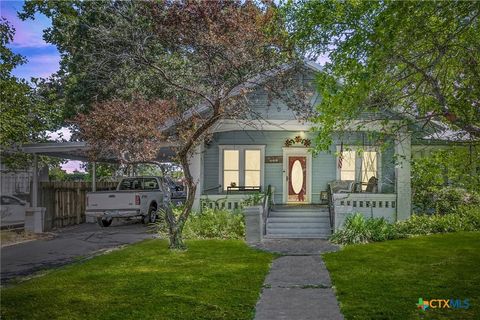
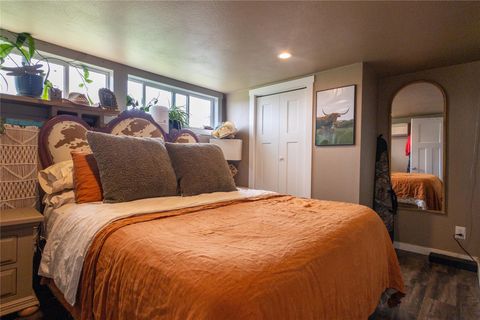
409 E Bowie St, Luling, TX 78648
$-84
Cash flow
-1.9%
Cash-on-Cash Return
5.2%
Cap rate
0.8%
Rent to Value Ratio
16 out of 23 properties for sale in 78648
Limited Results Shown
Create a free account, or log in to reveal all property listings and enjoy the complete experience.
Active
$320,000
3
bds
|
2
ba
|
2,360
sqft
|
built
1978
202 E Newton St, Luling, TX 78648
$-877
Cash flow
-14.3%
Cash-on-Cash Return
2.4%
Cap rate
0.5%
Rent to Value Ratio
Active
$525,000
4
bds
|
4
ba
|
3,139
sqft
|
built
1982
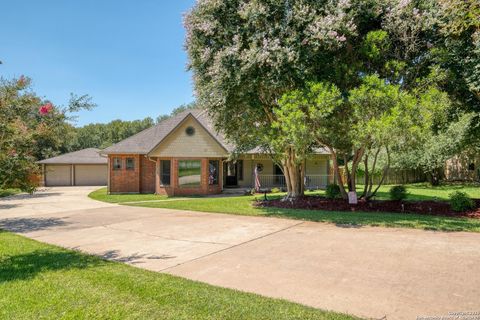
170 Oak Creek Cir, Luling, TX 78648
$-1,191
Cash flow
-11.8%
Cash-on-Cash Return
3.0%
Cap rate
0.5%
Rent to Value Ratio
Active
$235,000
3
bds
|
2
ba
|
1,092
sqft
|
built
2018
1628 Armstrong St, Luling, TX 78648
$-299
Cash flow
-6.6%
Cash-on-Cash Return
4.2%
Cap rate
0.7%
Rent to Value Ratio
Active
$210,000
3
bds
|
1
ba
|
958
sqft
|
built
1973
115 Sycamore St, Luling, TX 78648
$-229
Cash flow
-5.7%
Cash-on-Cash Return
4.4%
Cap rate
0.7%
Rent to Value Ratio
Active
$275,000
4
bds
|
2
ba
|
1,716
sqft
|
built
1962
201 Hillcrest Dr, Luling, TX 78648
$-382
Cash flow
-7.2%
Cash-on-Cash Return
4.0%
Cap rate
0.7%
Rent to Value Ratio
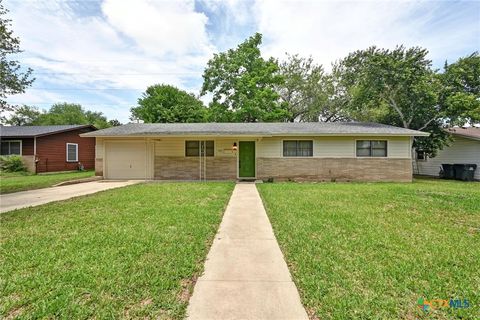
Active
$189,000
3
bds
|
1
ba
|
1,101
sqft
|
built
1978
305 Ivy Ave, Luling, TX 78648
$-86
Cash flow
-2.4%
Cash-on-Cash Return
5.1%
Cap rate
0.8%
Rent to Value Ratio
Active
$730,000
2
bds
|
2
ba
|
1,268
sqft
|
built
1995
1240 Kelly Rd, Luling, TX 78648
$-2,553
Cash flow
-18.2%
Cash-on-Cash Return
1.5%
Cap rate
0.2%
Rent to Value Ratio
Active
$460,000
3
bds
|
3
ba
|
3,180
sqft
|
built
1934
222 Myrtle Ave, Luling, TX 78648
$-1,476
Cash flow
-16.7%
Cash-on-Cash Return
1.8%
Cap rate
0.4%
Rent to Value Ratio
Active
$194,500
2
bds
|
1
ba
|
885
sqft
|
built
1950
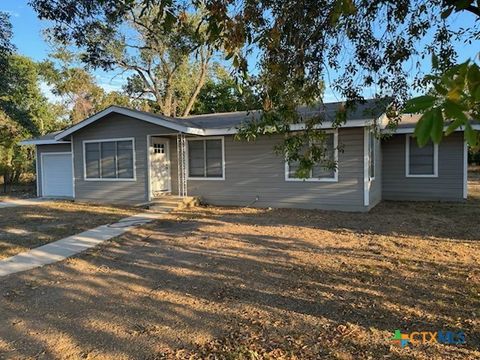
720 S Laurel Ave, Luling, TX 78648
$-211
Cash flow
-5.7%
Cash-on-Cash Return
4.4%
Cap rate
0.7%
Rent to Value Ratio
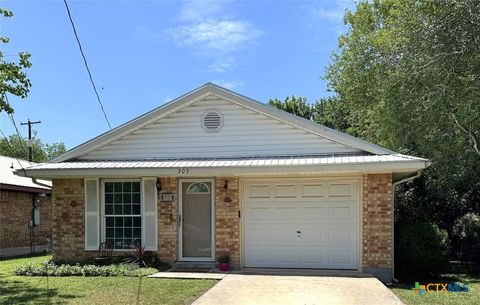
Active
$219,000
3
bds
|
1
ba
|
1,394
sqft
|
built
1969
1025 E Fannin St, Luling, TX 78648
$-107
Cash flow
-2.5%
Cash-on-Cash Return
5.1%
Cap rate
0.7%
Rent to Value Ratio
Active
$999,500
4
bds
|
3
ba
|
3,944
sqft
|
built
1977
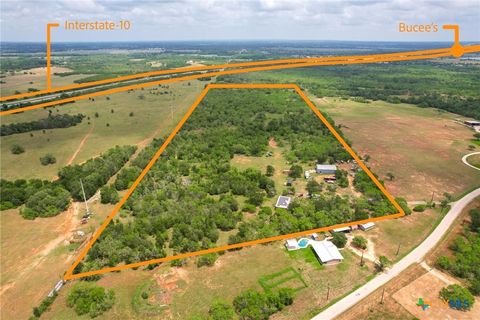
4530 Fm 86, Luling, TX 78648
$-2,169
Cash flow
-11.3%
Cash-on-Cash Return
3.1%
Cap rate
0.5%
Rent to Value Ratio

Active
$220,000
1
bds
|
1
ba
|
1,053
sqft
|
built
1938
237 San Marcos Hwy, Luling, TX 78648
$-270
Cash flow
-6.4%
Cash-on-Cash Return
4.2%
Cap rate
0.7%
Rent to Value Ratio
Active
$695,000
3
bds
|
2
ba
|
0
sqft
|
built
2022
3270 Fm 671, Luling, TX 78648
$-2,080
Cash flow
-15.6%
Cash-on-Cash Return
2.1%
Cap rate
0.3%
Rent to Value Ratio
Active
$475,000
5
bds
|
4
ba
|
3,205
sqft
|
built
1910
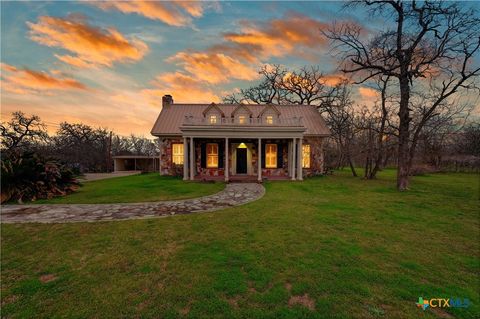
116 S Hackberry Ave, Luling, TX 78648
$-757
Cash flow
-8.3%
Cash-on-Cash Return
3.8%
Cap rate
0.7%
Rent to Value Ratio