80027 Investment Properties for Sale
Browse homes for sale and investment properties in 80027. Refine your search by price, property type, or more.
Best cash flowing properties in 80027
Active
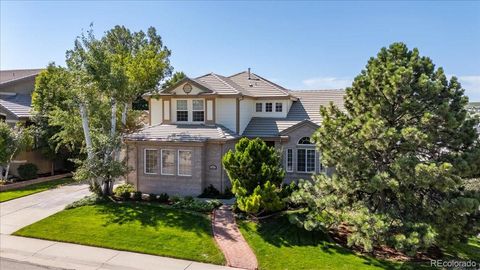
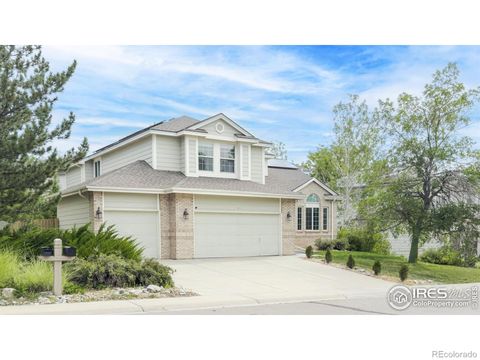
$350,000
1
bds
|
1
ba
|
729
sqft
|
built
1994
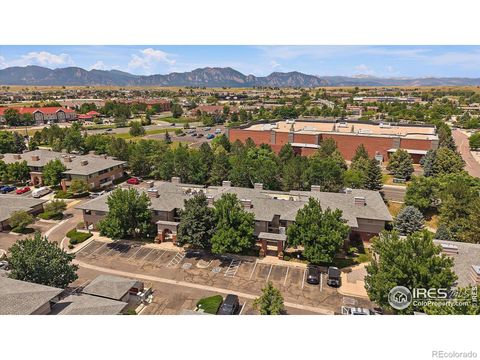
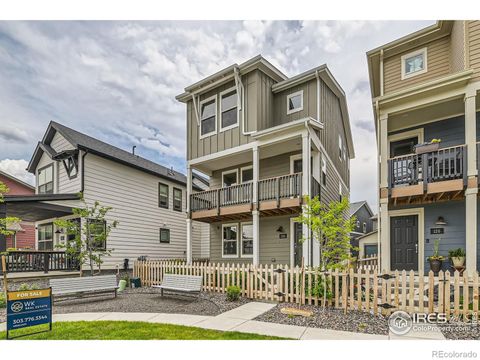
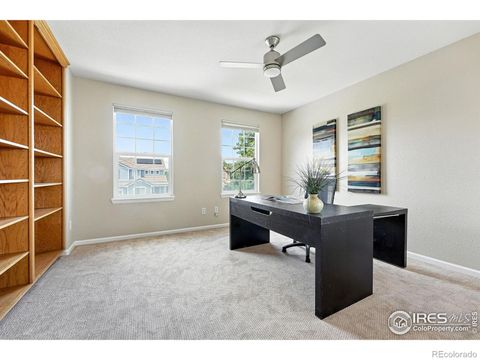
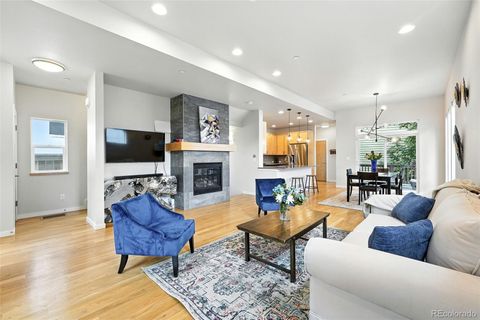
730 Copper Ln, Louisville, CO 80027
$-841
Cash flow
-12.5%
Cash-on-Cash Return
2.8%
Cap rate
0.5%
Rent to Value Ratio
Active
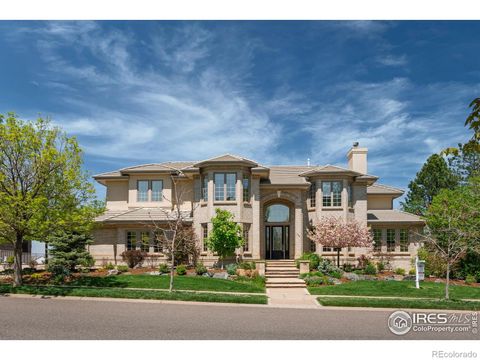
$500,000
3
bds
|
3
ba
|
1,550
sqft
|
built
1996
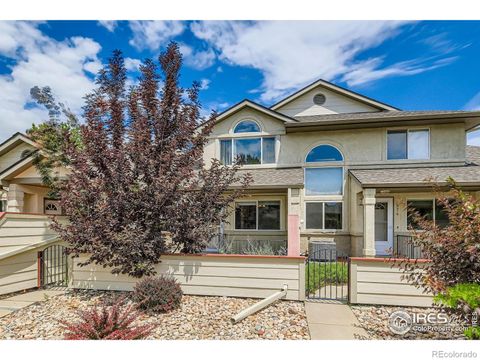
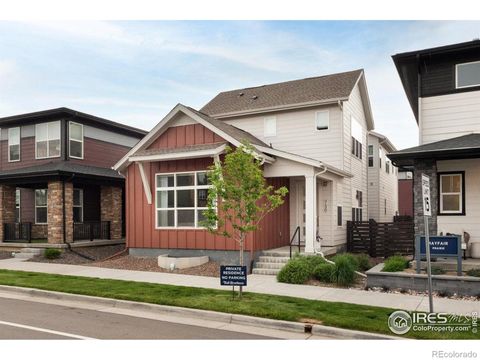
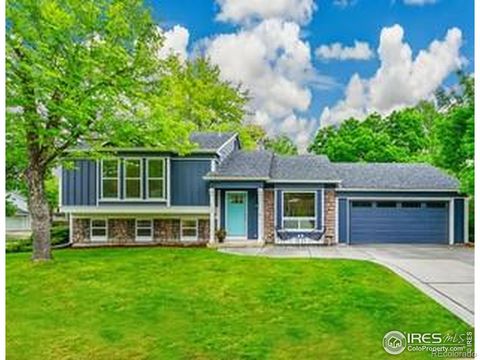
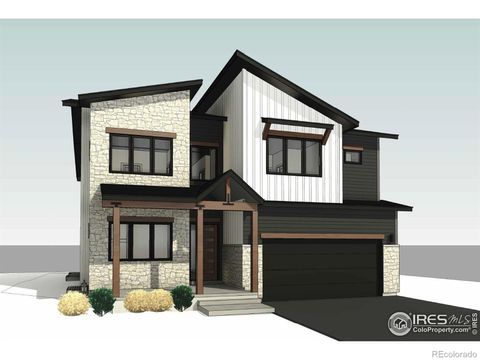
572 Ridgeview Dr, Louisville, CO 80027
$-1,144
Cash flow
-11.9%
Cash-on-Cash Return
2.9%
Cap rate
0.5%
Rent to Value Ratio
73 out of 80 properties for sale in 80027
Limited Results Shown
Create a free account, or log in to reveal all property listings and enjoy the complete experience.
Active
$950,000
4
bds
|
4
ba
|
3,112
sqft
|
built
2000
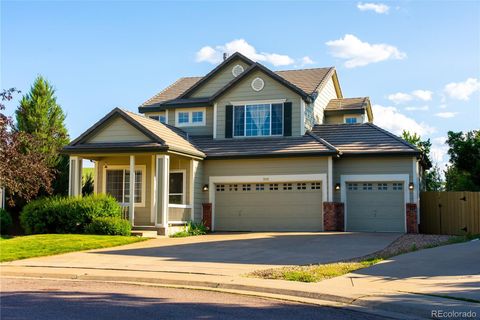
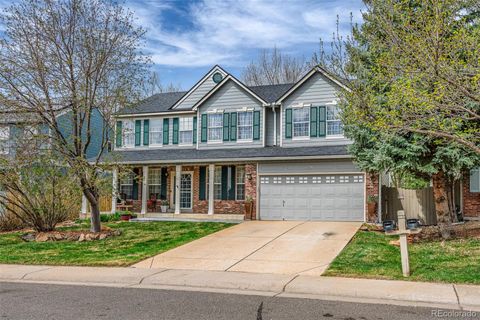
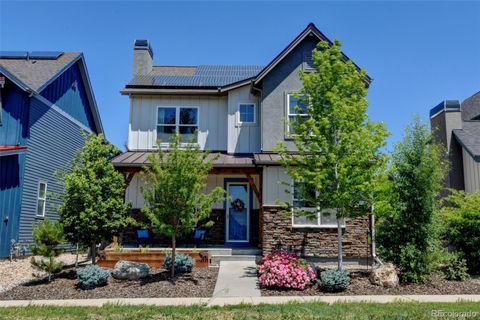
3232 Cimarron Pl, Superior, CO 80027
$-2,566
Cash flow
-14.1%
Cash-on-Cash Return
2.4%
Cap rate
0.4%
Rent to Value Ratio
Active
$1,750,000
4
bds
|
5
ba
|
4,418
sqft
|
built
1991
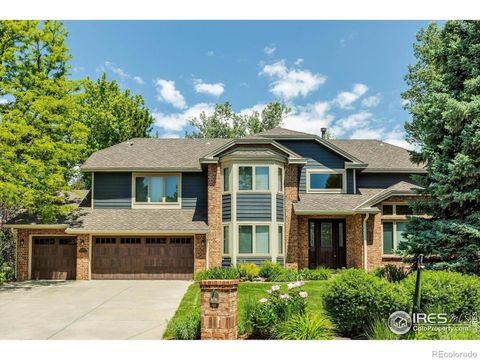
567 N Manorwood Ln, Louisville, CO 80027
$-6,060
Cash flow
-18.1%
Cash-on-Cash Return
1.5%
Cap rate
0.3%
Rent to Value Ratio
Active
$1,200,700
5
bds
|
4
ba
|
4,154
sqft
|
built
1998
888 Northern Way, Superior, CO 80027
$-3,567
Cash flow
-15.5%
Cash-on-Cash Return
2.1%
Cap rate
0.3%
Rent to Value Ratio
Active
$1,000,000
5
bds
|
4
ba
|
3,712
sqft
|
built
1984
419 Centennial Dr, Louisville, CO 80027
$-2,576
Cash flow
-13.4%
Cash-on-Cash Return
2.6%
Cap rate
0.4%
Rent to Value Ratio
Active
$1,450,000
4
bds
|
4
ba
|
3,440
sqft
|
built
2013
1836 Lakespur Ln, Louisville, CO 80027
$-4,713
Cash flow
-17.0%
Cash-on-Cash Return
1.8%
Cap rate
0.3%
Rent to Value Ratio
Active
$695,000
5
bds
|
2
ba
|
2,350
sqft
|
built
1978
322 W Harper St, Louisville, CO 80027
$-1,397
Cash flow
-10.5%
Cash-on-Cash Return
3.3%
Cap rate
0.5%
Rent to Value Ratio
Active
$717,999
3
bds
|
4
ba
|
1,753
sqft
|
built
2022
605 Promenade Dr, Superior, CO 80027
$-1,313
Cash flow
-9.5%
Cash-on-Cash Return
3.5%
Cap rate
0.5%
Rent to Value Ratio
Active
$694,000
3
bds
|
4
ba
|
1,920
sqft
|
built
1995
1667 Reliance Cir, Superior, CO 80027
$-1,467
Cash flow
-11.0%
Cash-on-Cash Return
3.1%
Cap rate
0.5%
Rent to Value Ratio
Active
$850,000
4
bds
|
2
ba
|
2,520
sqft
|
built
1974
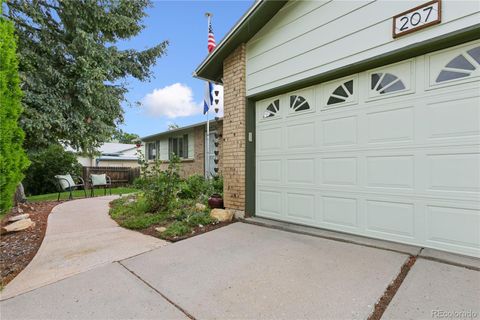
207 Short Pl, Louisville, CO 80027
$-2,232
Cash flow
-13.7%
Cash-on-Cash Return
2.5%
Cap rate
0.4%
Rent to Value Ratio
Active
$509,500
2
bds
|
2
ba
|
1,286
sqft
|
built
1997
1697 High Plains Ct, Superior, CO 80027
$-1,466
Cash flow
-15.0%
Cash-on-Cash Return
2.2%
Cap rate
0.5%
Rent to Value Ratio
Active
$732,000
3
bds
|
3
ba
|
1,546
sqft
|
built
2022
128 E Douglas St, Superior, CO 80027
$-1,557
Cash flow
-11.1%
Cash-on-Cash Return
3.1%
Cap rate
0.5%
Rent to Value Ratio
Active
$1,125,000
4
bds
|
4
ba
|
3,517
sqft
|
built
2022
730 Promenade Dr, Superior, CO 80027
$-3,640
Cash flow
-16.9%
Cash-on-Cash Return
1.8%
Cap rate
0.3%
Rent to Value Ratio
Active
$1,127,000
4
bds
|
4
ba
|
3,096
sqft
|
built
1993
1825 Keota Ln, Superior, CO 80027
$-3,187
Cash flow
-14.8%
Cash-on-Cash Return
2.3%
Cap rate
0.3%
Rent to Value Ratio
Active
$750,000
4
bds
|
3
ba
|
1,732
sqft
|
built
1988
744 Owl Dr, Louisville, CO 80027
$-1,777
Cash flow
-12.4%
Cash-on-Cash Return
2.8%
Cap rate
0.4%
Rent to Value Ratio
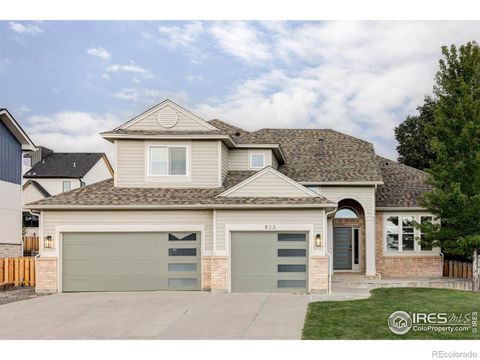
Active
$1,325,000
6
bds
|
5
ba
|
4,034
sqft
|
built
1992
823 Trail Ridge Dr, Louisville, CO 80027
$-3,889
Cash flow
-15.3%
Cash-on-Cash Return
2.2%
Cap rate
0.3%
Rent to Value Ratio
Active
$930,000
5
bds
|
3
ba
|
2,784
sqft
|
built
1977
215 Sunland St, Louisville, CO 80027
$-2,399
Cash flow
-13.5%
Cash-on-Cash Return
2.6%
Cap rate
0.4%
Rent to Value Ratio
Active
$695,000
3
bds
|
2
ba
|
1,642
sqft
|
built
1985
253 W Cedar Way, Louisville, CO 80027
$-1,699
Cash flow
-12.8%
Cash-on-Cash Return
2.7%
Cap rate
0.4%
Rent to Value Ratio
Active
$999,900
4
bds
|
4
ba
|
3,296
sqft
|
built
1993
1899 Breen Ln, Superior, CO 80027
$-2,575
Cash flow
-13.4%
Cash-on-Cash Return
2.6%
Cap rate
0.4%
Rent to Value Ratio
Active
$1,100,000
3
bds
|
3
ba
|
3,132
sqft
|
built
2016
2904 Casalon Cir, Superior, CO 80027
$-3,179
Cash flow
-15.1%
Cash-on-Cash Return
2.2%
Cap rate
0.4%
Rent to Value Ratio
Active
$1,200,000
3
bds
|
4
ba
|
3,299
sqft
|
built
2008
2712 Calmante Pl, Superior, CO 80027
$-3,954
Cash flow
-17.2%
Cash-on-Cash Return
1.7%
Cap rate
0.3%
Rent to Value Ratio
Active
$1,039,000
4
bds
|
4
ba
|
2,758
sqft
|
built
1994
1772 Eisenhower Dr, Louisville, CO 80027
$-2,618
Cash flow
-13.1%
Cash-on-Cash Return
2.7%
Cap rate
0.4%
Rent to Value Ratio

Active
$850,000
5
bds
|
4
ba
|
3,348
sqft
|
built
2000
903 Grays Peak Dr, Superior, CO 80027
$-2,039
Cash flow
-12.5%
Cash-on-Cash Return
2.8%
Cap rate
0.4%
Rent to Value Ratio
Active
$2,200,000
5
bds
|
5
ba
|
4,404
sqft
|
built
2007
1108 Grant Ave, Louisville, CO 80027
$-6,051
Cash flow
-14.4%
Cash-on-Cash Return
2.4%
Cap rate
0.4%
Rent to Value Ratio
Active
$848,000
4
bds
|
4
ba
|
2,590
sqft
|
built
1999
2926 Castle Peak Ave, Superior, CO 80027
$-2,222
Cash flow
-13.7%
Cash-on-Cash Return
2.5%
Cap rate
0.4%
Rent to Value Ratio
Active
$899,000
4
bds
|
2
ba
|
1,760
sqft
|
built
1983
106 S Madison Ave, Louisville, CO 80027
$-2,596
Cash flow
-15.1%
Cash-on-Cash Return
2.2%
Cap rate
0.3%
Rent to Value Ratio
Active
$1,069,000
4
bds
|
4
ba
|
4,040
sqft
|
built
1996
2225 Clayton Cir, Superior, CO 80027
$-2,814
Cash flow
-13.7%
Cash-on-Cash Return
2.5%
Cap rate
0.4%
Rent to Value Ratio
Active
$499,900
3
bds
|
3
ba
|
1,492
sqft
|
built
1999
2855 Rock Creek Cir, Superior, CO 80027
$-1,219
Cash flow
-12.7%
Cash-on-Cash Return
2.8%
Cap rate
0.5%
Rent to Value Ratio
Active
$1,050,000
4
bds
|
4
ba
|
3,686
sqft
|
built
1996
977 Eldorado Dr, Superior, CO 80027
$-2,851
Cash flow
-14.2%
Cash-on-Cash Return
2.4%
Cap rate
0.4%
Rent to Value Ratio
Active
$2,200,000
6
bds
|
6
ba
|
7,135
sqft
|
built
1998
725 E Wiggins St, Superior, CO 80027
$-8,137
Cash flow
-19.3%
Cash-on-Cash Return
1.2%
Cap rate
0.2%
Rent to Value Ratio
Active
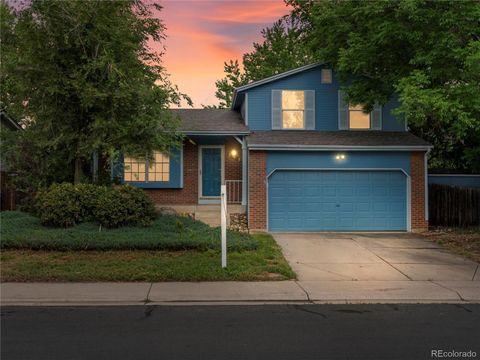
$640,000
3
bds
|
3
ba
|
2,026
sqft
|
built
1996
561 Ridgeview Dr, Louisville, CO 80027
$-1,762
Cash flow
-14.4%
Cash-on-Cash Return
2.4%
Cap rate
0.4%
Rent to Value Ratio
Active
$639,900
3
bds
|
2
ba
|
1,192
sqft
|
built
1982
298 S Hoover Ave, Louisville, CO 80027
$-1,388
Cash flow
-11.3%
Cash-on-Cash Return
3.1%
Cap rate
0.4%
Rent to Value Ratio
Active
$839,000
5
bds
|
3
ba
|
2,741
sqft
|
built
1998
2937 W Yarrow Cir, Superior, CO 80027
$-1,809
Cash flow
-11.2%
Cash-on-Cash Return
3.1%
Cap rate
0.5%
Rent to Value Ratio
Active
$590,000
2
bds
|
3
ba
|
1,537
sqft
|
built
1999
2855 Rock Creek Cir, Superior, CO 80027
$-1,519
Cash flow
-13.4%
Cash-on-Cash Return
2.6%
Cap rate
0.5%
Rent to Value Ratio
Active
$1,250,000
5
bds
|
5
ba
|
4,422
sqft
|
built
1996
2204 Lasalle St, Superior, CO 80027
$-3,539
Cash flow
-14.8%
Cash-on-Cash Return
2.3%
Cap rate
0.4%
Rent to Value Ratio
Active
$1,190,000
5
bds
|
3
ba
|
2,356
sqft
|
built
1990
902 Grove Dr, Louisville, CO 80027
$-2,767
Cash flow
-12.1%
Cash-on-Cash Return
2.9%
Cap rate
0.4%
Rent to Value Ratio
Active
$950,000
4
bds
|
4
ba
|
2,573
sqft
|
built
2018
1376 Snowberry Ln, Louisville, CO 80027
$-2,286
Cash flow
-12.6%
Cash-on-Cash Return
2.8%
Cap rate
0.4%
Rent to Value Ratio
Active
$1,925,000
4
bds
|
5
ba
|
4,233
sqft
|
built
2026
1039 Turnberry Cir, Louisville, CO 80027
$-6,573
Cash flow
-17.8%
Cash-on-Cash Return
1.6%
Cap rate
0.2%
Rent to Value Ratio
Active
$1,199,900
5
bds
|
4
ba
|
3,661
sqft
|
built
2009
1362 Golden Eagle Way, Louisville, CO 80027
$-2,901
Cash flow
-12.6%
Cash-on-Cash Return
2.8%
Cap rate
0.4%
Rent to Value Ratio