80104 Investment Properties for Sale
Browse homes for sale and investment properties in 80104. Refine your search by price, property type, or more.
Best cash flowing properties in 80104

Active
$179,000
1
bds
|
1
ba
|
634
sqft
|
built
1984
1261 S Gilbert St, Castle Rock, CO 80104
$-271
Cash flow
-7.9%
Cash-on-Cash Return
3.9%
Cap rate
0.8%
Rent to Value Ratio

Active
$225,000
1
bds
|
1
ba
|
719
sqft
|
built
1984
532 Oakwood Dr, Castle Rock, CO 80104
$-546
Cash flow
-12.7%
Cash-on-Cash Return
2.8%
Cap rate
0.7%
Rent to Value Ratio
113 out of 117 properties for sale in 80104
Limited Results Shown
Create a free account, or log in to reveal all property listings and enjoy the complete experience.
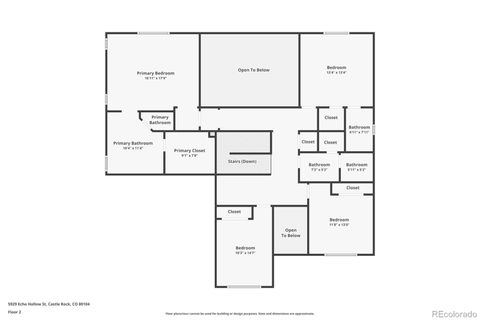
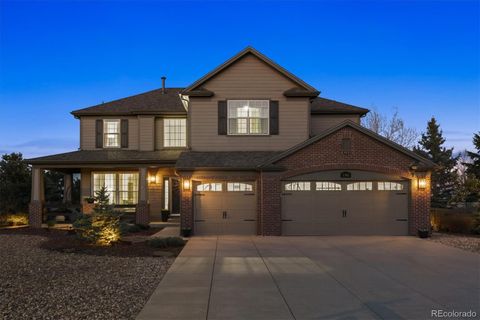
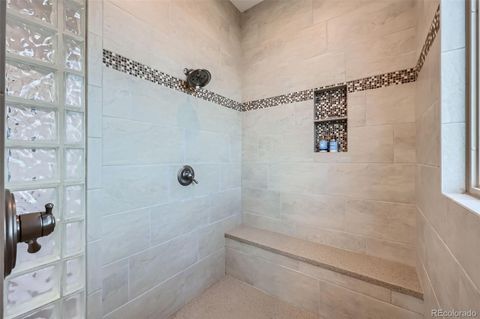
Active
$875,000
4
bds
|
4
ba
|
3,219
sqft
|
built
2016
5929 Echo Hollow St, Castle Rock, CO 80104
$-1,914
Cash flow
-11.4%
Cash-on-Cash Return
3.1%
Cap rate
0.4%
Rent to Value Ratio
Active
$1,195,000
6
bds
|
5
ba
|
4,249
sqft
|
built
2002
1302 Milbury St, Castle Rock, CO 80104
$-3,476
Cash flow
-15.2%
Cash-on-Cash Return
2.2%
Cap rate
0.3%
Rent to Value Ratio
Active
$1,449,995
5
bds
|
4
ba
|
4,264
sqft
|
built
2001
4781 Mariposa Rd, Castle Rock, CO 80104
$-5,136
Cash flow
-18.5%
Cash-on-Cash Return
1.4%
Cap rate
0.3%
Rent to Value Ratio

Active
$700,000
4
bds
|
4
ba
|
3,573
sqft
|
built
2019
3945 John Ave, Castle Rock, CO 80104
$-1,492
Cash flow
-11.1%
Cash-on-Cash Return
3.1%
Cap rate
0.5%
Rent to Value Ratio
Active
$665,000
4
bds
|
3
ba
|
2,994
sqft
|
built
2020
2060 Peralta Loop, Castle Rock, CO 80104
$-1,355
Cash flow
-10.6%
Cash-on-Cash Return
3.2%
Cap rate
0.5%
Rent to Value Ratio
Active
$820,000
5
bds
|
5
ba
|
4,156
sqft
|
built
2014
4145 Manorbrier Cir, Castle Rock, CO 80104
$-1,802
Cash flow
-11.5%
Cash-on-Cash Return
3.0%
Cap rate
0.5%
Rent to Value Ratio

Active
$2,785,000
6
bds
|
8
ba
|
7,729
sqft
|
built
2009
4605 Tierra Alta Dr, Castle Rock, CO 80104
$-7,364
Cash flow
-13.8%
Cash-on-Cash Return
2.5%
Cap rate
0.4%
Rent to Value Ratio
Active
$600,000
3
bds
|
3
ba
|
2,263
sqft
|
built
2021
4781 Rosette St, Castle Rock, CO 80104
$-765
Cash flow
-6.7%
Cash-on-Cash Return
4.1%
Cap rate
0.6%
Rent to Value Ratio

Active
$799,500
5
bds
|
3
ba
|
3,253
sqft
|
built
2003
4069 Copper Ct, Castle Rock, CO 80104
$-1,518
Cash flow
-9.9%
Cash-on-Cash Return
3.4%
Cap rate
0.5%
Rent to Value Ratio

Active
$1,125,000
4
bds
|
5
ba
|
5,797
sqft
|
built
2005
5463 Killen Ave, Castle Rock, CO 80104
$-3,077
Cash flow
-14.3%
Cash-on-Cash Return
2.4%
Cap rate
0.4%
Rent to Value Ratio

Active
$659,000
3
bds
|
2
ba
|
1,767
sqft
|
built
2022
4365 Hidden Gulch Rd, Castle Rock, CO 80104
$-1,215
Cash flow
-9.6%
Cash-on-Cash Return
3.5%
Cap rate
0.5%
Rent to Value Ratio

Active
$570,000
5
bds
|
3
ba
|
2,401
sqft
|
built
1994
5133 Essex Ave, Castle Rock, CO 80104
$-1,087
Cash flow
-9.9%
Cash-on-Cash Return
3.4%
Cap rate
0.5%
Rent to Value Ratio

Active
$419,900
2
bds
|
1
ba
|
778
sqft
|
built
1987
45 N Bedford Ave, Castle Rock, CO 80104
$-753
Cash flow
-9.4%
Cash-on-Cash Return
3.5%
Cap rate
0.5%
Rent to Value Ratio

Active
$899,900
4
bds
|
3
ba
|
3,786
sqft
|
built
2003
5289 Fairfield Cir, Castle Rock, CO 80104
$-2,311
Cash flow
-13.4%
Cash-on-Cash Return
2.6%
Cap rate
0.4%
Rent to Value Ratio

Active
$739,000
5
bds
|
3
ba
|
3,207
sqft
|
built
2018
2789 Echo Park Dr, Castle Rock, CO 80104
$-1,694
Cash flow
-12.0%
Cash-on-Cash Return
2.9%
Cap rate
0.4%
Rent to Value Ratio

Active
$592,310
3
bds
|
3
ba
|
2,417
sqft
|
built
2003
359 Cherry St, Castle Rock, CO 80104
$-1,173
Cash flow
-10.3%
Cash-on-Cash Return
3.3%
Cap rate
0.5%
Rent to Value Ratio

Active
$2,750,000
5
bds
|
5
ba
|
6,643
sqft
|
built
2007
4604 Tierra Alta Dr, Castle Rock, CO 80104
$-7,864
Cash flow
-14.9%
Cash-on-Cash Return
2.2%
Cap rate
0.3%
Rent to Value Ratio

Active
$765,000
4
bds
|
3
ba
|
2,918
sqft
|
built
2013
2612 Mc Cracken Ln, Castle Rock, CO 80104
$-1,182
Cash flow
-8.1%
Cash-on-Cash Return
3.8%
Cap rate
0.5%
Rent to Value Ratio

Active
$739,900
4
bds
|
3
ba
|
3,138
sqft
|
built
2005
952 Eaglestone Dr, Castle Rock, CO 80104
$-1,223
Cash flow
-8.6%
Cash-on-Cash Return
3.7%
Cap rate
0.5%
Rent to Value Ratio
Active
$650,000
4
bds
|
3
ba
|
2,515
sqft
|
built
2022
3844 Sandy Vista Ln, Castle Rock, CO 80104
$-1,488
Cash flow
-11.9%
Cash-on-Cash Return
2.9%
Cap rate
0.4%
Rent to Value Ratio

Active
$640,000
5
bds
|
4
ba
|
2,969
sqft
|
built
1993
5282 Devon Ave, Castle Rock, CO 80104
$-1,158
Cash flow
-9.4%
Cash-on-Cash Return
3.5%
Cap rate
0.5%
Rent to Value Ratio
Active
$979,000
3
bds
|
2
ba
|
2,326
sqft
|
built
2022
4099 River Oaks St, Castle Rock, CO 80104
$-2,210
Cash flow
-11.8%
Cash-on-Cash Return
3.0%
Cap rate
0.4%
Rent to Value Ratio
Active
$673,000
3
bds
|
2
ba
|
2,315
sqft
|
built
2006
4143 Eagle Ridge Way, Castle Rock, CO 80104
$-1,326
Cash flow
-10.3%
Cash-on-Cash Return
3.3%
Cap rate
0.5%
Rent to Value Ratio

Active
$635,000
3
bds
|
3
ba
|
2,332
sqft
|
built
2022
5336 Trails Edge Ln, Castle Rock, CO 80104
$-591
Cash flow
-4.9%
Cash-on-Cash Return
4.6%
Cap rate
0.6%
Rent to Value Ratio

Active
$1,190,000
6
bds
|
4
ba
|
5,643
sqft
|
built
2005
276 Ember Pl, Castle Rock, CO 80104
$-3,273
Cash flow
-14.4%
Cash-on-Cash Return
2.4%
Cap rate
0.3%
Rent to Value Ratio
Active
$527,000
3
bds
|
3
ba
|
1,914
sqft
|
built
1997
5521 Spruce Ave, Castle Rock, CO 80104
$-817
Cash flow
-8.1%
Cash-on-Cash Return
3.8%
Cap rate
0.6%
Rent to Value Ratio

Active
$965,000
3
bds
|
3
ba
|
3,471
sqft
|
built
2006
5605 Killen Ave, Castle Rock, CO 80104
$-2,499
Cash flow
-13.5%
Cash-on-Cash Return
2.6%
Cap rate
0.4%
Rent to Value Ratio
Active
$560,000
2
bds
|
2
ba
|
1,580
sqft
|
built
2001
1058 Crenshaw St, Castle Rock, CO 80104
$-1,041
Cash flow
-9.7%
Cash-on-Cash Return
3.4%
Cap rate
0.5%
Rent to Value Ratio
Active
$400,000
3
bds
|
2
ba
|
1,345
sqft
|
built
1998
940 E Plum Creek Pkwy, Castle Rock, CO 80104
$-701
Cash flow
-9.1%
Cash-on-Cash Return
3.6%
Cap rate
0.6%
Rent to Value Ratio

Active
$665,000
3
bds
|
4
ba
|
3,303
sqft
|
built
1992
584 W Prestwick Way, Castle Rock, CO 80104
$-1,009
Cash flow
-7.9%
Cash-on-Cash Return
3.9%
Cap rate
0.5%
Rent to Value Ratio

Active
$719,000
4
bds
|
3
ba
|
2,705
sqft
|
built
2022
3722 Sandy Vista Trl, Castle Rock, CO 80104
$-1,460
Cash flow
-10.6%
Cash-on-Cash Return
3.2%
Cap rate
0.5%
Rent to Value Ratio

Active
$510,000
3
bds
|
3
ba
|
1,458
sqft
|
built
1986
176 S Pembrook St, Castle Rock, CO 80104
$-931
Cash flow
-9.5%
Cash-on-Cash Return
3.5%
Cap rate
0.5%
Rent to Value Ratio

Active
$799,000
4
bds
|
3
ba
|
2,993
sqft
|
built
2005
7083 Winthrop Cir, Castle Rock, CO 80104
$-1,753
Cash flow
-11.4%
Cash-on-Cash Return
3.0%
Cap rate
0.5%
Rent to Value Ratio

Active
$1,665,000
5
bds
|
4
ba
|
3,285
sqft
|
built
2022
202 October Pl, Castle Rock, CO 80104
$-4,660
Cash flow
-14.6%
Cash-on-Cash Return
2.3%
Cap rate
0.3%
Rent to Value Ratio

Active
$935,000
6
bds
|
3
ba
|
4,678
sqft
|
built
2003
5169 Fairfield Cir, Castle Rock, CO 80104
$-2,438
Cash flow
-13.6%
Cash-on-Cash Return
2.6%
Cap rate
0.4%
Rent to Value Ratio

Active
$2,700,000
4
bds
|
4
ba
|
5,114
sqft
|
built
1997
1611 Castle Pointe Dr, Castle Rock, CO 80104
$-10,482
Cash flow
-20.3%
Cash-on-Cash Return
1.0%
Cap rate
0.2%
Rent to Value Ratio

Active
$685,000
5
bds
|
3
ba
|
3,436
sqft
|
built
2021
2618 Villageview Ln, Castle Rock, CO 80104
$-1,415
Cash flow
-10.8%
Cash-on-Cash Return
3.2%
Cap rate
0.5%
Rent to Value Ratio

Active
$850,000
5
bds
|
5
ba
|
4,592
sqft
|
built
2015
3197 Cool Meadow Pl, Castle Rock, CO 80104
$-1,478
Cash flow
-9.1%
Cash-on-Cash Return
3.6%
Cap rate
0.5%
Rent to Value Ratio