80210 Investment Properties for Sale
Browse homes for sale and investment properties in 80210. Refine your search by price, property type, or more.
Best cash flowing properties in 80210
Active
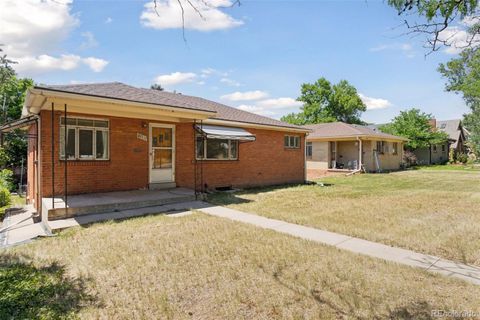
$250,000
2
bds
|
1
ba
|
885
sqft
|
built
1967
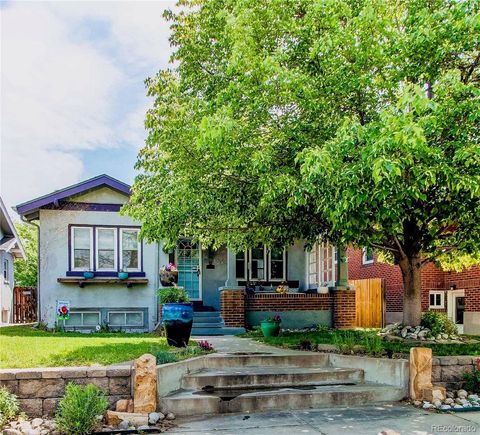
2225 Buchtel Blvd, Denver, CO 80210
$-216
Cash flow
-4.5%
Cash-on-Cash Return
4.6%
Cap rate
0.9%
Rent to Value Ratio
Active
$499,900
4
bds
|
2
ba
|
1,656
sqft
|
built
1955
1585 S University Blvd, Denver, CO 80210
$-426
Cash flow
-4.4%
Cash-on-Cash Return
4.7%
Cap rate
0.6%
Rent to Value Ratio
90 out of 94 properties for sale in 80210
Limited Results Shown
Create a free account, or log in to reveal all property listings and enjoy the complete experience.
Active
$719,500
4
bds
|
2
ba
|
1,580
sqft
|
built
1941
2634 S Humboldt St, Denver, CO 80210
$-1,521
Cash flow
-11.0%
Cash-on-Cash Return
3.1%
Cap rate
0.4%
Rent to Value Ratio
Active
$1,400,000
3
bds
|
4
ba
|
3,141
sqft
|
built
1890
1928 S Washington St, Denver, CO 80210
$-2,883
Cash flow
-10.7%
Cash-on-Cash Return
3.2%
Cap rate
0.4%
Rent to Value Ratio
Active
$1,290,000
4
bds
|
4
ba
|
3,600
sqft
|
built
2006
1907 S Columbine St, Denver, CO 80210
$-3,250
Cash flow
-13.1%
Cash-on-Cash Return
2.7%
Cap rate
0.4%
Rent to Value Ratio
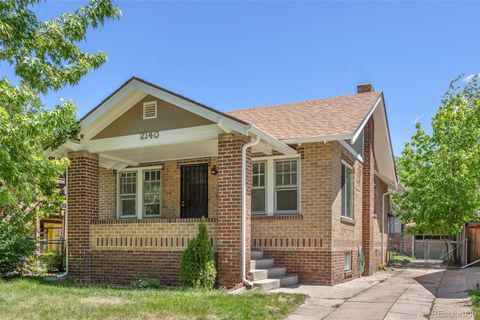
Active
$650,000
3
bds
|
1
ba
|
768
sqft
|
built
1928
2140 S Washington St, Denver, CO 80210
$-1,399
Cash flow
-11.2%
Cash-on-Cash Return
3.1%
Cap rate
0.4%
Rent to Value Ratio
Active
$875,000
4
bds
|
2
ba
|
1,844
sqft
|
built
1948
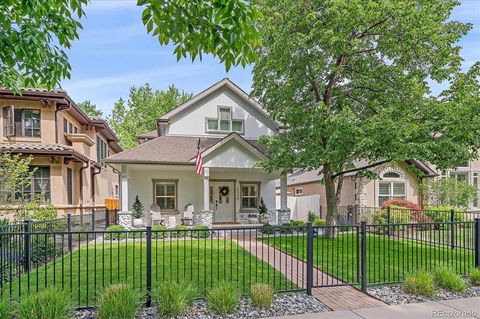
1100 S Garfield St, Denver, CO 80210
$-2,019
Cash flow
-12.0%
Cash-on-Cash Return
2.9%
Cap rate
0.4%
Rent to Value Ratio
Active
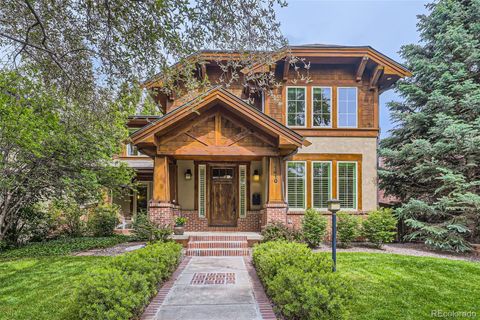
$899,000
3
bds
|
2
ba
|
1,855
sqft
|
built
1925
2232 S Ogden St, Denver, CO 80210
$-2,110
Cash flow
-12.2%
Cash-on-Cash Return
2.9%
Cap rate
0.4%
Rent to Value Ratio
Active
$749,000
3
bds
|
4
ba
|
2,524
sqft
|
built
2008
2314 S University Blvd, Denver, CO 80210
$-1,557
Cash flow
-10.8%
Cash-on-Cash Return
3.2%
Cap rate
0.5%
Rent to Value Ratio
Active
$1,950,000
6
bds
|
5
ba
|
4,903
sqft
|
built
2001
2411 S Garfield St, Denver, CO 80210
$-5,555
Cash flow
-14.9%
Cash-on-Cash Return
2.3%
Cap rate
0.3%
Rent to Value Ratio
Active
$1,210,000
5
bds
|
5
ba
|
3,500
sqft
|
built
2016
2420 S Gilpin St, Denver, CO 80210
$-3,100
Cash flow
-13.4%
Cash-on-Cash Return
2.6%
Cap rate
0.4%
Rent to Value Ratio
Active
$489,990
2
bds
|
2
ba
|
1,030
sqft
|
built
2018
2374 S University Blvd, Denver, CO 80210
$-1,043
Cash flow
-11.1%
Cash-on-Cash Return
3.1%
Cap rate
0.6%
Rent to Value Ratio
Active
$1,500,000
4
bds
|
3
ba
|
3,703
sqft
|
built
1961
3095 S Vine St, Denver, CO 80210
$-4,057
Cash flow
-14.1%
Cash-on-Cash Return
2.4%
Cap rate
0.3%
Rent to Value Ratio
Active
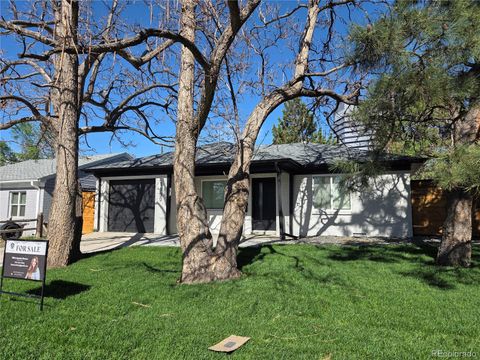
$725,000
3
bds
|
2
ba
|
1,023
sqft
|
built
1952
2730 S Cook St, Denver, CO 80210
$-1,531
Cash flow
-11.0%
Cash-on-Cash Return
3.1%
Cap rate
0.4%
Rent to Value Ratio
Active
$1,250,000
8
bds
|
4
ba
|
3,307
sqft
|
built
1955
2480 S Lafayette St, Denver, CO 80210
$-4,331
Cash flow
-18.1%
Cash-on-Cash Return
1.5%
Cap rate
0.2%
Rent to Value Ratio
Active
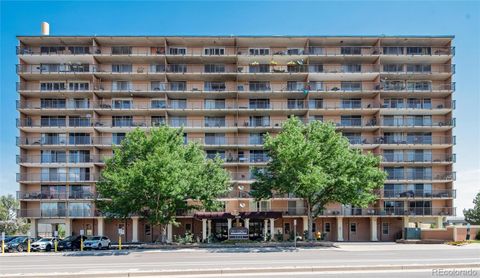
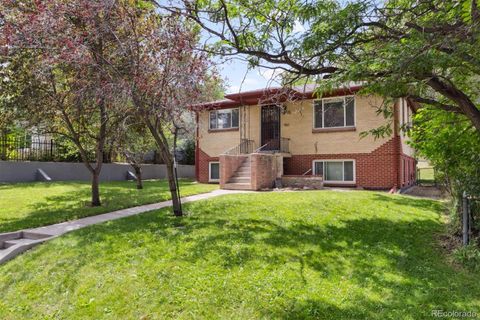
$250,000
1
bds
|
1
ba
|
698
sqft
|
built
1963
2500 S York St, Denver, CO 80210
$-939
Cash flow
-19.6%
Cash-on-Cash Return
1.2%
Cap rate
0.6%
Rent to Value Ratio
Active
$690,000
3
bds
|
1
ba
|
1,281
sqft
|
built
1930
1844 S Lincoln St, Denver, CO 80210
$-1,617
Cash flow
-12.2%
Cash-on-Cash Return
2.9%
Cap rate
0.4%
Rent to Value Ratio
Active
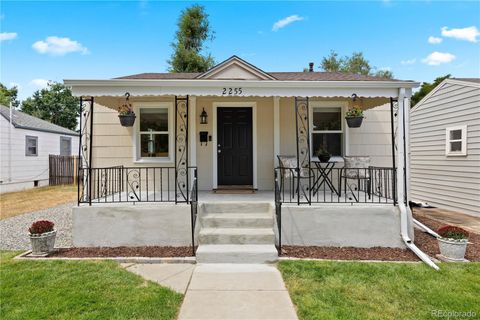
$735,000
4
bds
|
2
ba
|
1,612
sqft
|
built
1955
2515 S Pennsylvania St, Denver, CO 80210
$-1,842
Cash flow
-13.1%
Cash-on-Cash Return
2.7%
Cap rate
0.4%
Rent to Value Ratio
Active
$1,300,000
4
bds
|
3
ba
|
3,051
sqft
|
built
1931
1728 S Marion St, Denver, CO 80210
$-3,480
Cash flow
-14.0%
Cash-on-Cash Return
2.5%
Cap rate
0.4%
Rent to Value Ratio
Active
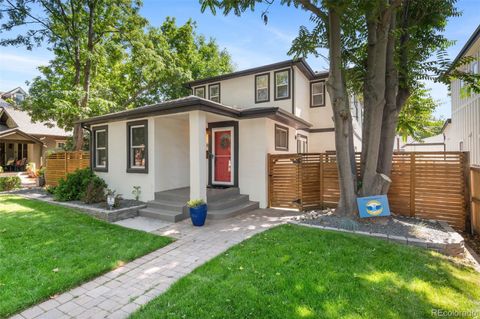
$745,000
4
bds
|
2
ba
|
1,534
sqft
|
built
1941
2255 S Franklin St, Denver, CO 80210
$-1,821
Cash flow
-12.8%
Cash-on-Cash Return
2.7%
Cap rate
0.4%
Rent to Value Ratio
Active
$1,300,000
3
bds
|
5
ba
|
2,773
sqft
|
built
2006
1735 S Pennsylvania St, Denver, CO 80210
$-3,578
Cash flow
-14.4%
Cash-on-Cash Return
2.4%
Cap rate
0.3%
Rent to Value Ratio
Active
$599,000
3
bds
|
2
ba
|
1,470
sqft
|
built
2006
2200 S University Blvd, Denver, CO 80210
$-1,624
Cash flow
-14.1%
Cash-on-Cash Return
2.4%
Cap rate
0.5%
Rent to Value Ratio
Active
$1,195,000
3
bds
|
3
ba
|
2,101
sqft
|
built
2018
1721 S Jackson St, Denver, CO 80210
$-3,046
Cash flow
-13.3%
Cash-on-Cash Return
2.6%
Cap rate
0.4%
Rent to Value Ratio
Active
$830,000
2
bds
|
2
ba
|
1,645
sqft
|
built
1932
1208 S Elizabeth St, Denver, CO 80210
$-1,850
Cash flow
-11.6%
Cash-on-Cash Return
3.0%
Cap rate
0.4%
Rent to Value Ratio
Active
$1,645,000
4
bds
|
4
ba
|
2,908
sqft
|
built
1941
1366 S Vine St, Denver, CO 80210
$-4,802
Cash flow
-15.2%
Cash-on-Cash Return
2.2%
Cap rate
0.3%
Rent to Value Ratio
Active
$2,049,000
4
bds
|
4
ba
|
3,609
sqft
|
built
2007
1364 S Lafayette St, Denver, CO 80210
$-6,151
Cash flow
-15.7%
Cash-on-Cash Return
2.1%
Cap rate
0.3%
Rent to Value Ratio
Active
$1,675,000
3
bds
|
3
ba
|
2,284
sqft
|
built
1929
1414 S Vine St, Denver, CO 80210
$-5,722
Cash flow
-17.8%
Cash-on-Cash Return
1.6%
Cap rate
0.2%
Rent to Value Ratio
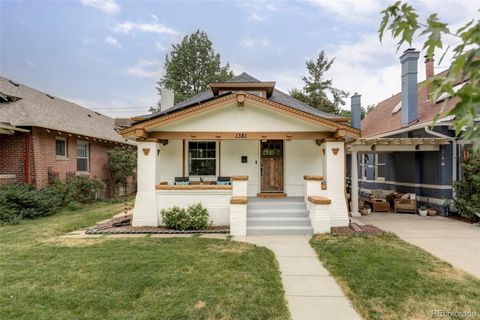
Active
$729,900
3
bds
|
1
ba
|
1,331
sqft
|
built
1908
1381 S Lincoln St, Denver, CO 80210
$-1,288
Cash flow
-9.2%
Cash-on-Cash Return
3.6%
Cap rate
0.5%
Rent to Value Ratio
Active
$1,045,000
3
bds
|
3
ba
|
2,619
sqft
|
built
1956
3223 S Columbine St, Denver, CO 80210
$-2,425
Cash flow
-12.1%
Cash-on-Cash Return
2.9%
Cap rate
0.4%
Rent to Value Ratio
Active
$2,450,000
6
bds
|
5
ba
|
5,785
sqft
|
built
2020
2732 S Jackson St, Denver, CO 80210
$-9,454
Cash flow
-20.1%
Cash-on-Cash Return
1.0%
Cap rate
0.2%
Rent to Value Ratio
Active
$740,000
3
bds
|
2
ba
|
1,415
sqft
|
built
1952
3209 E Yale Way, Denver, CO 80210
$-1,375
Cash flow
-9.7%
Cash-on-Cash Return
3.4%
Cap rate
0.5%
Rent to Value Ratio
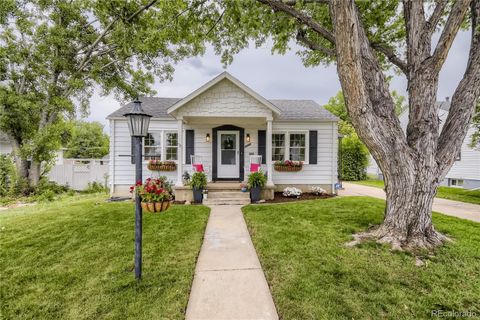
Active
$595,000
3
bds
|
2
ba
|
1,311
sqft
|
built
1932
1850 S Williams St, Denver, CO 80210
$-1,221
Cash flow
-10.7%
Cash-on-Cash Return
3.2%
Cap rate
0.5%
Rent to Value Ratio
Active
$1,900,000
4
bds
|
4
ba
|
3,968
sqft
|
built
1929
2340 S Columbine St, Denver, CO 80210
$-4,691
Cash flow
-12.9%
Cash-on-Cash Return
2.7%
Cap rate
0.4%
Rent to Value Ratio
Active
$1,999,000
4
bds
|
5
ba
|
3,942
sqft
|
built
2005
1410 S Elizabeth St, Denver, CO 80210
$-5,813
Cash flow
-15.2%
Cash-on-Cash Return
2.2%
Cap rate
0.3%
Rent to Value Ratio
Active
$450,000
2
bds
|
2
ba
|
879
sqft
|
built
2018
2374 S University Blvd, Denver, CO 80210
$-980
Cash flow
-11.4%
Cash-on-Cash Return
3.1%
Cap rate
0.6%
Rent to Value Ratio
Active
$844,900
3
bds
|
3
ba
|
1,298
sqft
|
built
1950
1130 S Harrison St, Denver, CO 80210
$-2,872
Cash flow
-17.7%
Cash-on-Cash Return
1.6%
Cap rate
0.2%
Rent to Value Ratio
Active
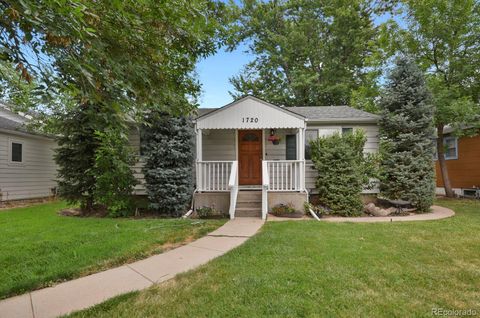
$665,000
3
bds
|
2
ba
|
1,588
sqft
|
built
1950
1720 S Madison St, Denver, CO 80210
$-1,248
Cash flow
-9.8%
Cash-on-Cash Return
3.4%
Cap rate
0.5%
Rent to Value Ratio
Active
$700,000
2
bds
|
2
ba
|
1,066
sqft
|
built
1935
1754 S Marion St, Denver, CO 80210
$-1,432
Cash flow
-10.7%
Cash-on-Cash Return
3.2%
Cap rate
0.5%
Rent to Value Ratio
Active
$1,598,000
5
bds
|
4
ba
|
3,585
sqft
|
built
2013
1156 S Columbine St, Denver, CO 80210
$-3,895
Cash flow
-12.7%
Cash-on-Cash Return
2.8%
Cap rate
0.4%
Rent to Value Ratio
Active
$1,075,000
5
bds
|
4
ba
|
3,234
sqft
|
built
2014
2077 S Clayton St, Denver, CO 80210
$-2,757
Cash flow
-13.4%
Cash-on-Cash Return
2.6%
Cap rate
0.4%
Rent to Value Ratio