80211 Investment Properties for Sale
Browse homes for sale and investment properties in 80211. Refine your search by price, property type, or more.
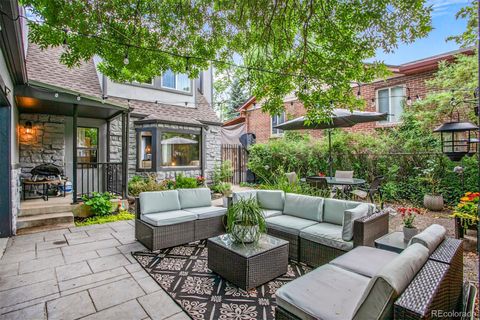
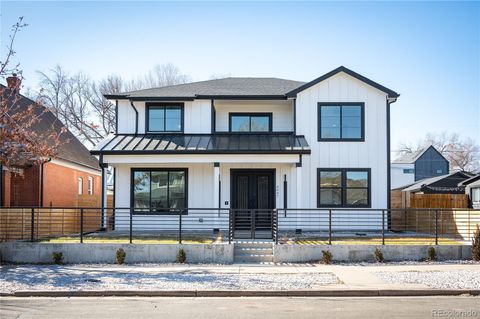
Best cash flowing properties in 80211
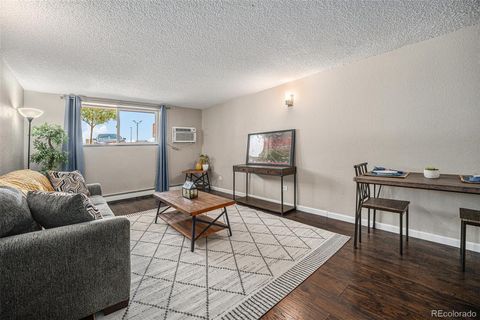
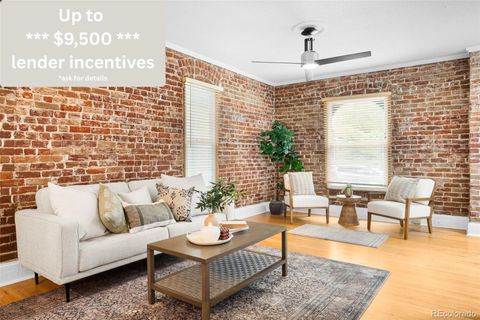
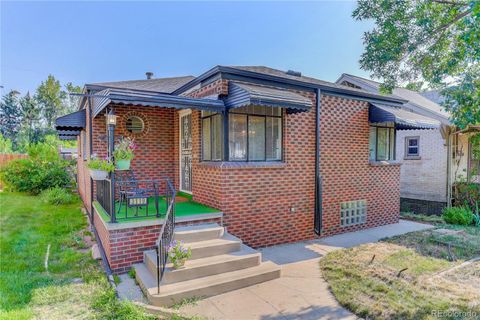
Active
$175,000
1
bds
|
1
ba
|
621
sqft
|
built
1970
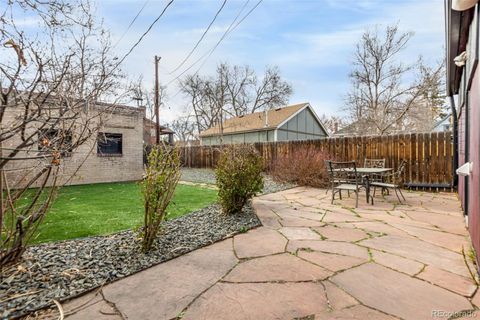
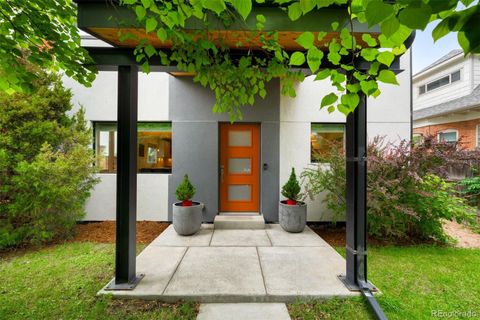
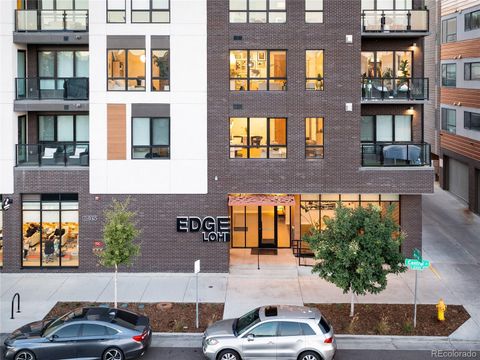
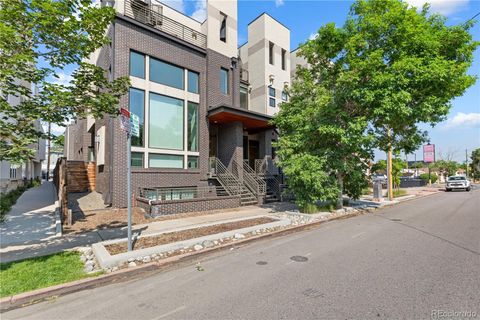
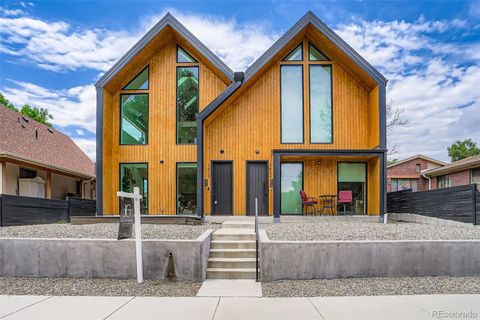
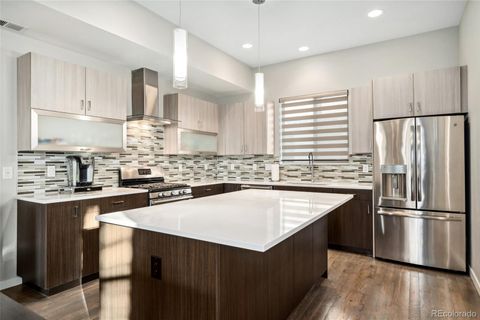
3047 W 47th Ave, Denver, CO 80211
$97
Cash flow
2.9%
Cash-on-Cash Return
6.3%
Cap rate
1.0%
Rent to Value Ratio
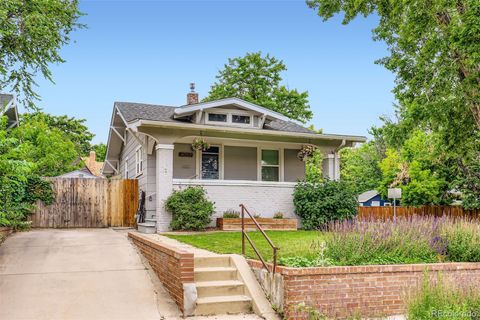
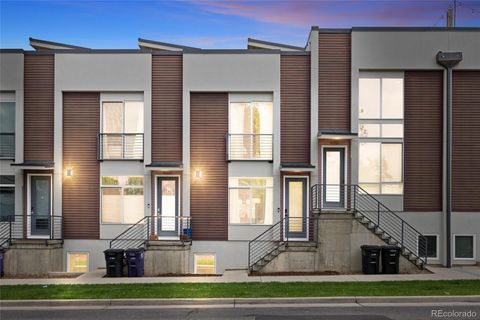
Active
$665,000
3
bds
|
2
ba
|
1,400
sqft
|
built
1926
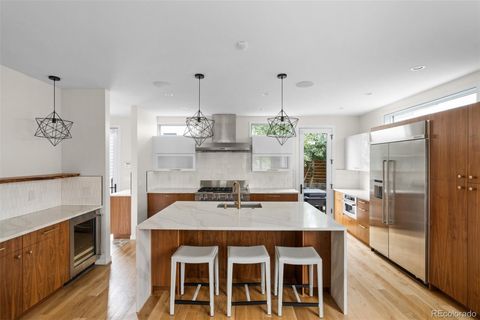
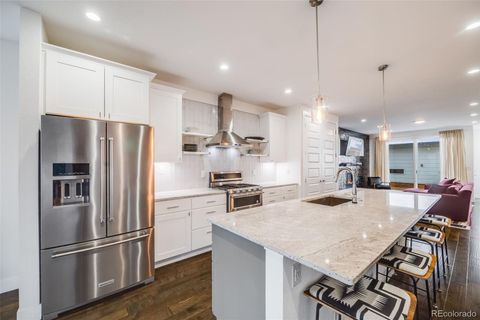
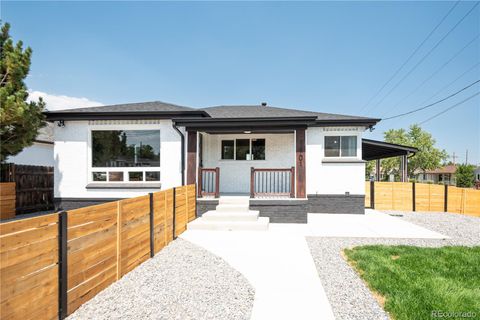
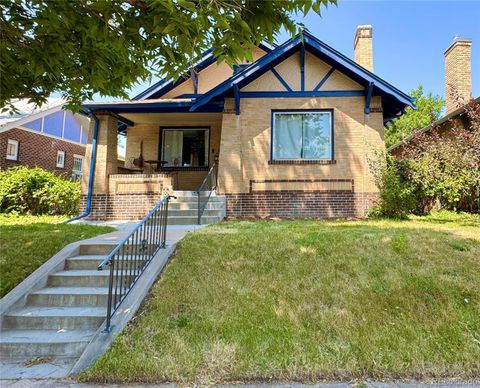
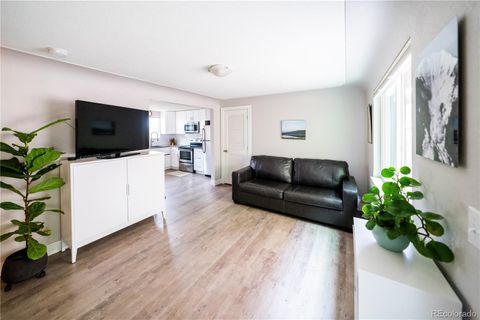
4057 Bryant St, Denver, CO 80211
$0
Cash flow
n/a
Cash-on-Cash Return
n/a
Cap rate
n/a
Rent to Value Ratio
147 out of 157 properties for sale in 80211
Limited Results Shown
Create a free account, or log in to reveal all property listings and enjoy the complete experience.
Active
$1,185,000
4
bds
|
3
ba
|
2,070
sqft
|
built
2013
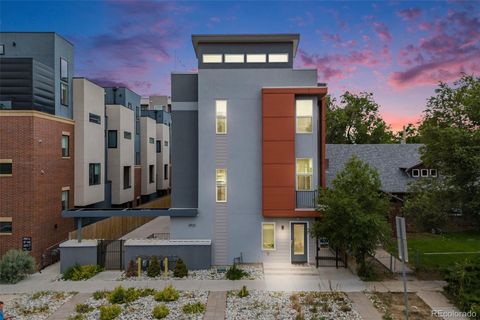
3361 Mariposa St, Denver, CO 80211
$-2,540
Cash flow
-11.2%
Cash-on-Cash Return
3.1%
Cap rate
0.4%
Rent to Value Ratio
Active
$1,706,250
7
bds
|
4
ba
|
3,958
sqft
|
built
1912
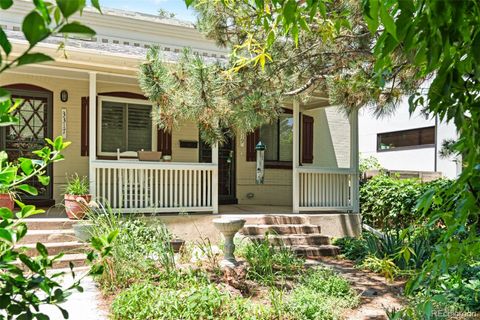
2900 W 32nd Ave, Denver, CO 80211
$-4,982
Cash flow
-15.2%
Cash-on-Cash Return
2.2%
Cap rate
0.3%
Rent to Value Ratio
Active
$735,000
4
bds
|
2
ba
|
1,341
sqft
|
built
1893
3375 W 37th Ave, Denver, CO 80211
$-1,337
Cash flow
-9.5%
Cash-on-Cash Return
3.5%
Cap rate
0.5%
Rent to Value Ratio
Active
$899,900
5
bds
|
2
ba
|
2,896
sqft
|
built
1949
4000 Irving St, Denver, CO 80211
$-2,271
Cash flow
-13.2%
Cash-on-Cash Return
2.7%
Cap rate
0.4%
Rent to Value Ratio
Active
$427,000
1
bds
|
1
ba
|
832
sqft
|
built
1996
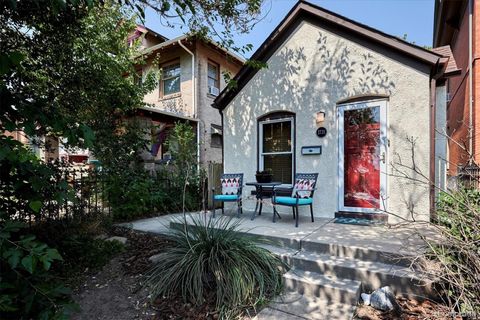
1521 Central St, Denver, CO 80211
$-1,008
Cash flow
-12.3%
Cash-on-Cash Return
2.8%
Cap rate
0.5%
Rent to Value Ratio
Active
$650,000
2
bds
|
2
ba
|
1,218
sqft
|
built
1891
3547 Osage St, Denver, CO 80211
$-716
Cash flow
-5.7%
Cash-on-Cash Return
4.4%
Cap rate
0.6%
Rent to Value Ratio
Active
$700,000
2
bds
|
2
ba
|
1,440
sqft
|
built
1905
3445 N Clay St, Denver, CO 80211
$-1,241
Cash flow
-9.2%
Cash-on-Cash Return
3.6%
Cap rate
0.5%
Rent to Value Ratio
Active
$2,499,900
6
bds
|
7
ba
|
4,617
sqft
|
built
2017
1845 W 33rd Ave, Denver, CO 80211
$-6,695
Cash flow
-14.0%
Cash-on-Cash Return
2.5%
Cap rate
0.4%
Rent to Value Ratio
Active
$575,000
1
bds
|
1
ba
|
737
sqft
|
built
1884
2731 W 32nd Ave, Denver, CO 80211
$-1,103
Cash flow
-10.0%
Cash-on-Cash Return
3.4%
Cap rate
0.5%
Rent to Value Ratio
Active
$415,000
1
bds
|
1
ba
|
648
sqft
|
built
1902
3211 Zuni St, Denver, CO 80211
$-866
Cash flow
-10.9%
Cash-on-Cash Return
3.2%
Cap rate
0.5%
Rent to Value Ratio
Active
$995,000
4
bds
|
4
ba
|
1,954
sqft
|
built
2014
3727 Tejon St, Denver, CO 80211
$-1,986
Cash flow
-10.4%
Cash-on-Cash Return
3.3%
Cap rate
0.5%
Rent to Value Ratio
Active
$959,000
3
bds
|
4
ba
|
2,317
sqft
|
built
2016
4390 Osage St, Denver, CO 80211
$-1,221
Cash flow
-6.6%
Cash-on-Cash Return
4.2%
Cap rate
0.6%
Rent to Value Ratio
Active
$599,999
2
bds
|
2
ba
|
1,247
sqft
|
built
1998
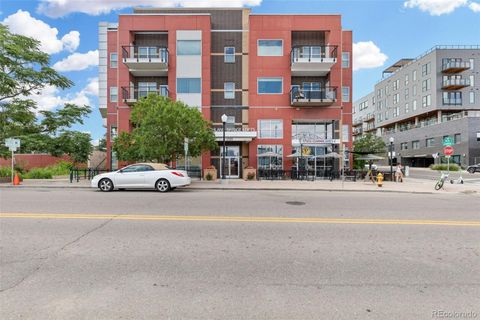
2501 15th St, Denver, CO 80211
$-1,489
Cash flow
-12.9%
Cash-on-Cash Return
2.7%
Cap rate
0.5%
Rent to Value Ratio
Active
$789,900
2
bds
|
3
ba
|
1,825
sqft
|
built
2011
2610 Front View Cres, Denver, CO 80211
$-1,700
Cash flow
-11.2%
Cash-on-Cash Return
3.1%
Cap rate
0.5%
Rent to Value Ratio
Active
$900,000
2
bds
|
2
ba
|
1,190
sqft
|
built
2020
1735 Central St, Denver, CO 80211
$-2,097
Cash flow
-12.2%
Cash-on-Cash Return
2.9%
Cap rate
0.5%
Rent to Value Ratio
Active
$865,000
4
bds
|
3
ba
|
1,028
sqft
|
built
1948
1901 W 47th Ave, Denver, CO 80211
$-2,192
Cash flow
-13.2%
Cash-on-Cash Return
2.6%
Cap rate
0.4%
Rent to Value Ratio
Active
$543,500
3
bds
|
2
ba
|
1,085
sqft
|
built
2000
2985 W 46th Ave, Denver, CO 80211
$-1,041
Cash flow
-10.0%
Cash-on-Cash Return
3.4%
Cap rate
0.5%
Rent to Value Ratio
Active
$1,199,500
3
bds
|
4
ba
|
2,317
sqft
|
built
2018
4455 Tejon St, Denver, CO 80211
$-2,628
Cash flow
-11.4%
Cash-on-Cash Return
3.0%
Cap rate
0.4%
Rent to Value Ratio
Active
$1,749,998
3
bds
|
5
ba
|
3,322
sqft
|
built
2016
3535 Tejon St, Denver, CO 80211
$-3,427
Cash flow
-10.2%
Cash-on-Cash Return
3.3%
Cap rate
0.5%
Rent to Value Ratio
Active
$749,000
2
bds
|
2
ba
|
1,140
sqft
|
built
2007
2200 W 29th Ave, Denver, CO 80211
$-2,193
Cash flow
-15.3%
Cash-on-Cash Return
2.2%
Cap rate
0.4%
Rent to Value Ratio
Active
$435,000
1
bds
|
1
ba
|
888
sqft
|
built
2007
1555 Central St, Denver, CO 80211
$-941
Cash flow
-11.3%
Cash-on-Cash Return
3.1%
Cap rate
0.6%
Rent to Value Ratio
Active
$825,000
3
bds
|
2
ba
|
1,673
sqft
|
built
1925
2663 King St, Denver, CO 80211
$-2,030
Cash flow
-12.8%
Cash-on-Cash Return
2.7%
Cap rate
0.4%
Rent to Value Ratio
Active
$1,199,000
4
bds
|
5
ba
|
3,145
sqft
|
built
2019
3829 Osage St, Denver, CO 80211
$-1,689
Cash flow
-7.3%
Cash-on-Cash Return
4.0%
Cap rate
0.5%
Rent to Value Ratio
Active
$725,000
2
bds
|
1
ba
|
1,000
sqft
|
built
1952
2031 Meade St, Denver, CO 80211
$-1,248
Cash flow
-9.0%
Cash-on-Cash Return
3.6%
Cap rate
0.5%
Rent to Value Ratio
Active
$1,099,000
4
bds
|
3
ba
|
2,953
sqft
|
built
1909
3811 N Clay St, Denver, CO 80211
$-1,946
Cash flow
-9.2%
Cash-on-Cash Return
3.6%
Cap rate
0.5%
Rent to Value Ratio

Active
$699,000
5
bds
|
2
ba
|
1,687
sqft
|
built
1925
4556 Decatur St, Denver, CO 80211
$-1,435
Cash flow
-10.7%
Cash-on-Cash Return
3.2%
Cap rate
0.4%
Rent to Value Ratio
Active
$685,000
3
bds
|
2
ba
|
1,593
sqft
|
built
1955
3835 Pecos St, Denver, CO 80211
$-1,101
Cash flow
-8.4%
Cash-on-Cash Return
3.8%
Cap rate
0.5%
Rent to Value Ratio
Active
$869,900
2
bds
|
3
ba
|
2,031
sqft
|
built
2014
2622 W 24th Ave, Denver, CO 80211
$-1,717
Cash flow
-10.3%
Cash-on-Cash Return
3.3%
Cap rate
0.5%
Rent to Value Ratio
Active
$337,500
1
bds
|
1
ba
|
546
sqft
|
built
1954
2714 Federal Blvd, Denver, CO 80211
$-429
Cash flow
-6.6%
Cash-on-Cash Return
4.2%
Cap rate
0.6%
Rent to Value Ratio
Active
$664,000
2
bds
|
4
ba
|
1,593
sqft
|
built
2016
2922 W 26th Ave, Denver, CO 80211
$-737
Cash flow
-5.8%
Cash-on-Cash Return
4.3%
Cap rate
0.6%
Rent to Value Ratio
Active
$499,900
2
bds
|
1
ba
|
738
sqft
|
built
1910
3319 Newton St, Denver, CO 80211
$-661
Cash flow
-6.9%
Cash-on-Cash Return
4.1%
Cap rate
0.6%
Rent to Value Ratio
Active
$1,448,000
4
bds
|
4
ba
|
3,199
sqft
|
built
1939
4570 Irving St, Denver, CO 80211
$-3,547
Cash flow
-12.8%
Cash-on-Cash Return
2.7%
Cap rate
0.4%
Rent to Value Ratio

Active
$1,590,000
6
bds
|
6
ba
|
4,382
sqft
|
built
2022
4721 Elm Ct, Denver, CO 80211
$-4,496
Cash flow
-14.8%
Cash-on-Cash Return
2.3%
Cap rate
0.3%
Rent to Value Ratio
Active
$1,194,000
3
bds
|
4
ba
|
2,605
sqft
|
built
2006
2034 Newton St, Denver, CO 80211
$-2,609
Cash flow
-11.4%
Cash-on-Cash Return
3.1%
Cap rate
0.4%
Rent to Value Ratio
Active
$2,100,000
5
bds
|
5
ba
|
4,500
sqft
|
built
2025
4647 Bryant St, Denver, CO 80211
$-7,610
Cash flow
-18.9%
Cash-on-Cash Return
1.3%
Cap rate
0.2%
Rent to Value Ratio
Active
$1,119,000
4
bds
|
5
ba
|
3,027
sqft
|
built
2016
3941 Vallejo St, Denver, CO 80211
$-2,585
Cash flow
-12.1%
Cash-on-Cash Return
2.9%
Cap rate
0.4%
Rent to Value Ratio
Active
$760,000
3
bds
|
4
ba
|
1,562
sqft
|
built
2016
4314 Pecos St, Denver, CO 80211
$-1,198
Cash flow
-8.2%
Cash-on-Cash Return
3.8%
Cap rate
0.5%
Rent to Value Ratio
Active
$795,000
4
bds
|
2
ba
|
1,002
sqft
|
built
1949
3119 W 44th Ave, Denver, CO 80211
$-1,579
Cash flow
-10.4%
Cash-on-Cash Return
3.3%
Cap rate
0.5%
Rent to Value Ratio