80503 Investment Properties for Sale
Browse homes for sale and investment properties in 80503. Refine your search by price, property type, or more.
Best cash flowing properties in 80503
Active
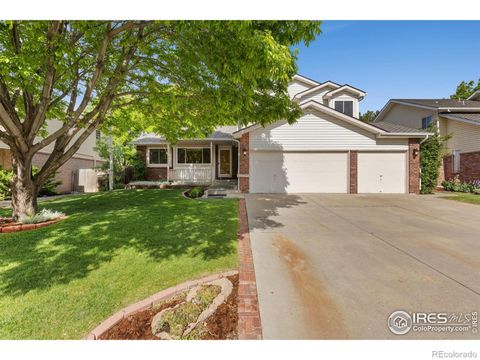
$525,000
3
bds
|
2
ba
|
1,508
sqft
|
built
1995
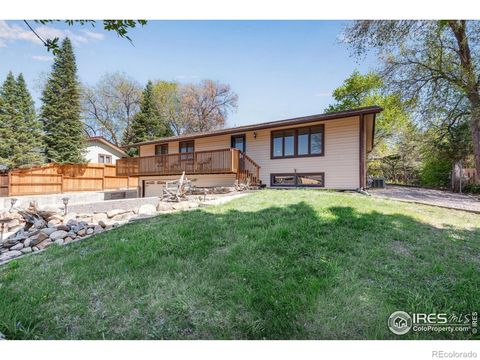
791 Thornwood Cir, Longmont, CO 80503
$-828
Cash flow
-8.2%
Cash-on-Cash Return
3.8%
Cap rate
0.5%
Rent to Value Ratio
Active
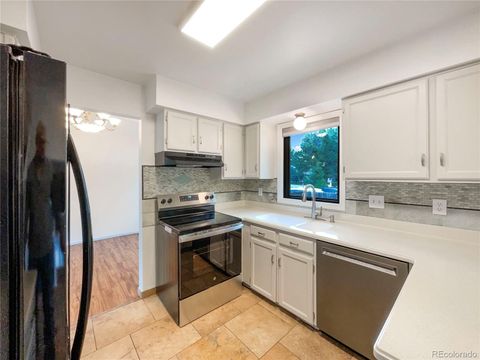
$385,000
2
bds
|
2
ba
|
1,152
sqft
|
built
1974
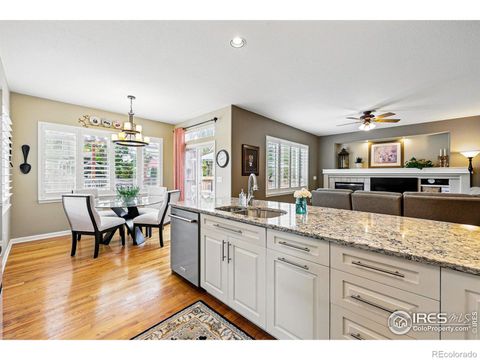
8060 Niwot Rd, Niwot, CO 80503
$-867
Cash flow
-11.7%
Cash-on-Cash Return
3.0%
Cap rate
0.6%
Rent to Value Ratio
85 out of 93 properties for sale in 80503
Limited Results Shown
Create a free account, or log in to reveal all property listings and enjoy the complete experience.
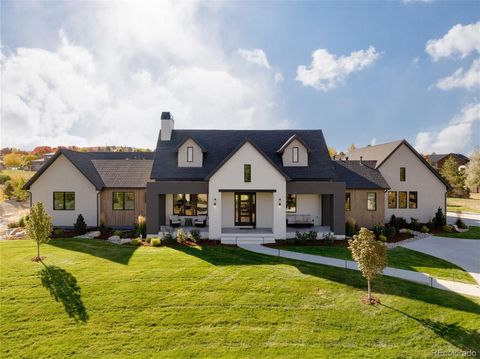
Active
$899,999
4
bds
|
4
ba
|
2,622
sqft
|
built
1996
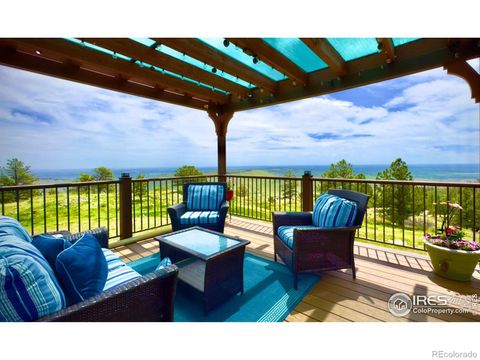
3142 Captains Ln, Longmont, CO 80503
$-2,311
Cash flow
-13.4%
Cash-on-Cash Return
2.6%
Cap rate
0.4%
Rent to Value Ratio
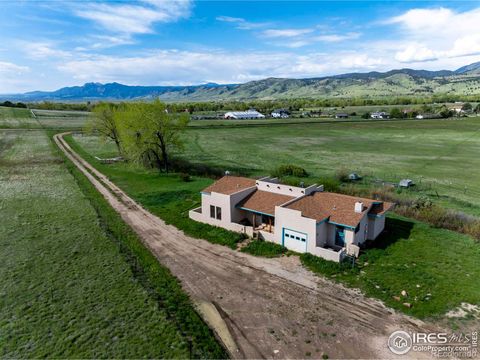
Active
$1,250,000
3
bds
|
2
ba
|
2,019
sqft
|
built
1995
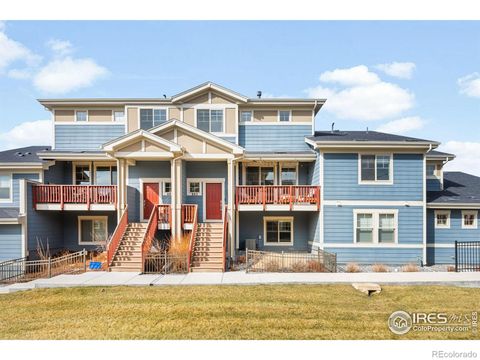
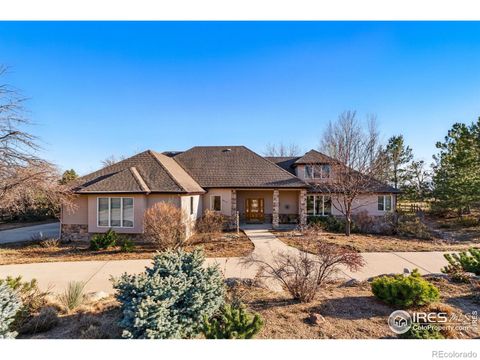
3001 Eagle Ridge Rd, Longmont, CO 80503
$-2,590
Cash flow
-10.8%
Cash-on-Cash Return
3.2%
Cap rate
0.5%
Rent to Value Ratio
Active
$854,000
4
bds
|
3
ba
|
2,255
sqft
|
built
1969
7240 Glacier View Rd, Longmont, CO 80503
$-2,223
Cash flow
-13.6%
Cash-on-Cash Return
2.6%
Cap rate
0.4%
Rent to Value Ratio
Active
$699,000
3
bds
|
3
ba
|
2,127
sqft
|
built
1999
301 Widgeon Dr, Longmont, CO 80503
$-1,591
Cash flow
-11.9%
Cash-on-Cash Return
2.9%
Cap rate
0.4%
Rent to Value Ratio
Active
$1,385,000
4
bds
|
3
ba
|
3,090
sqft
|
built
1977
15757 Mossrock Dr, Longmont, CO 80503
$-4,376
Cash flow
-16.5%
Cash-on-Cash Return
1.9%
Cap rate
0.3%
Rent to Value Ratio
Active
$534,900
3
bds
|
3
ba
|
2,342
sqft
|
built
2018
883 Widgeon Cir, Longmont, CO 80503
$-912
Cash flow
-8.9%
Cash-on-Cash Return
3.6%
Cap rate
0.6%
Rent to Value Ratio
Active
$1,550,000
3
bds
|
4
ba
|
4,769
sqft
|
built
1997
8858 Prairie Knoll Dr, Longmont, CO 80503
$-5,444
Cash flow
-18.3%
Cash-on-Cash Return
1.5%
Cap rate
0.3%
Rent to Value Ratio
Active
$555,000
4
bds
|
2
ba
|
2,240
sqft
|
built
1971
1545 Drake St, Longmont, CO 80503
$-1,078
Cash flow
-10.1%
Cash-on-Cash Return
3.3%
Cap rate
0.5%
Rent to Value Ratio
Active
$675,000
4
bds
|
4
ba
|
2,114
sqft
|
built
1997
1313 Carnation Cir, Longmont, CO 80503
$-1,465
Cash flow
-11.3%
Cash-on-Cash Return
3.1%
Cap rate
0.5%
Rent to Value Ratio
Active
$1,475,000
4
bds
|
4
ba
|
4,350
sqft
|
built
1989
7528 Estate Cir, Niwot, CO 80503
$-4,710
Cash flow
-16.7%
Cash-on-Cash Return
1.8%
Cap rate
0.3%
Rent to Value Ratio
Active
$466,000
2
bds
|
3
ba
|
1,318
sqft
|
built
2005
4110 Riley Dr, Longmont, CO 80503
$-933
Cash flow
-10.4%
Cash-on-Cash Return
3.3%
Cap rate
0.5%
Rent to Value Ratio
Active
$475,000
3
bds
|
3
ba
|
1,470
sqft
|
built
2016
749 Robert St, Longmont, CO 80503
$-943
Cash flow
-10.4%
Cash-on-Cash Return
3.3%
Cap rate
0.6%
Rent to Value Ratio
Active
$600,000
3
bds
|
2
ba
|
1,700
sqft
|
built
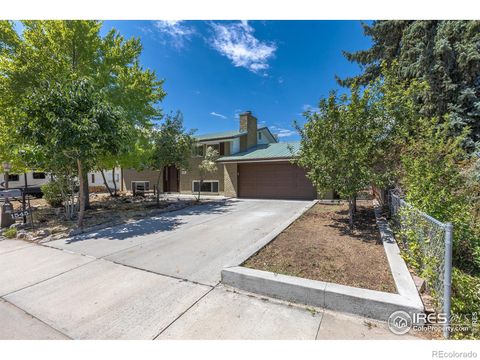
1966
12682 Anhawa Ave, Longmont, CO 80503
$-1,041
Cash flow
-9.1%
Cash-on-Cash Return
3.6%
Cap rate
0.5%
Rent to Value Ratio
Active
$3,999,999
5
bds
|
8
ba
|
7,775
sqft
|
built
2008
6851 Goldbranch Dr, Niwot, CO 80503
$-15,127
Cash flow
-19.7%
Cash-on-Cash Return
1.1%
Cap rate
0.2%
Rent to Value Ratio
Active
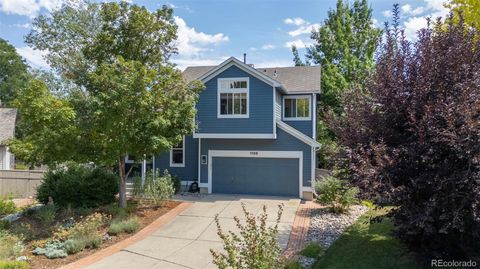
$720,000
4
bds
|
3
ba
|
2,577
sqft
|
built
1994
1108 Chokecherry Ln, Longmont, CO 80503
$-1,660
Cash flow
-12.0%
Cash-on-Cash Return
2.9%
Cap rate
0.4%
Rent to Value Ratio
Active
$875,000
5
bds
|
4
ba
|
3,636
sqft
|
built
1998
1414 Wildrose Dr, Longmont, CO 80503
$-1,849
Cash flow
-11.0%
Cash-on-Cash Return
3.1%
Cap rate
0.5%
Rent to Value Ratio
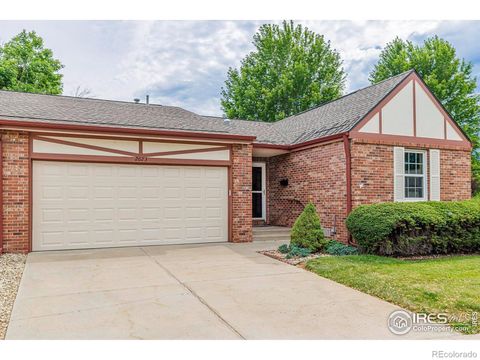
Active
$562,500
2
bds
|
3
ba
|
2,662
sqft
|
built
1986
2623 Elmhurst Cir, Longmont, CO 80503
$-1,422
Cash flow
-13.2%
Cash-on-Cash Return
2.6%
Cap rate
0.5%
Rent to Value Ratio
Active
$2,450,000
3
bds
|
3
ba
|
3,184
sqft
|
built
1999
6423 Monarch Park Ct, Niwot, CO 80503
$-8,213
Cash flow
-17.5%
Cash-on-Cash Return
1.7%
Cap rate
0.2%
Rent to Value Ratio
Active
$498,000
5
bds
|
2
ba
|
798
sqft
|
built
1976
1262 Lanyon Ln, Longmont, CO 80503
$-1,310
Cash flow
-13.7%
Cash-on-Cash Return
2.5%
Cap rate
0.4%
Rent to Value Ratio
Active
$3,750,000
5
bds
|
6
ba
|
6,242
sqft
|
built
1998
5101 Saint Vrain Rd, Longmont, CO 80503
$-13,760
Cash flow
-19.1%
Cash-on-Cash Return
1.3%
Cap rate
0.3%
Rent to Value Ratio
Active
$1,550,000
5
bds
|
4
ba
|
4,566
sqft
|
built
1987
4046 Niblick Dr, Longmont, CO 80503
$-4,299
Cash flow
-14.5%
Cash-on-Cash Return
2.4%
Cap rate
0.4%
Rent to Value Ratio
Active
$1,195,000
3
bds
|
2
ba
|
1,874
sqft
|
built
1972
9445 Lykins Pl, Longmont, CO 80503
$-3,953
Cash flow
-17.3%
Cash-on-Cash Return
1.7%
Cap rate
0.3%
Rent to Value Ratio
Active
$639,500
4
bds
|
4
ba
|
1,725
sqft
|
built
1993
2421 Maplewood Cir W, Longmont, CO 80503
$-1,285
Cash flow
-10.5%
Cash-on-Cash Return
3.3%
Cap rate
0.5%
Rent to Value Ratio
Active
$581,000
5
bds
|
4
ba
|
2,467
sqft
|
built
1984
1460 Belmont Dr, Longmont, CO 80503
$-941
Cash flow
-8.5%
Cash-on-Cash Return
3.7%
Cap rate
0.5%
Rent to Value Ratio
Active
$1,600,000
2
bds
|
2
ba
|
1,547
sqft
|
built
1992
8602 N 39th St, Longmont, CO 80503
$-5,630
Cash flow
-18.4%
Cash-on-Cash Return
1.5%
Cap rate
0.3%
Rent to Value Ratio
Active
$5,699,000
5
bds
|
6
ba
|
7,168
sqft
|
built
2022
6816 Goldbranch Dr, Niwot, CO 80503
$-22,254
Cash flow
-20.4%
Cash-on-Cash Return
1.0%
Cap rate
0.2%
Rent to Value Ratio
Active
$1,695,000
3
bds
|
4
ba
|
3,451
sqft
|
built
1996
5986 Heather Way, Niwot, CO 80503
$-4,917
Cash flow
-15.1%
Cash-on-Cash Return
2.2%
Cap rate
0.3%
Rent to Value Ratio
Active
$25,000,000
6
bds
|
8
ba
|
10,801
sqft
|
built
2006
6880 Saint Vrain Rd, Longmont, CO 80503
$-115,957
Cash flow
-24.2%
Cash-on-Cash Return
0.1%
Cap rate
0.0%
Rent to Value Ratio
Active
$660,000
3
bds
|
1
ba
|
1,893
sqft
|
built
1969
12884 Anhawa Ave, Longmont, CO 80503
$-1,279
Cash flow
-10.1%
Cash-on-Cash Return
3.4%
Cap rate
0.5%
Rent to Value Ratio
Active
$2,690,000
5
bds
|
5
ba
|
5,405
sqft
|
built
2005
6557 Legend Ridge Trl, Niwot, CO 80503
$-9,073
Cash flow
-17.6%
Cash-on-Cash Return
1.6%
Cap rate
0.3%
Rent to Value Ratio
Active
$3,200,000
5
bds
|
7
ba
|
6,265
sqft
|
built
2006
9260 Shooting Star Ct, Niwot, CO 80503
$-12,771
Cash flow
-20.8%
Cash-on-Cash Return
0.9%
Cap rate
0.2%
Rent to Value Ratio
Active
$619,999
3
bds
|
4
ba
|
2,388
sqft
|
built
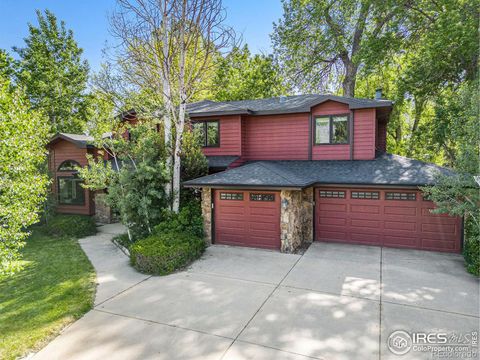
1992
2935 Bow Line Pl, Longmont, CO 80503
$-1,320
Cash flow
-11.1%
Cash-on-Cash Return
3.1%
Cap rate
0.5%
Rent to Value Ratio
Active
$620,000
4
bds
|
3
ba
|
2,325
sqft
|
built
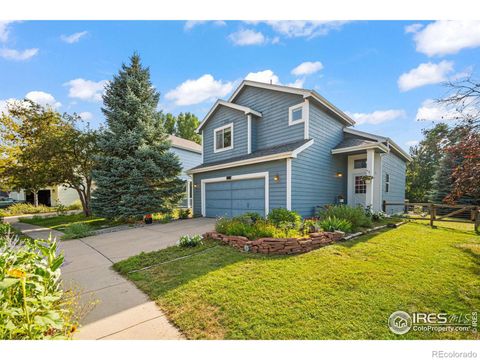
1992
2912 Lake Park Way, Longmont, CO 80503
$-1,177
Cash flow
-9.9%
Cash-on-Cash Return
3.4%
Cap rate
0.5%
Rent to Value Ratio
Active
$22,500,000
5
bds
|
10
ba
|
13,284
sqft
|
built
2004
7484 N 49th St, Longmont, CO 80503
$-106,918
Cash flow
-24.8%
Cash-on-Cash Return
0.0%
Cap rate
0.0%
Rent to Value Ratio
Active
$3,695,000
4
bds
|
3
ba
|
2,924
sqft
|
built
1920
5196 Oxford Rd, Longmont, CO 80503
$-14,067
Cash flow
-19.9%
Cash-on-Cash Return
1.1%
Cap rate
0.2%
Rent to Value Ratio
Active
$920,000
6
bds
|
4
ba
|
3,845
sqft
|
built
2005
4119 Riley Dr, Longmont, CO 80503
$-2,319
Cash flow
-13.2%
Cash-on-Cash Return
2.7%
Cap rate
0.4%
Rent to Value Ratio
Active
$875,000
4
bds
|
2
ba
|
2,228
sqft
|
built
1965
8840 Niwot Rd, Niwot, CO 80503
$-2,298
Cash flow
-13.7%
Cash-on-Cash Return
2.5%
Cap rate
0.4%
Rent to Value Ratio
Active
$1,475,000
4
bds
|
3
ba
|
4,948
sqft
|
built
1989
6668 Fairways Dr, Longmont, CO 80503
$-4,694
Cash flow
-16.6%
Cash-on-Cash Return
1.9%
Cap rate
0.3%
Rent to Value Ratio