80550 Investment Properties for Sale
Browse homes for sale and investment properties in 80550. Refine your search by price, property type, or more.
Best cash flowing properties in 80550
Active
$269,900
2
bds
|
1
ba
|
826
sqft
|
built
1980
909 Conifer Ct, Windsor, CO 80550
$-457
Cash flow
-8.8%
Cash-on-Cash Return
3.6%
Cap rate
0.7%
Rent to Value Ratio
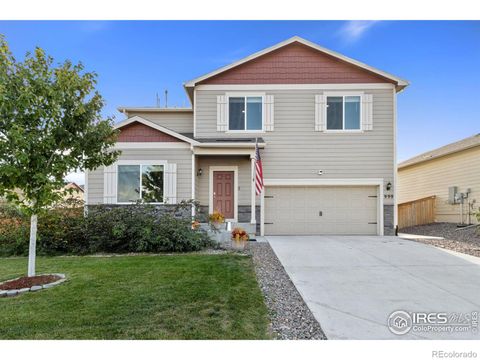
Active
$449,900
4
bds
|
3
ba
|
1,815
sqft
|
built
2018
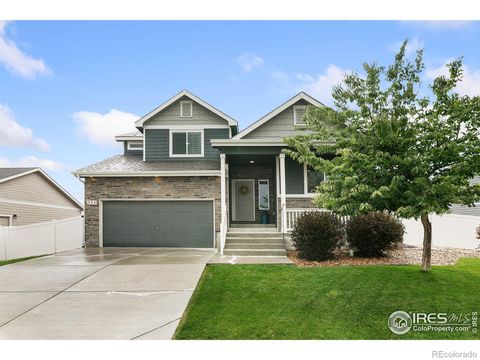
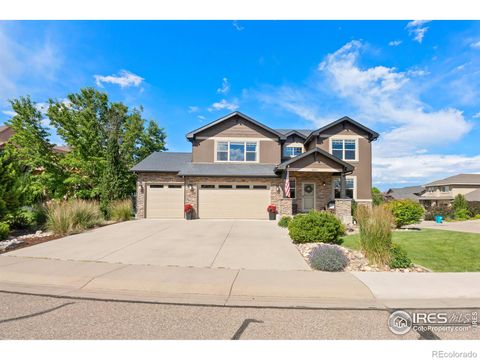
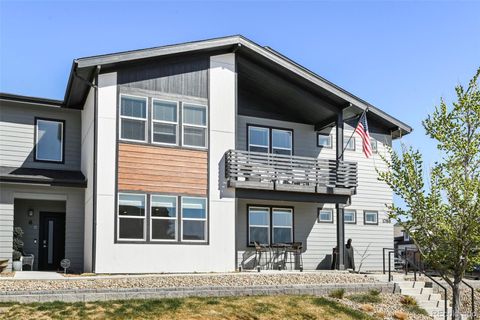
725 Mt Evans Ave, Severance, CO 80550
$-734
Cash flow
-8.5%
Cash-on-Cash Return
3.7%
Cap rate
0.6%
Rent to Value Ratio
154 out of 168 properties for sale in 80550
Limited Results Shown
Create a free account, or log in to reveal all property listings and enjoy the complete experience.
Active
$899,900
4
bds
|
4
ba
|
3,251
sqft
|
built
2020
6712 Olympia Fields Ct, Windsor, CO 80550
$-2,175
Cash flow
-12.6%
Cash-on-Cash Return
2.8%
Cap rate
0.4%
Rent to Value Ratio
Active
$670,000
3
bds
|
3
ba
|
2,182
sqft
|
built
2011
7401 Pimlico Dr, Windsor, CO 80550
$-1,337
Cash flow
-10.4%
Cash-on-Cash Return
3.3%
Cap rate
0.5%
Rent to Value Ratio
Active
$825,000
7
bds
|
6
ba
|
6,041
sqft
|
built
2014
1997 Cayman Dr, Windsor, CO 80550
$-2,393
Cash flow
-15.1%
Cash-on-Cash Return
2.2%
Cap rate
0.4%
Rent to Value Ratio
Active
$650,000
5
bds
|
3
ba
|
2,770
sqft
|
built
2021
1576 Illingworth Dr, Windsor, CO 80550
$-1,319
Cash flow
-10.6%
Cash-on-Cash Return
3.2%
Cap rate
0.5%
Rent to Value Ratio
Active
$555,000
4
bds
|
3
ba
|
2,534
sqft
|
built
2017
2283 Stonefish Dr, Windsor, CO 80550
$-1,071
Cash flow
-10.1%
Cash-on-Cash Return
3.4%
Cap rate
0.5%
Rent to Value Ratio
Active
$759,000
4
bds
|
3
ba
|
2,772
sqft
|
built
2006
453 Harbor Ct, Windsor, CO 80550
$-1,730
Cash flow
-11.9%
Cash-on-Cash Return
2.9%
Cap rate
0.5%
Rent to Value Ratio
Active
$369,000
2
bds
|
2
ba
|
1,002
sqft
|
built
2020
6510 Crystal Downs Dr, Windsor, CO 80550
$-890
Cash flow
-12.6%
Cash-on-Cash Return
2.8%
Cap rate
0.6%
Rent to Value Ratio

Active
$649,999
5
bds
|
3
ba
|
2,981
sqft
|
built
2020
4586 Binfield Dr, Windsor, CO 80550
$-1,587
Cash flow
-12.7%
Cash-on-Cash Return
2.7%
Cap rate
0.4%
Rent to Value Ratio
Active
$420,000
2
bds
|
3
ba
|
1,522
sqft
|
built
2016
2167 Montauk Ln, Windsor, CO 80550
$-991
Cash flow
-12.3%
Cash-on-Cash Return
2.8%
Cap rate
0.5%
Rent to Value Ratio
Active
$519,999
4
bds
|
3
ba
|
2,389
sqft
|
built
2020
1205 Muskox St, Severance, CO 80550
$-1,056
Cash flow
-10.6%
Cash-on-Cash Return
3.2%
Cap rate
0.5%
Rent to Value Ratio
Active
$479,000
3
bds
|
2
ba
|
1,965
sqft
|
built
2020
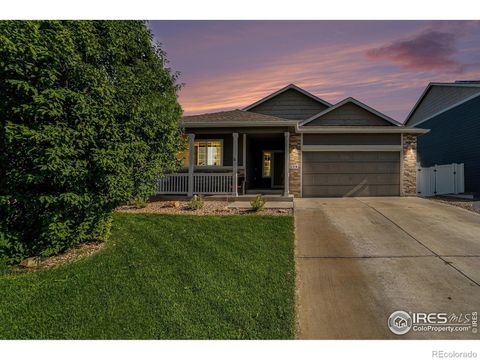
1065 Long Meadows St, Severance, CO 80550
$-884
Cash flow
-9.6%
Cash-on-Cash Return
3.5%
Cap rate
0.5%
Rent to Value Ratio
Active
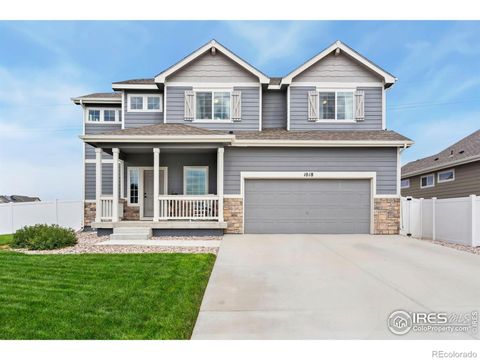
$559,000
4
bds
|
3
ba
|
2,122
sqft
|
built
2022
1018 Kendalbrook Dr, Windsor, CO 80550
$-1,128
Cash flow
-10.5%
Cash-on-Cash Return
3.3%
Cap rate
0.5%
Rent to Value Ratio
Active
$948,900
4
bds
|
5
ba
|
2,658
sqft
|
built
2014
8181 Wynstone Dr, Windsor, CO 80550
$-2,596
Cash flow
-14.3%
Cash-on-Cash Return
2.4%
Cap rate
0.4%
Rent to Value Ratio
Active
$709,000
4
bds
|
4
ba
|
2,980
sqft
|
built
1999
238 Wood Duck Ct, Windsor, CO 80550
$-1,612
Cash flow
-11.9%
Cash-on-Cash Return
3.0%
Cap rate
0.5%
Rent to Value Ratio
Active
$410,000
2
bds
|
2
ba
|
1,175
sqft
|
built
2023
1800 Iron Wheel Dr, Windsor, CO 80550
$-945
Cash flow
-12.0%
Cash-on-Cash Return
2.9%
Cap rate
0.5%
Rent to Value Ratio
Active
$809,500
5
bds
|
4
ba
|
3,433
sqft
|
built
2013
5504 Fairmount Dr, Windsor, CO 80550
$-2,074
Cash flow
-13.4%
Cash-on-Cash Return
2.6%
Cap rate
0.4%
Rent to Value Ratio
Active
$715,000
4
bds
|
4
ba
|
2,408
sqft
|
built
2020
2124 Glean Ct, Windsor, CO 80550
$-1,091
Cash flow
-8.0%
Cash-on-Cash Return
3.8%
Cap rate
0.6%
Rent to Value Ratio
Active
$475,000
3
bds
|
2
ba
|
1,453
sqft
|
built
2016
586 Cherryridge Dr, Windsor, CO 80550
$-915
Cash flow
-10.1%
Cash-on-Cash Return
3.4%
Cap rate
0.5%
Rent to Value Ratio
Active
$1,125,000
6
bds
|
4
ba
|
3,848
sqft
|
built
1971
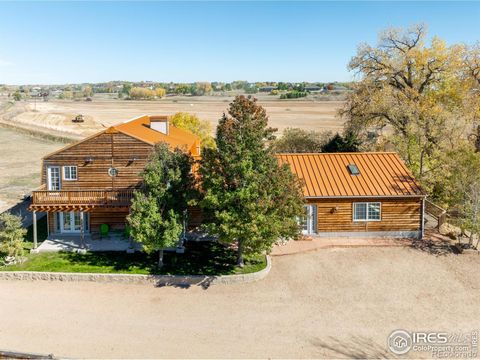
7790 County Road 72, Windsor, CO 80550
$-2,288
Cash flow
-10.6%
Cash-on-Cash Return
3.2%
Cap rate
0.4%
Rent to Value Ratio
Active
$600,000
5
bds
|
3
ba
|
3,097
sqft
|
built
2020
1384 Copeland Falls Rd, Severance, CO 80550
$-1,334
Cash flow
-11.6%
Cash-on-Cash Return
3.0%
Cap rate
0.5%
Rent to Value Ratio
Active
$555,000
2
bds
|
3
ba
|
1,906
sqft
|
built
2007
1820 E Seadrift Dr, Windsor, CO 80550
$-1,474
Cash flow
-13.9%
Cash-on-Cash Return
2.5%
Cap rate
0.5%
Rent to Value Ratio
Active
$499,000
3
bds
|
2
ba
|
1,319
sqft
|
built
2021
1766 Country Sun Dr, Windsor, CO 80550
$-918
Cash flow
-9.6%
Cash-on-Cash Return
3.5%
Cap rate
0.5%
Rent to Value Ratio
Active
$830,000
4
bds
|
3
ba
|
2,693
sqft
|
built
2004
1591 Landon Ct, Windsor, CO 80550
$-1,691
Cash flow
-10.6%
Cash-on-Cash Return
3.2%
Cap rate
0.5%
Rent to Value Ratio
Active
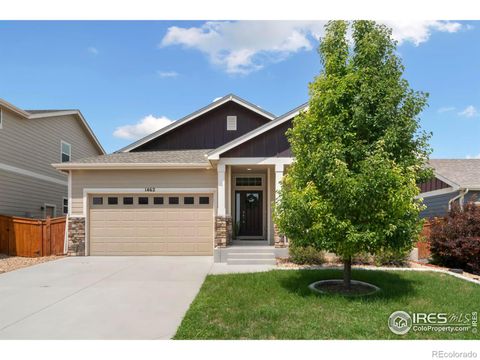
$564,900
5
bds
|
3
ba
|
3,204
sqft
|
built
2017
1462 Moraine Valley Dr, Severance, CO 80550
$-1,226
Cash flow
-11.3%
Cash-on-Cash Return
3.1%
Cap rate
0.5%
Rent to Value Ratio
Active
$810,000
4
bds
|
3
ba
|
3,450
sqft
|
built
2019
1897 Holloway Dr, Windsor, CO 80550
$-2,089
Cash flow
-13.5%
Cash-on-Cash Return
2.6%
Cap rate
0.4%
Rent to Value Ratio
Active
$745,000
4
bds
|
4
ba
|
3,561
sqft
|
built
2009
641 Denali Ct, Windsor, CO 80550
$-1,811
Cash flow
-12.7%
Cash-on-Cash Return
2.8%
Cap rate
0.4%
Rent to Value Ratio
Active
$495,000
3
bds
|
3
ba
|
1,790
sqft
|
built
2020
1781 Summer Bloom Dr, Windsor, CO 80550
$-744
Cash flow
-7.8%
Cash-on-Cash Return
3.9%
Cap rate
0.6%
Rent to Value Ratio
Active
$407,000
2
bds
|
2
ba
|
1,179
sqft
|
built
2022
1788 Iron Wheel Dr, Windsor, CO 80550
$-1,056
Cash flow
-13.5%
Cash-on-Cash Return
2.6%
Cap rate
0.5%
Rent to Value Ratio
Active
$515,000
4
bds
|
3
ba
|
2,465
sqft
|
built
2021
605 Sawyers Pond Dr, Severance, CO 80550
$-1,138
Cash flow
-11.5%
Cash-on-Cash Return
3.0%
Cap rate
0.5%
Rent to Value Ratio
Active
$489,000
4
bds
|
3
ba
|
2,242
sqft
|
built
2020
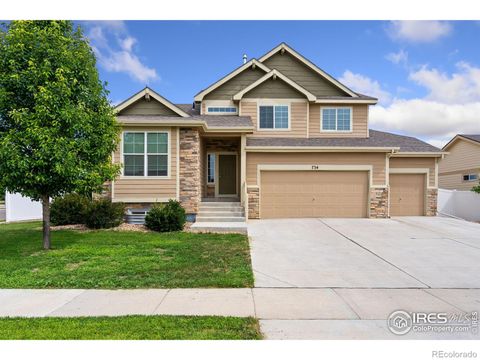
734 Takin Dr, Severance, CO 80550
$-824
Cash flow
-8.8%
Cash-on-Cash Return
3.7%
Cap rate
0.6%
Rent to Value Ratio
Active
$515,000
2
bds
|
2
ba
|
1,273
sqft
|
built
2019
244 Veronica Dr, Windsor, CO 80550
$-1,366
Cash flow
-13.8%
Cash-on-Cash Return
2.5%
Cap rate
0.4%
Rent to Value Ratio
Active
$699,900
5
bds
|
4
ba
|
3,400
sqft
|
built
2011
633 Shoshone Ct, Windsor, CO 80550
$-1,544
Cash flow
-11.5%
Cash-on-Cash Return
3.0%
Cap rate
0.5%
Rent to Value Ratio
Active
$740,000
5
bds
|
3
ba
|
3,127
sqft
|
built
2020
2057 Covered Bridge Pkwy, Windsor, CO 80550
$-1,943
Cash flow
-13.7%
Cash-on-Cash Return
2.5%
Cap rate
0.4%
Rent to Value Ratio
Active
$505,000
4
bds
|
4
ba
|
2,847
sqft
|
built
2001
128 Bayside Cir, Windsor, CO 80550
$-1,167
Cash flow
-12.1%
Cash-on-Cash Return
2.9%
Cap rate
0.6%
Rent to Value Ratio
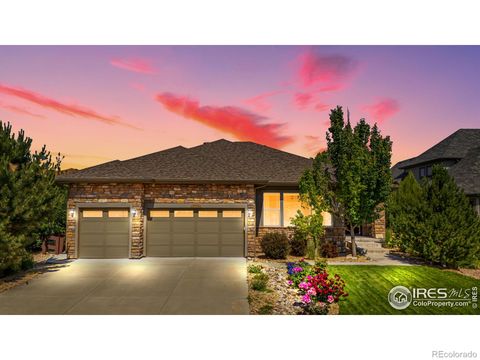
Active
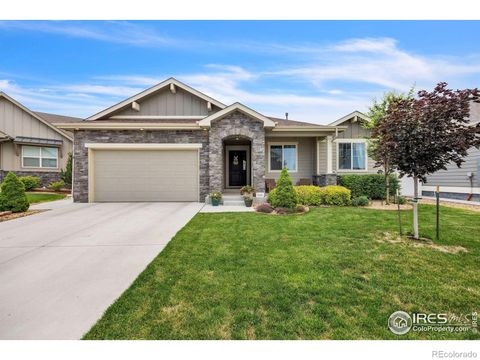
$560,000
4
bds
|
3
ba
|
1,811
sqft
|
built
2017
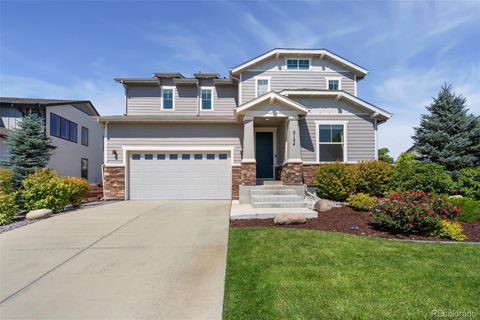
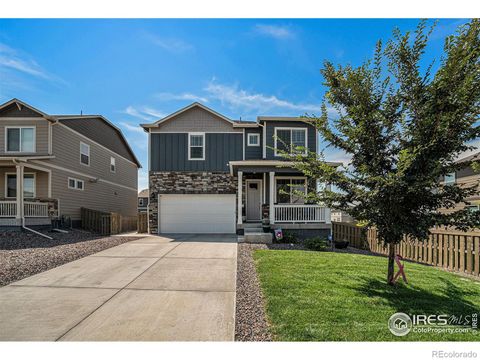
381 Mt Bross Ave, Severance, CO 80550
$-1,155
Cash flow
-10.8%
Cash-on-Cash Return
3.2%
Cap rate
0.5%
Rent to Value Ratio
Active
$975,000
6
bds
|
4
ba
|
5,327
sqft
|
built
2014
1976 Cayman Dr, Windsor, CO 80550
$-2,242
Cash flow
-12.0%
Cash-on-Cash Return
2.9%
Cap rate
0.5%
Rent to Value Ratio
Active
$499,000
4
bds
|
3
ba
|
2,439
sqft
|
built
2021
999 Cascade Falls St, Severance, CO 80550
$-861
Cash flow
-9.0%
Cash-on-Cash Return
3.6%
Cap rate
0.6%
Rent to Value Ratio
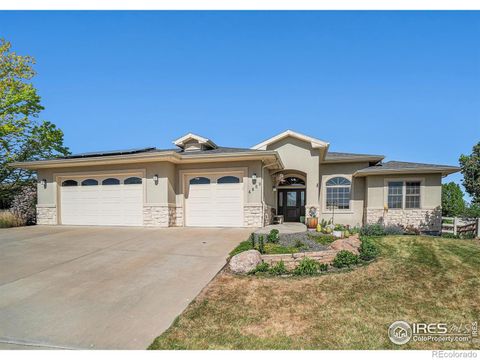
Active
$839,000
4
bds
|
3
ba
|
3,594
sqft
|
built
2009
4609 Freehold Dr, Windsor, CO 80550
$-1,897
Cash flow
-11.8%
Cash-on-Cash Return
3.0%
Cap rate
0.4%
Rent to Value Ratio