84010 Investment Properties for Sale
Browse homes for sale and investment properties in 84010. Refine your search by price, property type, or more.
Best cash flowing properties in 84010
Active
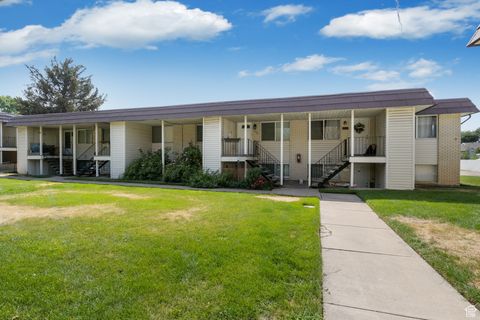
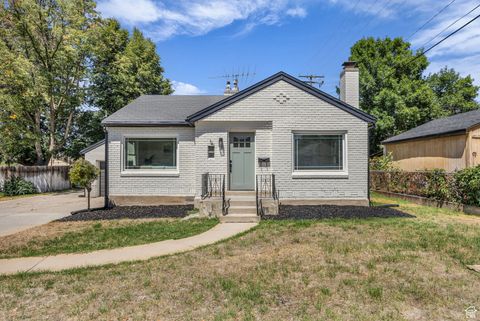
$265,000
2
bds
|
1
ba
|
925
sqft
|
built
1971
314 W Center St, Bountiful, UT 84010
$-434
Cash flow
-8.5%
Cash-on-Cash Return
3.7%
Cap rate
0.7%
Rent to Value Ratio
Active
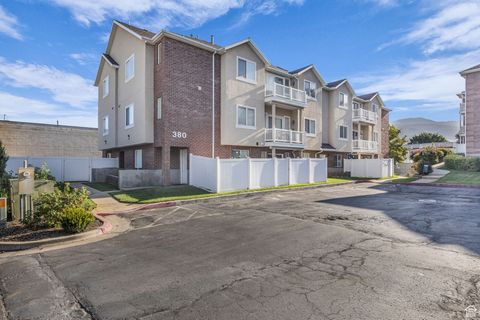
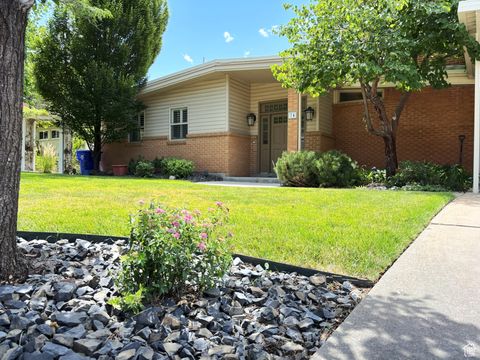
$310,000
2
bds
|
2
ba
|
1,103
sqft
|
built
2003
380 N 500 W, Bountiful, UT 84010
$-542
Cash flow
-9.1%
Cash-on-Cash Return
3.6%
Cap rate
0.6%
Rent to Value Ratio
51 out of 56 properties for sale in 84010
Limited Results Shown
Create a free account, or log in to reveal all property listings and enjoy the complete experience.
Active
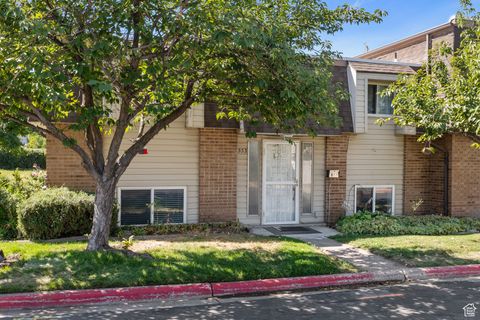
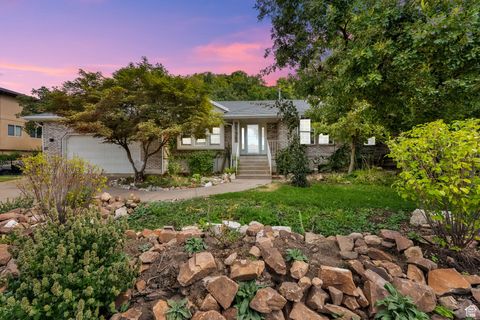
$400,000
4
bds
|
2
ba
|
1,888
sqft
|
built
1974
553 N 200 W, Bountiful, UT 84010
$-852
Cash flow
-11.1%
Cash-on-Cash Return
3.1%
Cap rate
0.6%
Rent to Value Ratio
Active
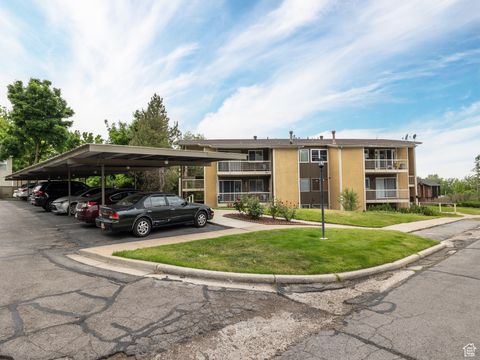
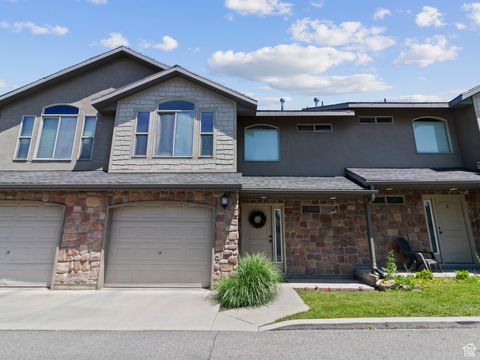
$325,000
2
bds
|
2
ba
|
1,139
sqft
|
built
1973
288 Peach Ln, Bountiful, UT 84010
$-606
Cash flow
-9.7%
Cash-on-Cash Return
3.4%
Cap rate
0.6%
Rent to Value Ratio
Active
$675,000
4
bds
|
3
ba
|
2,849
sqft
|
built
1966
1399 E Millbrook Way, Bountiful, UT 84010
$-1,747
Cash flow
-13.5%
Cash-on-Cash Return
2.6%
Cap rate
0.4%
Rent to Value Ratio
Active
$659,000
5
bds
|
4
ba
|
3,585
sqft
|
built
1994
1225 N 900 E, Bountiful, UT 84010
$-1,000
Cash flow
-7.9%
Cash-on-Cash Return
3.9%
Cap rate
0.5%
Rent to Value Ratio
Active
$435,000
3
bds
|
1
ba
|
1,070
sqft
|
built
1954
360 W 800 S, Bountiful, UT 84010
$-856
Cash flow
-10.3%
Cash-on-Cash Return
3.3%
Cap rate
0.5%
Rent to Value Ratio
Active
$667,000
4
bds
|
4
ba
|
2,728
sqft
|
built
1993
3033 S 400 E, Bountiful, UT 84010
$-1,613
Cash flow
-12.6%
Cash-on-Cash Return
2.8%
Cap rate
0.4%
Rent to Value Ratio
Active
$539,999
4
bds
|
2
ba
|
1,700
sqft
|
built
1942
16 W 700 N, Bountiful, UT 84010
$-1,511
Cash flow
-14.6%
Cash-on-Cash Return
2.3%
Cap rate
0.3%
Rent to Value Ratio
Active
$639,000
6
bds
|
2
ba
|
3,395
sqft
|
built
1974
74 Ridgeview Dr, Bountiful, UT 84010
$-1,552
Cash flow
-12.7%
Cash-on-Cash Return
2.8%
Cap rate
0.4%
Rent to Value Ratio
Active
$580,000
5
bds
|
4
ba
|
3,394
sqft
|
built
1990
2171 Bountiful Blvd, Bountiful, UT 84010
$-1,228
Cash flow
-11.0%
Cash-on-Cash Return
3.1%
Cap rate
0.4%
Rent to Value Ratio

Active
$1,300,000
5
bds
|
3
ba
|
6,656
sqft
|
built
2004
1342 Northridge Dr, Bountiful, UT 84010
$-2,336
Cash flow
-9.4%
Cash-on-Cash Return
3.5%
Cap rate
0.5%
Rent to Value Ratio
Active
$399,900
3
bds
|
3
ba
|
1,249
sqft
|
built
2010
319 W 200 N, Bountiful, UT 84010
$-969
Cash flow
-12.6%
Cash-on-Cash Return
2.8%
Cap rate
0.5%
Rent to Value Ratio
Active
$950,000
5
bds
|
5
ba
|
4,614
sqft
|
built
1978
3551 S 950 E, Bountiful, UT 84010
$-2,624
Cash flow
-14.4%
Cash-on-Cash Return
2.4%
Cap rate
0.3%
Rent to Value Ratio
Active
$825,000
4
bds
|
3
ba
|
3,512
sqft
|
built
1989
932 Northridge Dr, Bountiful, UT 84010
$-1,492
Cash flow
-9.4%
Cash-on-Cash Return
3.5%
Cap rate
0.5%
Rent to Value Ratio
Active
$860,000
4
bds
|
3
ba
|
4,008
sqft
|
built
1974
159 N Davis Blvd, Bountiful, UT 84010
$-1,930
Cash flow
-11.7%
Cash-on-Cash Return
3.0%
Cap rate
0.4%
Rent to Value Ratio
Active
$279,400
2
bds
|
1
ba
|
934
sqft
|
built
1970
1314 S 200 W, Bountiful, UT 84010
$-655
Cash flow
-12.2%
Cash-on-Cash Return
2.9%
Cap rate
0.6%
Rent to Value Ratio
Active
$800,000
5
bds
|
4
ba
|
3,390
sqft
|
built
1965
2177 Bonneview Dr, Bountiful, UT 84010
$-2,194
Cash flow
-14.3%
Cash-on-Cash Return
2.4%
Cap rate
0.4%
Rent to Value Ratio
Active
$999,000
6
bds
|
6
ba
|
4,763
sqft
|
built
2004
3975 Monarch Dr, Bountiful, UT 84010
$-2,478
Cash flow
-12.9%
Cash-on-Cash Return
2.7%
Cap rate
0.4%
Rent to Value Ratio
Active
$539,999
5
bds
|
3
ba
|
2,335
sqft
|
built
1951
662 E 1200 N, Bountiful, UT 84010
$-868
Cash flow
-8.4%
Cash-on-Cash Return
3.7%
Cap rate
0.5%
Rent to Value Ratio
Active
$564,900
4
bds
|
2
ba
|
2,678
sqft
|
built
1957
1871 S 350 E, Bountiful, UT 84010
$-1,403
Cash flow
-13.0%
Cash-on-Cash Return
2.7%
Cap rate
0.4%
Rent to Value Ratio
Active
$599,900
5
bds
|
3
ba
|
2,823
sqft
|
built
1957
3183 S 500 W, Bountiful, UT 84010
$-1,592
Cash flow
-13.8%
Cash-on-Cash Return
2.5%
Cap rate
0.4%
Rent to Value Ratio
Active
$620,000
5
bds
|
4
ba
|
2,730
sqft
|
built
2022
18 W Lady Ln, Bountiful, UT 84010
$-1,512
Cash flow
-12.7%
Cash-on-Cash Return
2.8%
Cap rate
0.4%
Rent to Value Ratio
Active
$419,000
4
bds
|
3
ba
|
1,771
sqft
|
built
1985
499 N 200 W, Bountiful, UT 84010
$-918
Cash flow
-11.4%
Cash-on-Cash Return
3.1%
Cap rate
0.5%
Rent to Value Ratio
Active
$1,030,000
5
bds
|
5
ba
|
4,708
sqft
|
built
1971
1008 E 250 S, Bountiful, UT 84010
$-3,019
Cash flow
-15.3%
Cash-on-Cash Return
2.2%
Cap rate
0.3%
Rent to Value Ratio
Active
$1,190,000
7
bds
|
5
ba
|
4,800
sqft
|
built
2022
1350 S 200 W, Bountiful, UT 84010
$-3,666
Cash flow
-16.1%
Cash-on-Cash Return
2.0%
Cap rate
0.3%
Rent to Value Ratio
Active
$495,000
3
bds
|
2
ba
|
1,812
sqft
|
built
1955
33 W Wicker Ln, Bountiful, UT 84010
$-840
Cash flow
-8.9%
Cash-on-Cash Return
3.6%
Cap rate
0.5%
Rent to Value Ratio
Active
$399,900
2
bds
|
3
ba
|
1,200
sqft
|
built
2001
1680 Aliwood Way, Bountiful, UT 84010
$-949
Cash flow
-12.4%
Cash-on-Cash Return
2.8%
Cap rate
0.5%
Rent to Value Ratio
Active
$1,445,000
7
bds
|
4
ba
|
5,353
sqft
|
built
1995
144 Bountiful Blvd, Bountiful, UT 84010
$-4,689
Cash flow
-16.9%
Cash-on-Cash Return
1.8%
Cap rate
0.2%
Rent to Value Ratio
Active
$550,000
5
bds
|
2
ba
|
2,072
sqft
|
built
1956
167 S 425 W, Bountiful, UT 84010
$-1,092
Cash flow
-10.4%
Cash-on-Cash Return
3.3%
Cap rate
0.5%
Rent to Value Ratio
Active
$428,000
3
bds
|
3
ba
|
1,640
sqft
|
built
2020
620 N Orchard Dr, North Salt Lake, UT 84010
$-809
Cash flow
-9.9%
Cash-on-Cash Return
3.4%
Cap rate
0.5%
Rent to Value Ratio
Active
$898,000
6
bds
|
3
ba
|
4,742
sqft
|
built
2003
1044 Terrace Dr, Bountiful, UT 84010
$-3,130
Cash flow
-18.2%
Cash-on-Cash Return
1.5%
Cap rate
0.3%
Rent to Value Ratio
Active
$750,000
5
bds
|
3
ba
|
2,732
sqft
|
built
1975
534 E 1400 S, Bountiful, UT 84010
$-1,665
Cash flow
-11.6%
Cash-on-Cash Return
3.0%
Cap rate
0.4%
Rent to Value Ratio
Active
$360,000
3
bds
|
3
ba
|
1,497
sqft
|
built
1983
527 Applewood Dr, Bountiful, UT 84010
$-986
Cash flow
-14.3%
Cash-on-Cash Return
2.4%
Cap rate
0.5%
Rent to Value Ratio
Active
$305,500
2
bds
|
2
ba
|
1,011
sqft
|
built
1987
650 S Main St, Bountiful, UT 84010
$-707
Cash flow
-12.1%
Cash-on-Cash Return
2.9%
Cap rate
0.6%
Rent to Value Ratio
Active
$2,000,000
4
bds
|
5
ba
|
6,741
sqft
|
built
1996
2679 Wood Hollow Way, Bountiful, UT 84010
$-5,393
Cash flow
-14.1%
Cash-on-Cash Return
2.4%
Cap rate
0.4%
Rent to Value Ratio
Active
$1,075,000
6
bds
|
4
ba
|
5,970
sqft
|
built
1966
861 E Millbrook Way, Bountiful, UT 84010
$-2,040
Cash flow
-9.9%
Cash-on-Cash Return
3.4%
Cap rate
0.5%
Rent to Value Ratio
Active
$968,000
6
bds
|
4
ba
|
4,308
sqft
|
built
1994
3551 Huntington Dr, Bountiful, UT 84010
$-2,225
Cash flow
-12.0%
Cash-on-Cash Return
2.9%
Cap rate
0.4%
Rent to Value Ratio
Active
$638,000
5
bds
|
4
ba
|
2,724
sqft
|
built
1996
1536 N 150 W, Bountiful, UT 84010
$-1,275
Cash flow
-10.4%
Cash-on-Cash Return
3.3%
Cap rate
0.5%
Rent to Value Ratio
Active
$2,850,000
6
bds
|
6
ba
|
9,857
sqft
|
built
2008
1596 E Millbrook Way, Bountiful, UT 84010
$-11,508
Cash flow
-21.1%
Cash-on-Cash Return
0.8%
Cap rate
0.1%
Rent to Value Ratio