84105 Investment Properties for Sale
Browse homes for sale and investment properties in 84105. Refine your search by price, property type, or more.
Best cash flowing properties in 84105
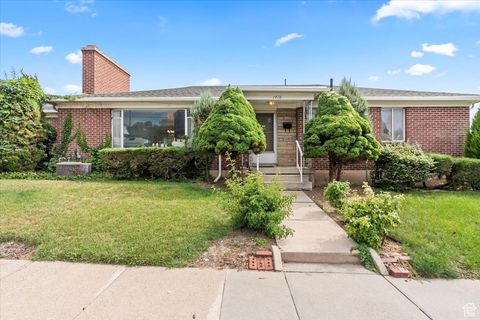
Active
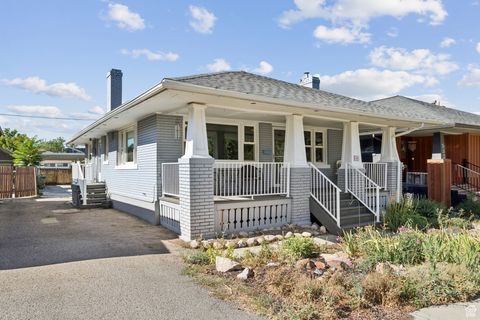
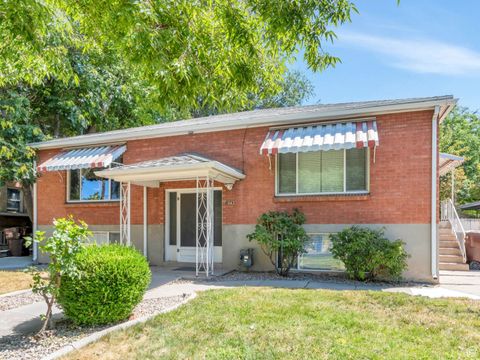
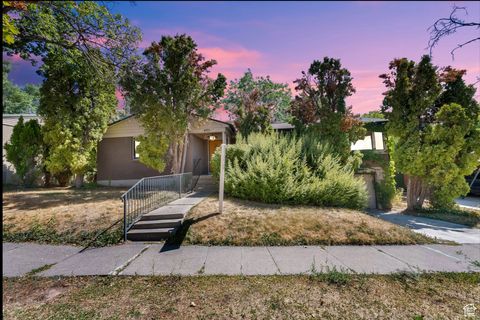
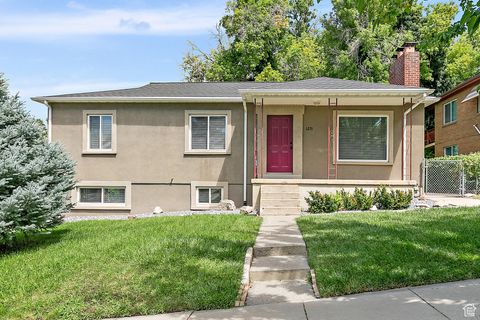
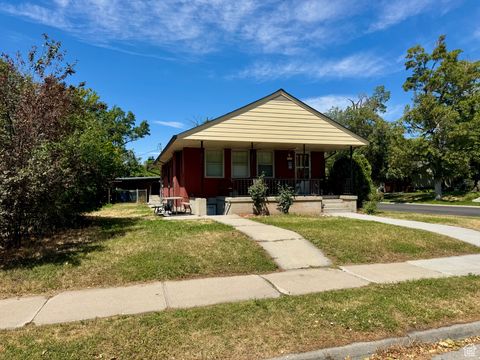
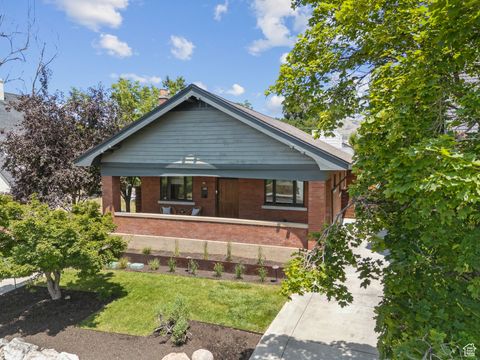
$559,000
3
bds
|
1
ba
|
1,560
sqft
|
built
1915
536 E Hollywood Ave, Salt Lake City, UT 84105
$-1,073
Cash flow
-10.0%
Cash-on-Cash Return
3.4%
Cap rate
0.5%
Rent to Value Ratio
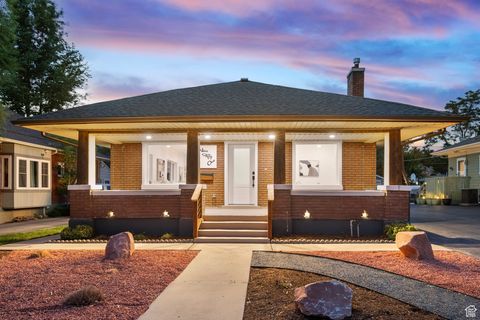
Active
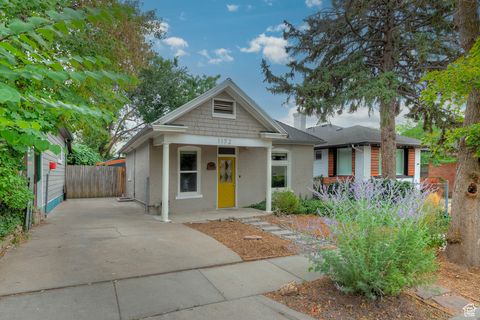
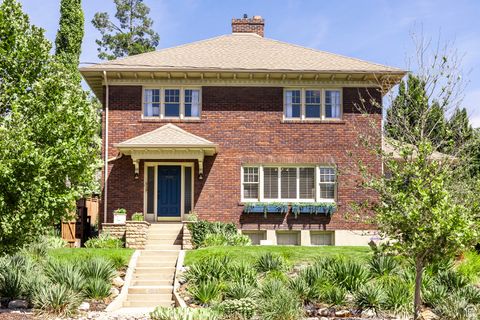
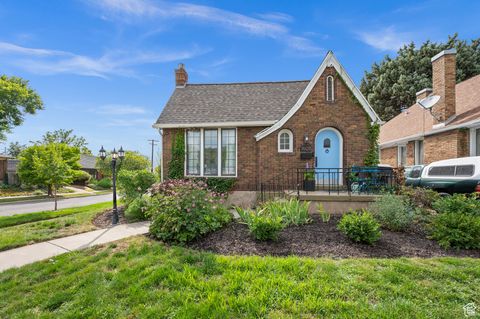
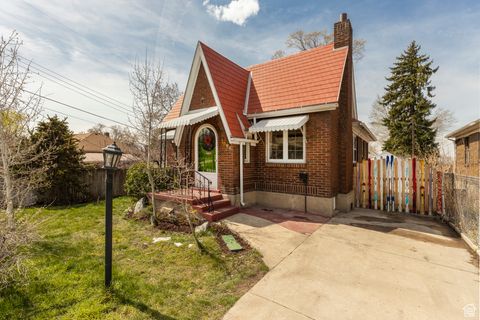
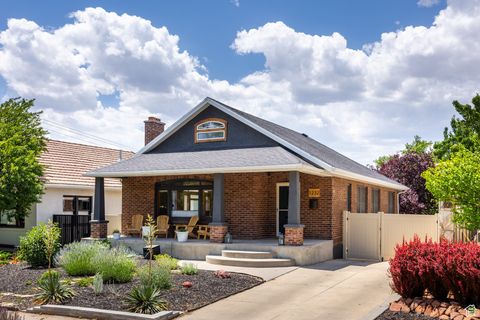
$550,000
2
bds
|
1
ba
|
1,312
sqft
|
built
1902
1172 E Bryan Ave, Salt Lake City, UT 84105
$-1,106
Cash flow
-10.5%
Cash-on-Cash Return
3.3%
Cap rate
0.5%
Rent to Value Ratio
59 out of 66 properties for sale in 84105
Limited Results Shown
Create a free account, or log in to reveal all property listings and enjoy the complete experience.
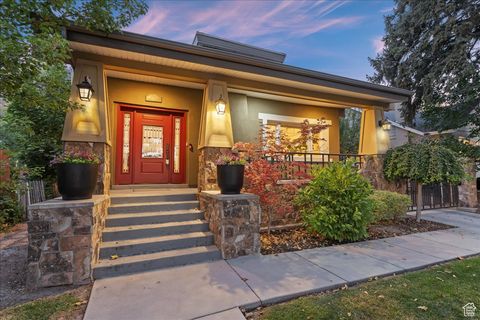
Active
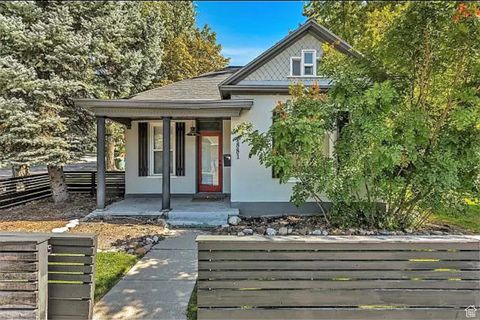
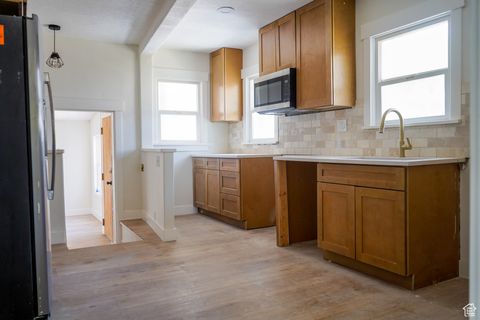
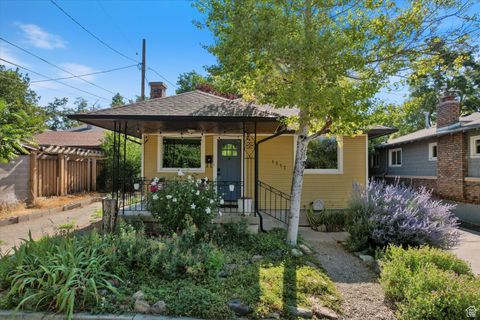
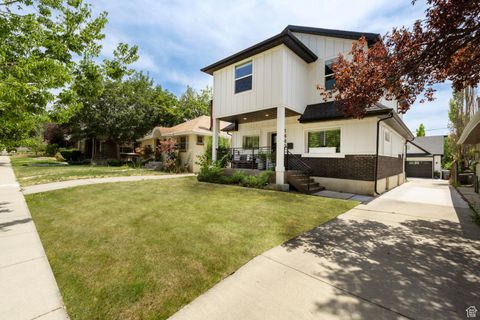
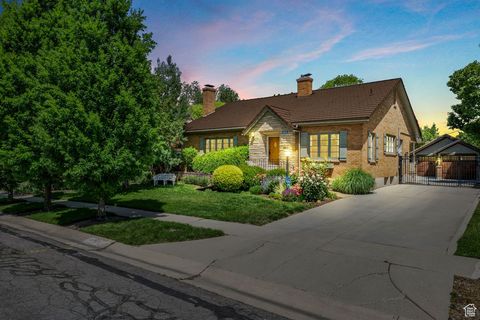
$650,000
4
bds
|
4
ba
|
1,551
sqft
|
built
1902
1881 S 1100 E, Salt Lake City, UT 84105
$-1,797
Cash flow
-14.4%
Cash-on-Cash Return
2.4%
Cap rate
0.3%
Rent to Value Ratio
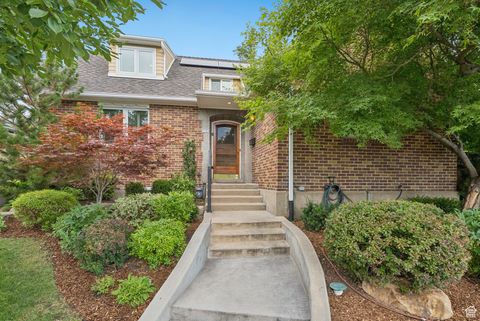
Active
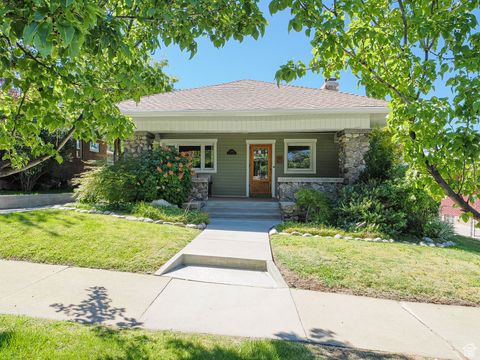
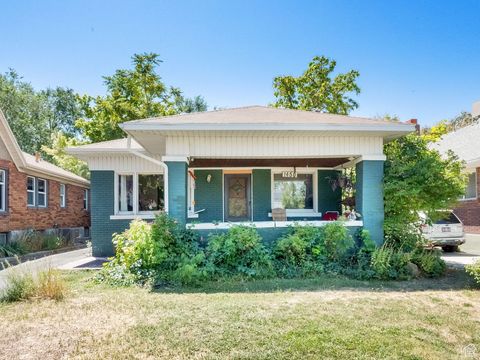
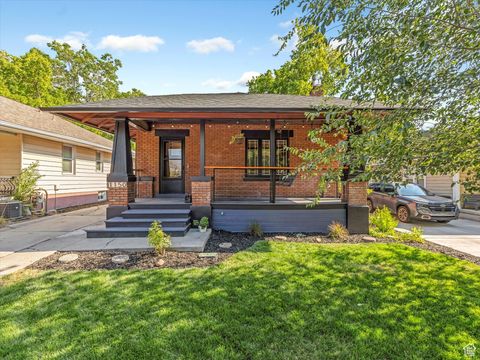
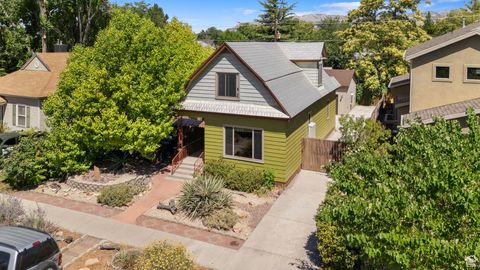
$870,000
4
bds
|
2
ba
|
2,103
sqft
|
built
1918
1336 E Roosevelt Ave, Salt Lake City, UT 84105
$-1,694
Cash flow
-10.2%
Cash-on-Cash Return
3.3%
Cap rate
0.5%
Rent to Value Ratio
Active
$1,125,000
5
bds
|
3
ba
|
2,677
sqft
|
built
1927
1791 S 1600 E, Salt Lake City, UT 84105
$-1,920
Cash flow
-8.9%
Cash-on-Cash Return
3.6%
Cap rate
0.5%
Rent to Value Ratio
Active
$1,765,000
5
bds
|
4
ba
|
3,321
sqft
|
built
1924
1005 S 1500 E, Salt Lake City, UT 84105
$-6,421
Cash flow
-19.0%
Cash-on-Cash Return
1.3%
Cap rate
0.2%
Rent to Value Ratio

Active
$1,095,000
3
bds
|
3
ba
|
2,150
sqft
|
built
1920
1123 E Roosevelt Ave, Salt Lake City, UT 84105
$-3,346
Cash flow
-15.9%
Cash-on-Cash Return
2.0%
Cap rate
0.3%
Rent to Value Ratio
Active
$1,300,000
7
bds
|
4
ba
|
5,120
sqft
|
built
1951
1478 E Roosevelt Ave, Salt Lake City, UT 84105
$-4,405
Cash flow
-17.7%
Cash-on-Cash Return
1.6%
Cap rate
0.2%
Rent to Value Ratio
Active
$1,035,000
3
bds
|
3
ba
|
2,128
sqft
|
built
1922
951 E Wilson Ave, Salt Lake City, UT 84105
$-3,759
Cash flow
-18.9%
Cash-on-Cash Return
1.3%
Cap rate
0.2%
Rent to Value Ratio
Active
$1,250,000
5
bds
|
4
ba
|
3,601
sqft
|
built
1953
1843 S 900 E, Salt Lake City, UT 84105
$-4,217
Cash flow
-17.6%
Cash-on-Cash Return
1.6%
Cap rate
0.2%
Rent to Value Ratio
Active
$1,200,000
5
bds
|
3
ba
|
3,195
sqft
|
built
1923
1013 S 1300 E, Salt Lake City, UT 84105
$-3,237
Cash flow
-14.1%
Cash-on-Cash Return
2.4%
Cap rate
0.3%
Rent to Value Ratio
Active
$1,150,000
5
bds
|
3
ba
|
3,080
sqft
|
built
1928
1216 S 1100 E, Salt Lake City, UT 84105
$-2,994
Cash flow
-13.6%
Cash-on-Cash Return
2.6%
Cap rate
0.3%
Rent to Value Ratio
Active
$550,000
3
bds
|
1
ba
|
1,440
sqft
|
built
1935
1450 E 1700 S, Salt Lake City, UT 84105
$-1,444
Cash flow
-13.7%
Cash-on-Cash Return
2.5%
Cap rate
0.4%
Rent to Value Ratio
Active
$825,000
4
bds
|
3
ba
|
2,724
sqft
|
built
1955
1334 E Downington Ave, Salt Lake City, UT 84105
$-2,262
Cash flow
-14.3%
Cash-on-Cash Return
2.4%
Cap rate
0.3%
Rent to Value Ratio
Active
$765,000
3
bds
|
2
ba
|
1,850
sqft
|
built
1926
1608 S 1500 E, Salt Lake City, UT 84105
$-1,768
Cash flow
-12.1%
Cash-on-Cash Return
2.9%
Cap rate
0.4%
Rent to Value Ratio
Active
$575,000
3
bds
|
1
ba
|
1,202
sqft
|
built
1923
1217 S Lyman Ct, Salt Lake City, UT 84105
$-1,193
Cash flow
-10.8%
Cash-on-Cash Return
3.2%
Cap rate
0.4%
Rent to Value Ratio
Active
$675,000
2
bds
|
1
ba
|
1,522
sqft
|
built
1914
1150 E 1700 S, Salt Lake City, UT 84105
$-1,614
Cash flow
-12.5%
Cash-on-Cash Return
2.8%
Cap rate
0.4%
Rent to Value Ratio
Active
$750,000
4
bds
|
2
ba
|
2,060
sqft
|
built
1953
1251 E Roosevelt Ave, Salt Lake City, UT 84105
$-2,418
Cash flow
-16.8%
Cash-on-Cash Return
1.8%
Cap rate
0.3%
Rent to Value Ratio
Active
$649,000
3
bds
|
2
ba
|
1,888
sqft
|
built
1929
1596 S 1300 E, Salt Lake City, UT 84105
$-1,340
Cash flow
-10.8%
Cash-on-Cash Return
3.2%
Cap rate
0.4%
Rent to Value Ratio
Active
$1,600,000
4
bds
|
4
ba
|
2,855
sqft
|
built
1922
1440 E Bryan Ave, Salt Lake City, UT 84105
$-4,344
Cash flow
-14.2%
Cash-on-Cash Return
2.4%
Cap rate
0.3%
Rent to Value Ratio
Active
$770,000
3
bds
|
2
ba
|
1,952
sqft
|
built
1920
1133 E Milton Ave, Salt Lake City, UT 84105
$-1,708
Cash flow
-11.6%
Cash-on-Cash Return
3.0%
Cap rate
0.4%
Rent to Value Ratio
Active
$849,900
4
bds
|
2
ba
|
1,975
sqft
|
built
1916
1860 S 1600 E, Salt Lake City, UT 84105
$-3,105
Cash flow
-19.1%
Cash-on-Cash Return
1.3%
Cap rate
0.2%
Rent to Value Ratio
Active
$819,000
4
bds
|
2
ba
|
1,920
sqft
|
built
1950
1479 S 600 E, Salt Lake City, UT 84105
$-2,129
Cash flow
-13.6%
Cash-on-Cash Return
2.6%
Cap rate
0.4%
Rent to Value Ratio
Active
$1,200,000
5
bds
|
3
ba
|
2,617
sqft
|
built
1926
1319 E 1300 S, Salt Lake City, UT 84105
$-3,555
Cash flow
-15.5%
Cash-on-Cash Return
2.1%
Cap rate
0.3%
Rent to Value Ratio
Active
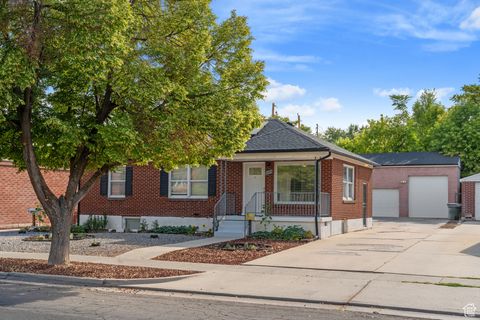
$629,900
3
bds
|
2
ba
|
1,515
sqft
|
built
1924
641 E Downington Ave, Salt Lake City, UT 84105
$-1,367
Cash flow
-11.3%
Cash-on-Cash Return
3.1%
Cap rate
0.4%
Rent to Value Ratio
Active
$799,000
3
bds
|
3
ba
|
2,154
sqft
|
built
1905
1330 S 1100 E, Salt Lake City, UT 84105
$-1,806
Cash flow
-11.8%
Cash-on-Cash Return
3.0%
Cap rate
0.4%
Rent to Value Ratio
Active
$1,890,000
4
bds
|
3
ba
|
3,216
sqft
|
built
1924
1120 E Gilmer Dr, Salt Lake City, UT 84105
$-6,887
Cash flow
-19.0%
Cash-on-Cash Return
1.3%
Cap rate
0.2%
Rent to Value Ratio
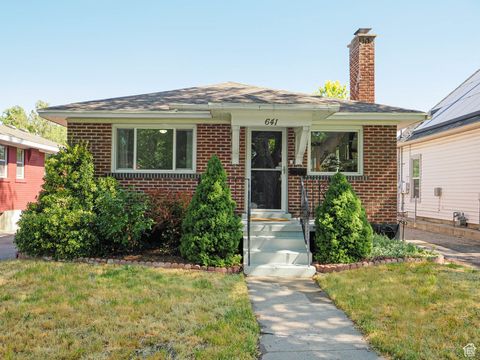
Active
$574,900
4
bds
|
3
ba
|
1,572
sqft
|
built
1945
1397 S 1300 E, Salt Lake City, UT 84105
$-2,032
Cash flow
-18.4%
Cash-on-Cash Return
1.4%
Cap rate
0.3%
Rent to Value Ratio
Active
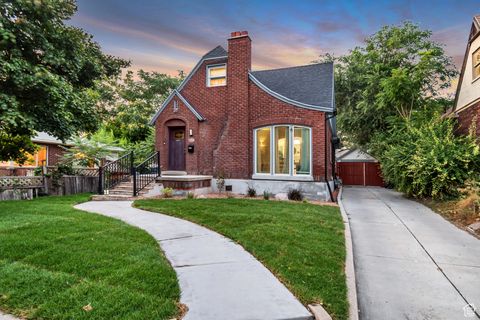
$949,900
3
bds
|
3
ba
|
2,526
sqft
|
built
1926
1381 E 1300 S, Salt Lake City, UT 84105
$-2,137
Cash flow
-11.7%
Cash-on-Cash Return
3.0%
Cap rate
0.4%
Rent to Value Ratio
Active
$949,900
4
bds
|
2
ba
|
2,224
sqft
|
built
1939
847 S Greenwood Ter, Salt Lake City, UT 84105
$-1,754
Cash flow
-9.6%
Cash-on-Cash Return
3.5%
Cap rate
0.5%
Rent to Value Ratio
Active
$1,567,000
4
bds
|
4
ba
|
3,582
sqft
|
built
1921
1120 E Yale Ave, Salt Lake City, UT 84105
$-4,773
Cash flow
-15.9%
Cash-on-Cash Return
2.0%
Cap rate
0.3%
Rent to Value Ratio
Active
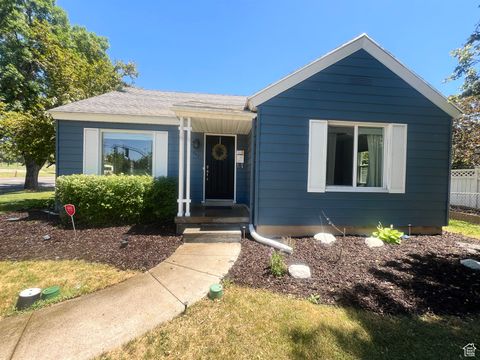
$565,000
2
bds
|
2
ba
|
1,591
sqft
|
built
1919
544 E Ramona Ave, Salt Lake City, UT 84105
$-1,427
Cash flow
-13.2%
Cash-on-Cash Return
2.6%
Cap rate
0.4%
Rent to Value Ratio
Active
$734,900
4
bds
|
2
ba
|
2,597
sqft
|
built
1892
1145 E Kensington Ave, Salt Lake City, UT 84105
$-1,622
Cash flow
-11.5%
Cash-on-Cash Return
3.0%
Cap rate
0.4%
Rent to Value Ratio
Active
$999,000
4
bds
|
3
ba
|
2,396
sqft
|
built
1936
1639 E 900 S, Salt Lake City, UT 84105
$-2,658
Cash flow
-13.9%
Cash-on-Cash Return
2.5%
Cap rate
0.4%
Rent to Value Ratio
Active
$699,900
3
bds
|
2
ba
|
1,427
sqft
|
built
1906
1804 S Park St, Salt Lake City, UT 84105
$-2,115
Cash flow
-15.8%
Cash-on-Cash Return
2.1%
Cap rate
0.3%
Rent to Value Ratio
Active
$894,000
3
bds
|
3
ba
|
2,302
sqft
|
built
1908
1190 S 800 E, Salt Lake City, UT 84105
$-1,811
Cash flow
-10.6%
Cash-on-Cash Return
3.2%
Cap rate
0.4%
Rent to Value Ratio
Active
$925,000
3
bds
|
3
ba
|
2,030
sqft
|
built
1938
1662 E Browning Ave, Salt Lake City, UT 84105
$-2,448
Cash flow
-13.8%
Cash-on-Cash Return
2.5%
Cap rate
0.3%
Rent to Value Ratio
Active
$1,685,000
3
bds
|
4
ba
|
4,901
sqft
|
built
1914
1433 E 900 S, Salt Lake City, UT 84105
$-5,059
Cash flow
-15.7%
Cash-on-Cash Return
2.1%
Cap rate
0.3%
Rent to Value Ratio
Active
$920,000
4
bds
|
2
ba
|
2,610
sqft
|
built
1925
1232 S 1500 E, Salt Lake City, UT 84105
$-1,925
Cash flow
-10.9%
Cash-on-Cash Return
3.2%
Cap rate
0.4%
Rent to Value Ratio
Active
$1,250,000
4
bds
|
3
ba
|
3,732
sqft
|
built
1952
1377 E Wilson Ave, Salt Lake City, UT 84105
$-2,532
Cash flow
-10.6%
Cash-on-Cash Return
3.2%
Cap rate
0.4%
Rent to Value Ratio