84319 Investment Properties for Sale
Browse homes for sale and investment properties in 84319. Refine your search by price, property type, or more.
Best cash flowing properties in 84319
Active
$324,900
3
bds
|
3
ba
|
1,798
sqft
|
built
2018
275 W 70 N, Hyrum, UT 84319
$-381
Cash flow
-6.1%
Cash-on-Cash Return
4.3%
Cap rate
0.6%
Rent to Value Ratio
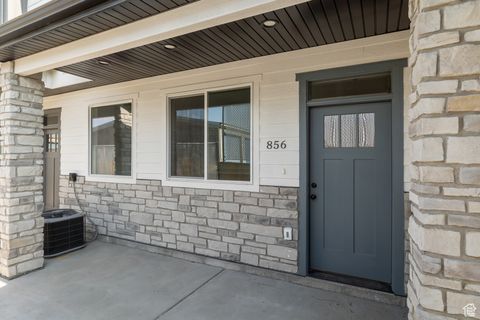
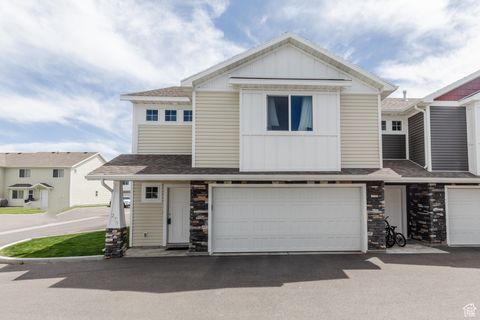
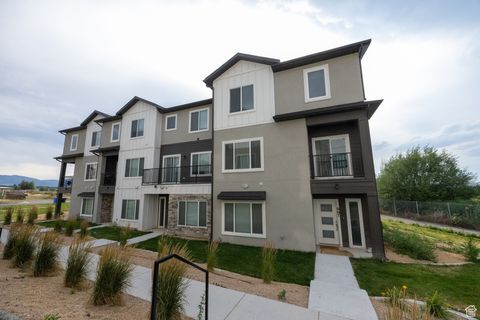
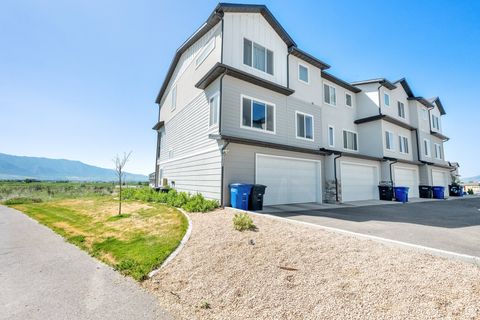
Active
$329,900
3
bds
|
3
ba
|
1,445
sqft
|
built
2023
856 E 250 N, Hyrum, UT 84319
$-397
Cash flow
-6.3%
Cash-on-Cash Return
4.2%
Cap rate
0.6%
Rent to Value Ratio
17 out of 17 properties for sale in 84319
Limited Results Shown
Create a free account, or log in to reveal all property listings and enjoy the complete experience.
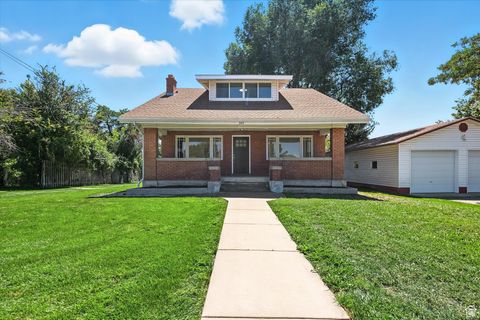
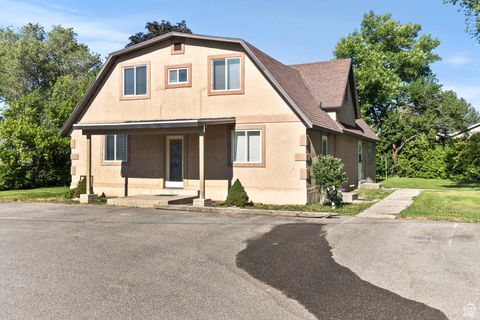
Active
$649,900
5
bds
|
2
ba
|
3,370
sqft
|
built
1919
325 W 300 N, Hyrum, UT 84319
$-1,876
Cash flow
-15.1%
Cash-on-Cash Return
2.2%
Cap rate
0.3%
Rent to Value Ratio
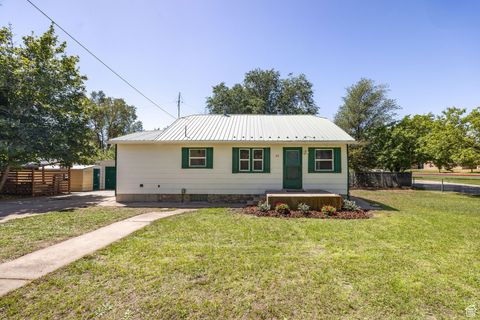
Active
$410,000
3
bds
|
1
ba
|
2,008
sqft
|
built
1942
14 S 400 W, Hyrum, UT 84319
$-687
Cash flow
-8.7%
Cash-on-Cash Return
3.7%
Cap rate
0.5%
Rent to Value Ratio
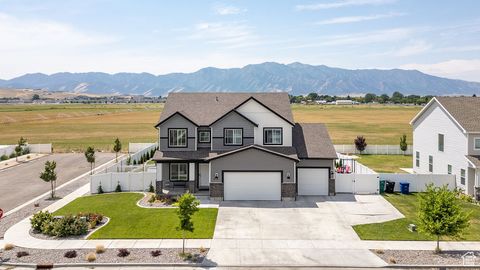
Active
$520,000
4
bds
|
3
ba
|
2,393
sqft
|
built
2018
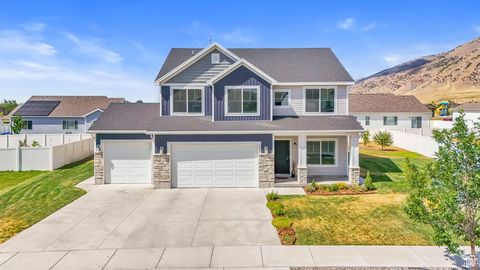
1345 E 340 S, Hyrum, UT 84319
$-1,167
Cash flow
-11.7%
Cash-on-Cash Return
3.0%
Cap rate
0.4%
Rent to Value Ratio
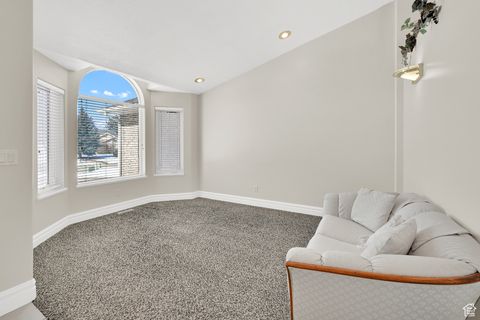
Active
$499,999
3
bds
|
2
ba
|
2,810
sqft
|
built
2019
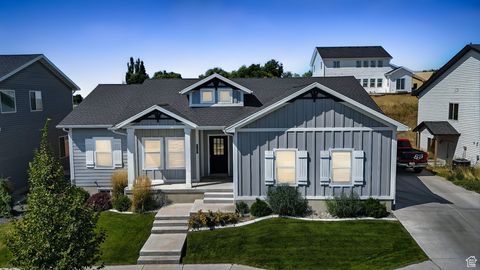
798 W 50 N, Hyrum, UT 84319
$-831
Cash flow
-8.7%
Cash-on-Cash Return
3.7%
Cap rate
0.5%
Rent to Value Ratio
Active
$780,000
5
bds
|
5
ba
|
4,550
sqft
|
built
2007
177 S 1170 E, Hyrum, UT 84319
$-1,967
Cash flow
-13.2%
Cash-on-Cash Return
2.7%
Cap rate
0.4%
Rent to Value Ratio
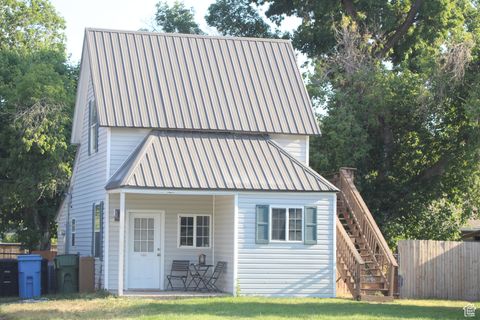
Active
$314,900
2
bds
|
1
ba
|
971
sqft
|
built
1909
279 W 300 N, Hyrum, UT 84319
$-482
Cash flow
-8.0%
Cash-on-Cash Return
3.8%
Cap rate
0.5%
Rent to Value Ratio
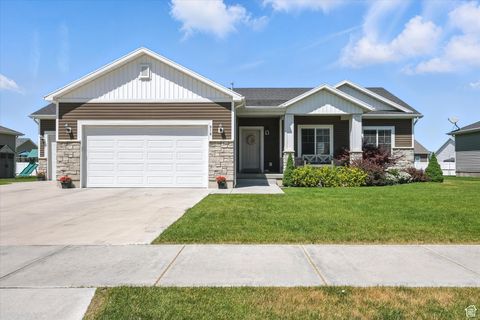
Active
$384,900
4
bds
|
4
ba
|
2,366
sqft
|
built
2022
667 E 730 N, Hyrum, UT 84319
$-598
Cash flow
-8.1%
Cash-on-Cash Return
3.8%
Cap rate
0.6%
Rent to Value Ratio
Active
$679,900
5
bds
|
4
ba
|
3,811
sqft
|
built
2020
412 S 1170 E, Hyrum, UT 84319
$-1,955
Cash flow
-15.0%
Cash-on-Cash Return
2.2%
Cap rate
0.3%
Rent to Value Ratio
Active
$599,900
5
bds
|
3
ba
|
3,018
sqft
|
built
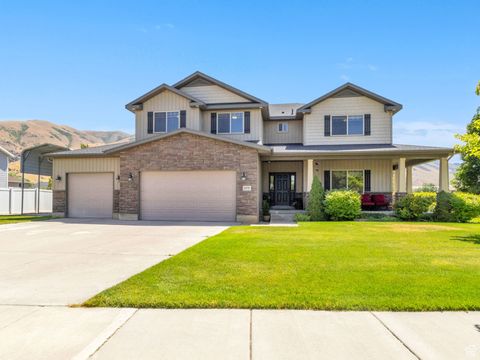
2018
516 S 770 E, Hyrum, UT 84319
$-1,349
Cash flow
-11.7%
Cash-on-Cash Return
3.0%
Cap rate
0.4%
Rent to Value Ratio
Active
$535,000
4
bds
|
3
ba
|
2,670
sqft
|
built
1966
572 W 300 N, Hyrum, UT 84319
$-1,113
Cash flow
-10.9%
Cash-on-Cash Return
3.2%
Cap rate
0.4%
Rent to Value Ratio
Active
$384,000
4
bds
|
4
ba
|
2,492
sqft
|
built
2022
672 E 730 N, Hyrum, UT 84319
$-580
Cash flow
-7.9%
Cash-on-Cash Return
3.9%
Cap rate
0.5%
Rent to Value Ratio
Active
$460,000
5
bds
|
5
ba
|
3,545
sqft
|
built
1903
165 N 800 E, Hyrum, UT 84319
$-633
Cash flow
-7.2%
Cash-on-Cash Return
4.0%
Cap rate
0.5%
Rent to Value Ratio
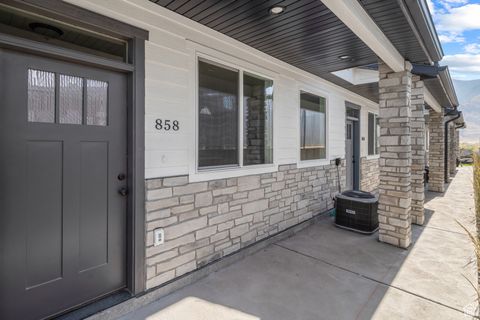
Active
$329,900
3
bds
|
3
ba
|
1,445
sqft
|
built
2023
858 E 250 N, Hyrum, UT 84319
$-397
Cash flow
-6.3%
Cash-on-Cash Return
4.2%
Cap rate
0.6%
Rent to Value Ratio
Active
$575,000
4
bds
|
3
ba
|
3,295
sqft
|
built
2000
338 N 1090 W, Hyrum, UT 84319
$-1,382
Cash flow
-12.5%
Cash-on-Cash Return
2.8%
Cap rate
0.4%
Rent to Value Ratio
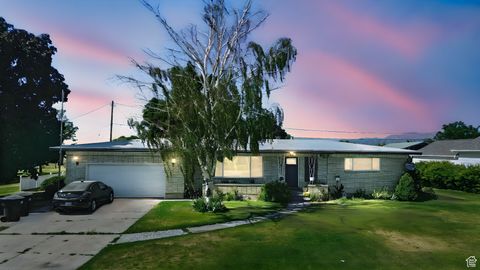
Active
$380,000
4
bds
|
1
ba
|
1,510
sqft
|
built
1926
6 N 400 W, Hyrum, UT 84319
$-642
Cash flow
-8.8%
Cash-on-Cash Return
3.7%
Cap rate
0.5%
Rent to Value Ratio