85007 Investment Properties for Sale
Browse homes for sale and investment properties in 85007. Refine your search by price, property type, or more.
Best cash flowing properties in 85007
Active
$273,900
bds
|
0
ba
|
0
sqft
|
built
1946
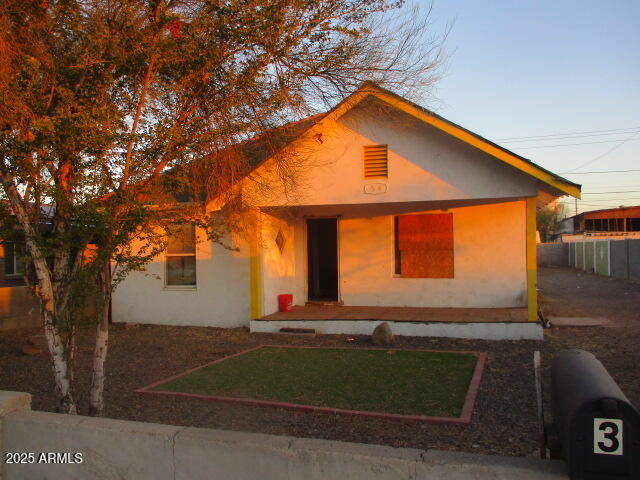
1514 W Sherman St, Phoenix, AZ 85007
$-370
Cash flow
-7.0%
Cash-on-Cash Return
4.7%
Cap rate
0.6%
Rent to Value Ratio
Active
$315,000
1
bds
|
1
ba
|
719
sqft
|
built
1926
809 N 11th Ave, Phoenix, AZ 85007
$-524
Cash flow
-8.7%
Cash-on-Cash Return
4.3%
Cap rate
0.6%
Rent to Value Ratio
48 out of 53 properties for sale in 85007
Limited Results Shown
Create a free account, or log in to reveal all property listings and enjoy the complete experience.

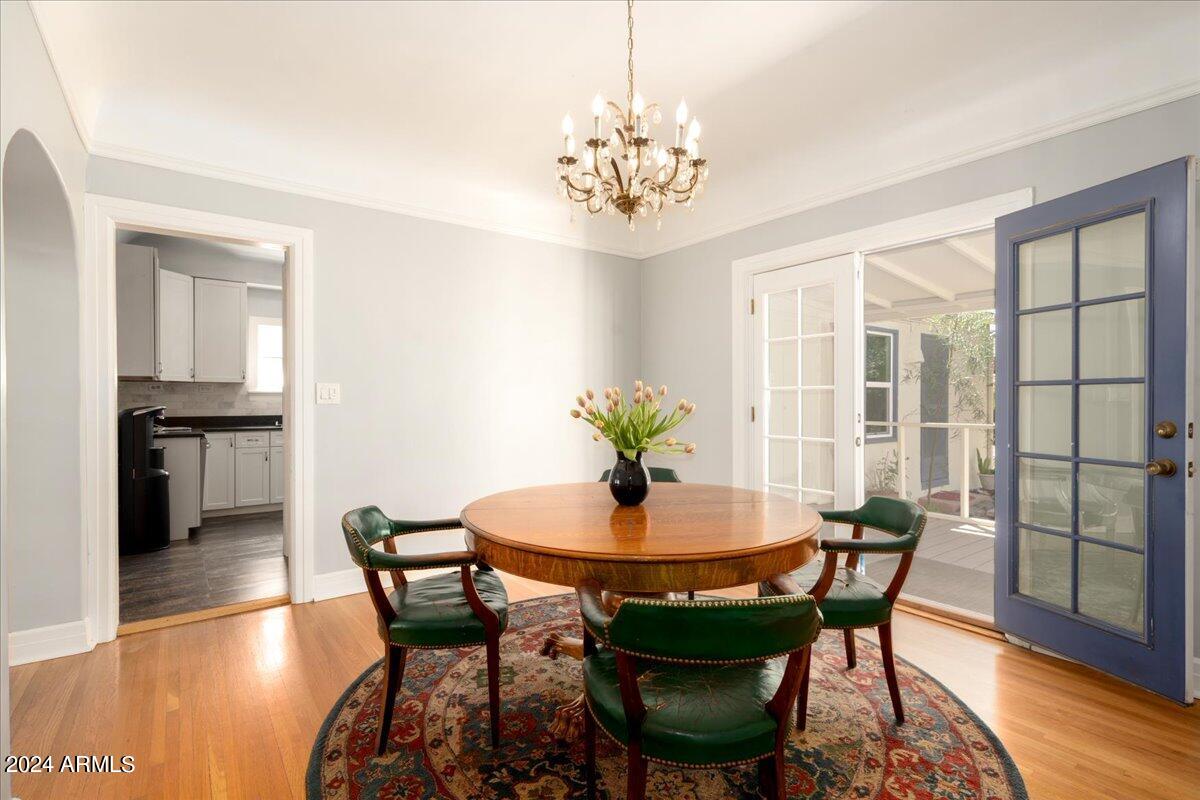
Active
$849,000
3
bds
|
2
ba
|
1,569
sqft
|
built
1938
1551 W Vernon Ave, Phoenix, AZ 85007
$-3,024
Cash flow
-18.6%
Cash-on-Cash Return
2.0%
Cap rate
0.3%
Rent to Value Ratio
Active
$899,900
3
bds
|
3
ba
|
2,087
sqft
|
built
1933
725 W Portland St, Phoenix, AZ 85007
$-2,466
Cash flow
-14.3%
Cash-on-Cash Return
3.0%
Cap rate
0.4%
Rent to Value Ratio

Active
$469,800
2
bds
|
1
ba
|
1,090
sqft
|
built
1930
1134 W Portland St, Phoenix, AZ 85007
$-1,066
Cash flow
-11.8%
Cash-on-Cash Return
3.6%
Cap rate
0.5%
Rent to Value Ratio
Active
$330,000
3
bds
|
2
ba
|
1,352
sqft
|
built
1971
937 W Cocopah St, Phoenix, AZ 85007
$-585
Cash flow
-9.2%
Cash-on-Cash Return
4.2%
Cap rate
0.5%
Rent to Value Ratio
Active
$1,265,000
4
bds
|
2
ba
|
2,184
sqft
|
built
1951
712 W Vernon Ave, Phoenix, AZ 85007
$-4,423
Cash flow
-18.2%
Cash-on-Cash Return
2.1%
Cap rate
0.3%
Rent to Value Ratio
Active
$825,000
3
bds
|
3
ba
|
2,100
sqft
|
built
2023
1533 W Culver St, Phoenix, AZ 85007
$-3,365
Cash flow
-21.3%
Cash-on-Cash Return
1.4%
Cap rate
0.2%
Rent to Value Ratio
Active
$420,000
4
bds
|
2
ba
|
1,413
sqft
|
built
1925
1505 W Pierce St, Phoenix, AZ 85007
$-889
Cash flow
-11.0%
Cash-on-Cash Return
3.8%
Cap rate
0.5%
Rent to Value Ratio

Active
$1,800,000
4
bds
|
3
ba
|
4,142
sqft
|
built
1931
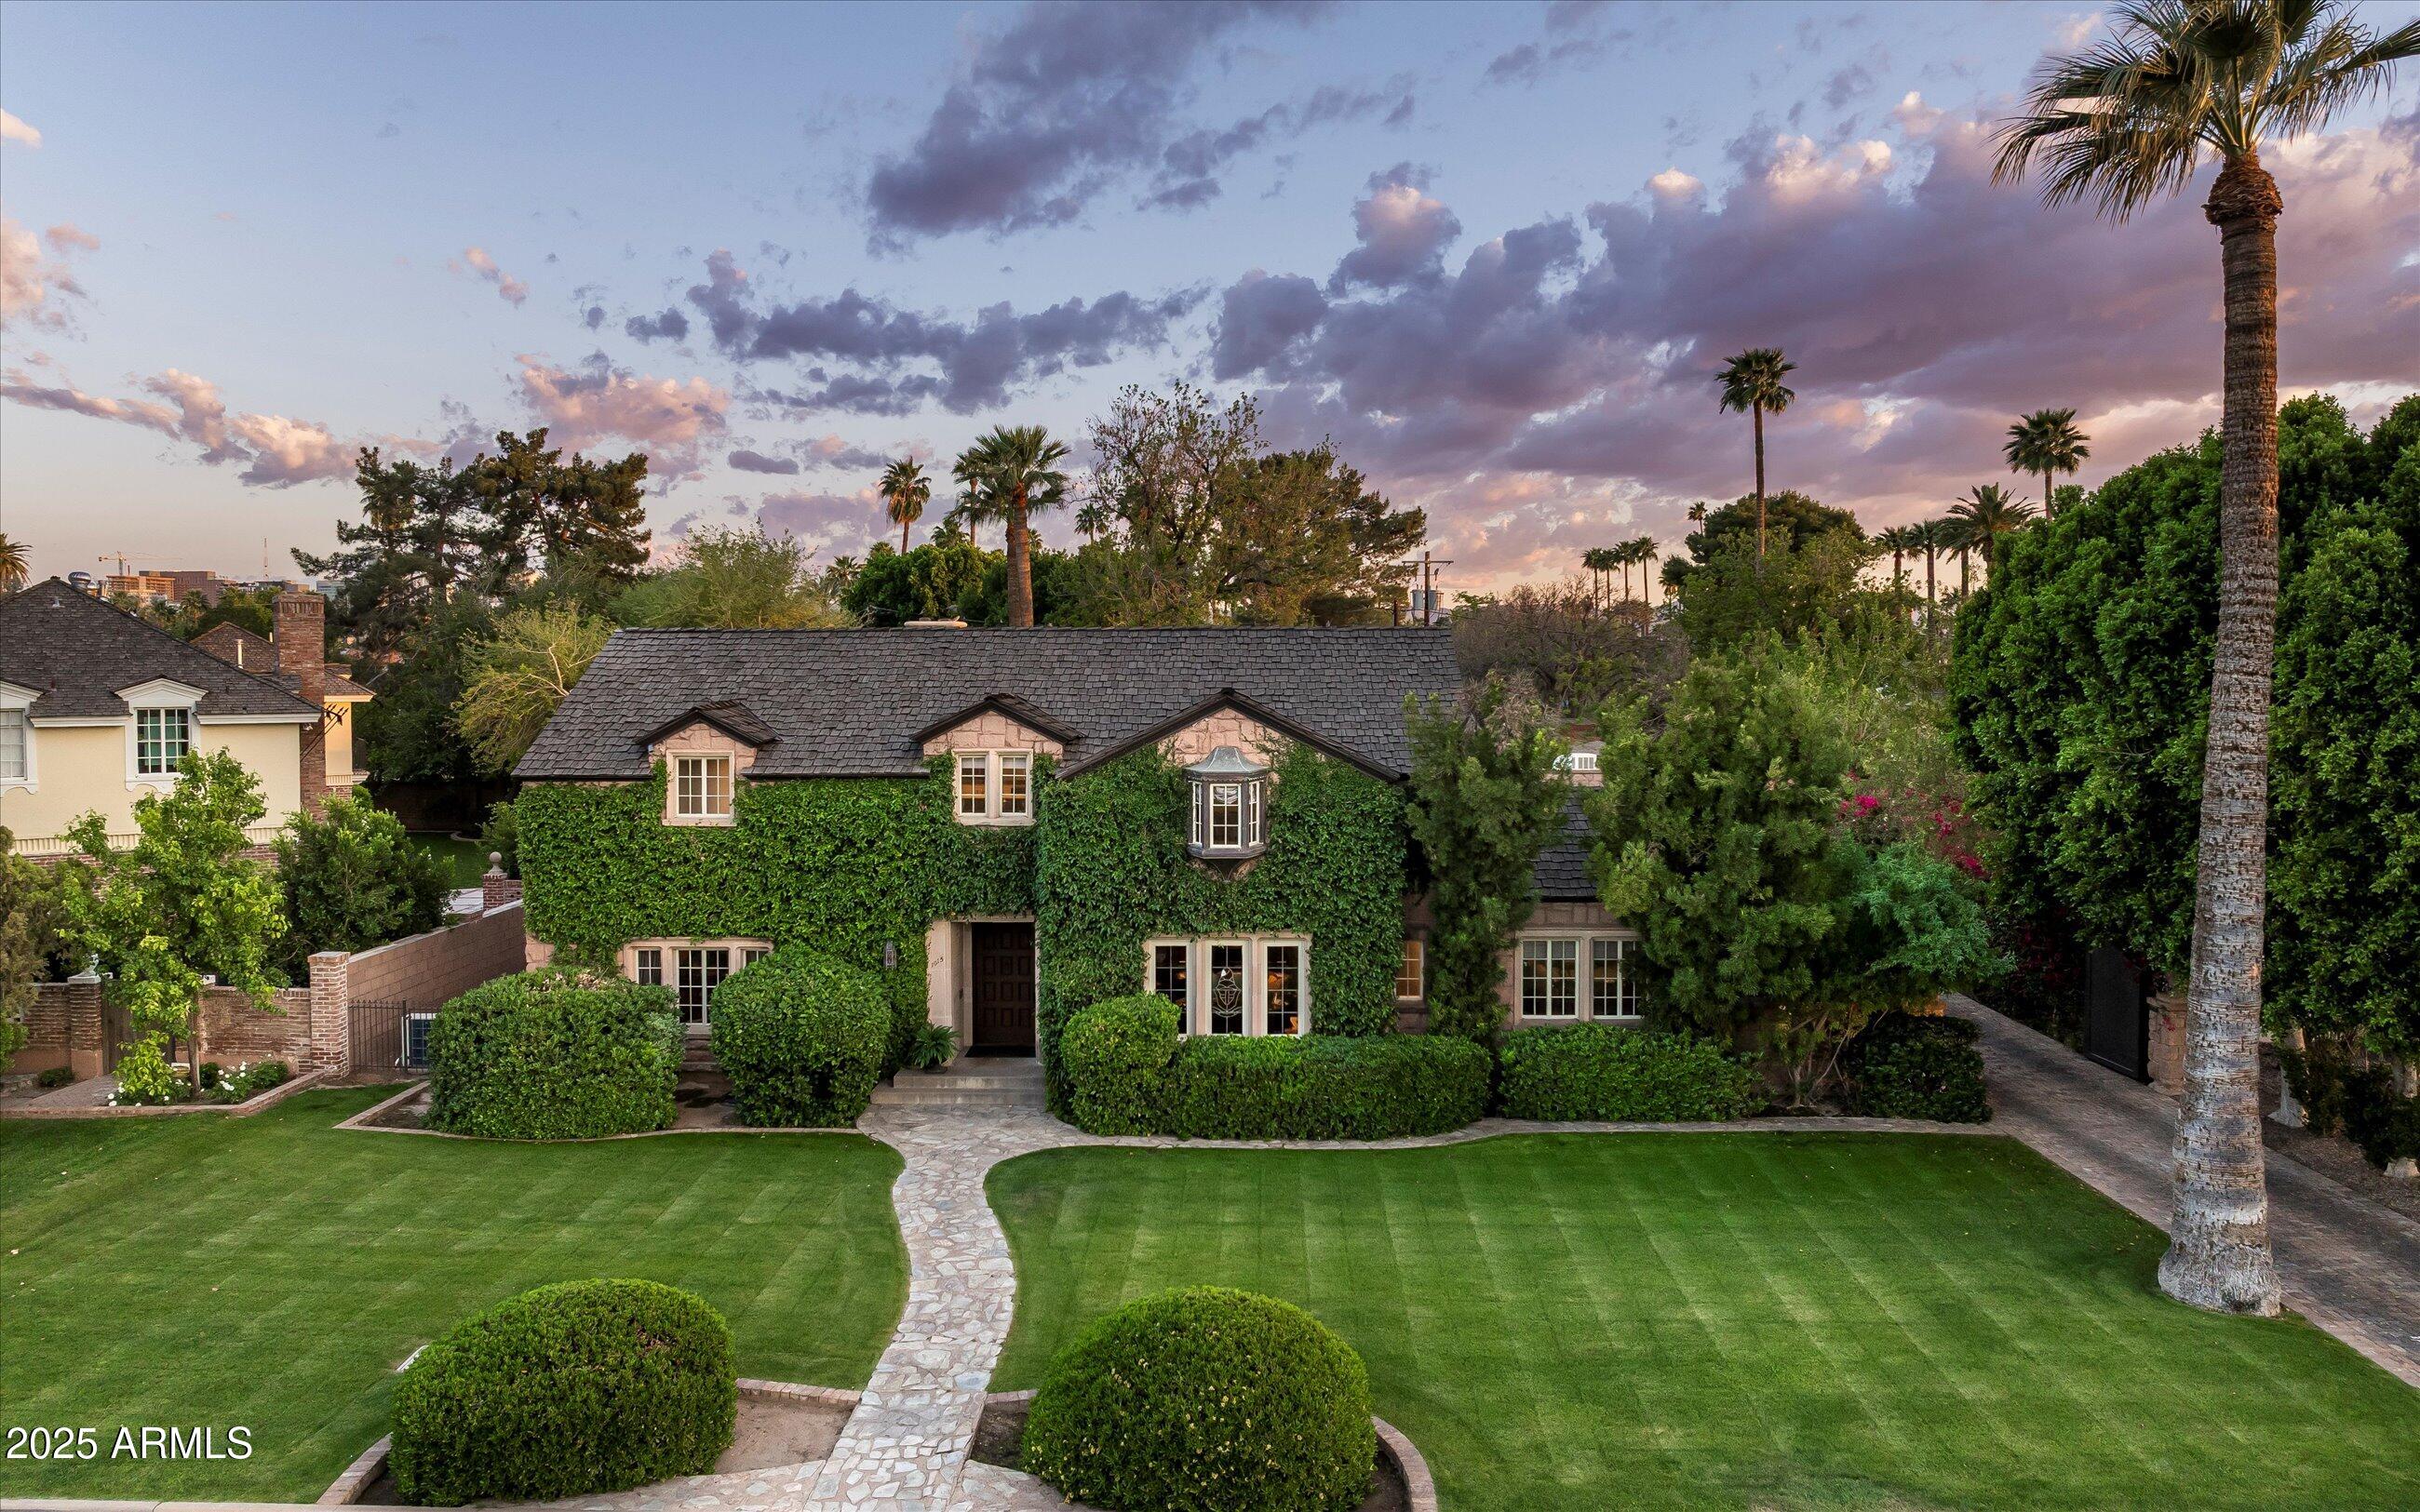
1614 Palmcroft Dr SW, Phoenix, AZ 85007
$-6,251
Cash flow
-18.1%
Cash-on-Cash Return
2.1%
Cap rate
0.3%
Rent to Value Ratio
Active
$273,900
bds
|
0
ba
|
0
sqft
|
built
1946
1514 W Sherman St, Phoenix, AZ 85007
$-370
Cash flow
-7.0%
Cash-on-Cash Return
4.7%
Cap rate
0.6%
Rent to Value Ratio
Active
$600,000
3
bds
|
2
ba
|
1,595
sqft
|
built
1941
1610 W Wilshire Dr, Phoenix, AZ 85007
$-1,165
Cash flow
-10.1%
Cash-on-Cash Return
4.0%
Cap rate
0.5%
Rent to Value Ratio

Active
$900,000
4
bds
|
3
ba
|
3,015
sqft
|
built
1948
701 W Cambridge Ave, Phoenix, AZ 85007
$-1,077
Cash flow
-6.2%
Cash-on-Cash Return
4.9%
Cap rate
0.6%
Rent to Value Ratio

Active
$550,000
2
bds
|
3
ba
|
2,059
sqft
|
built
1900
1521 W Garfield St, Phoenix, AZ 85007
$-1,082
Cash flow
-10.3%
Cash-on-Cash Return
4.0%
Cap rate
0.5%
Rent to Value Ratio
Active
$849,995
3
bds
|
3
ba
|
2,893
sqft
|
built
1953
1345 W Edgemont Ave, Phoenix, AZ 85007
$-1,103
Cash flow
-6.8%
Cash-on-Cash Return
4.8%
Cap rate
0.6%
Rent to Value Ratio
Active
$699,999
bds
|
0
ba
|
0
sqft
|
built
1983
1509 W Pierce St, Phoenix, AZ 85007
$-2,538
Cash flow
-18.9%
Cash-on-Cash Return
2.0%
Cap rate
0.3%
Rent to Value Ratio
Active
$852,500
3
bds
|
3
ba
|
2,926
sqft
|
built
1950
845 W Edgemont Ave, Phoenix, AZ 85007
$-2,772
Cash flow
-17.0%
Cash-on-Cash Return
2.4%
Cap rate
0.4%
Rent to Value Ratio
Active
$1,399,000
bds
|
0
ba
|
0
sqft
|
built
1895
1527 W Fillmore St, Phoenix, AZ 85007
$-5,674
Cash flow
-21.2%
Cash-on-Cash Return
1.4%
Cap rate
0.2%
Rent to Value Ratio

Active
$315,000
4
bds
|
2
ba
|
1,296
sqft
|
built
1964
1232 S 10th Ave, Phoenix, AZ 85007
$-564
Cash flow
-9.3%
Cash-on-Cash Return
4.2%
Cap rate
0.5%
Rent to Value Ratio
Active
$775,000
3
bds
|
2
ba
|
1,928
sqft
|
built
1930
1547 W Vernon Ave, Phoenix, AZ 85007
$-1,826
Cash flow
-12.3%
Cash-on-Cash Return
3.5%
Cap rate
0.5%
Rent to Value Ratio

Active
$900,000
bds
|
0
ba
|
0
sqft
|
built
1986
1046 W Polk St, Phoenix, AZ 85007
$-4,090
Cash flow
-23.7%
Cash-on-Cash Return
0.9%
Cap rate
0.1%
Rent to Value Ratio
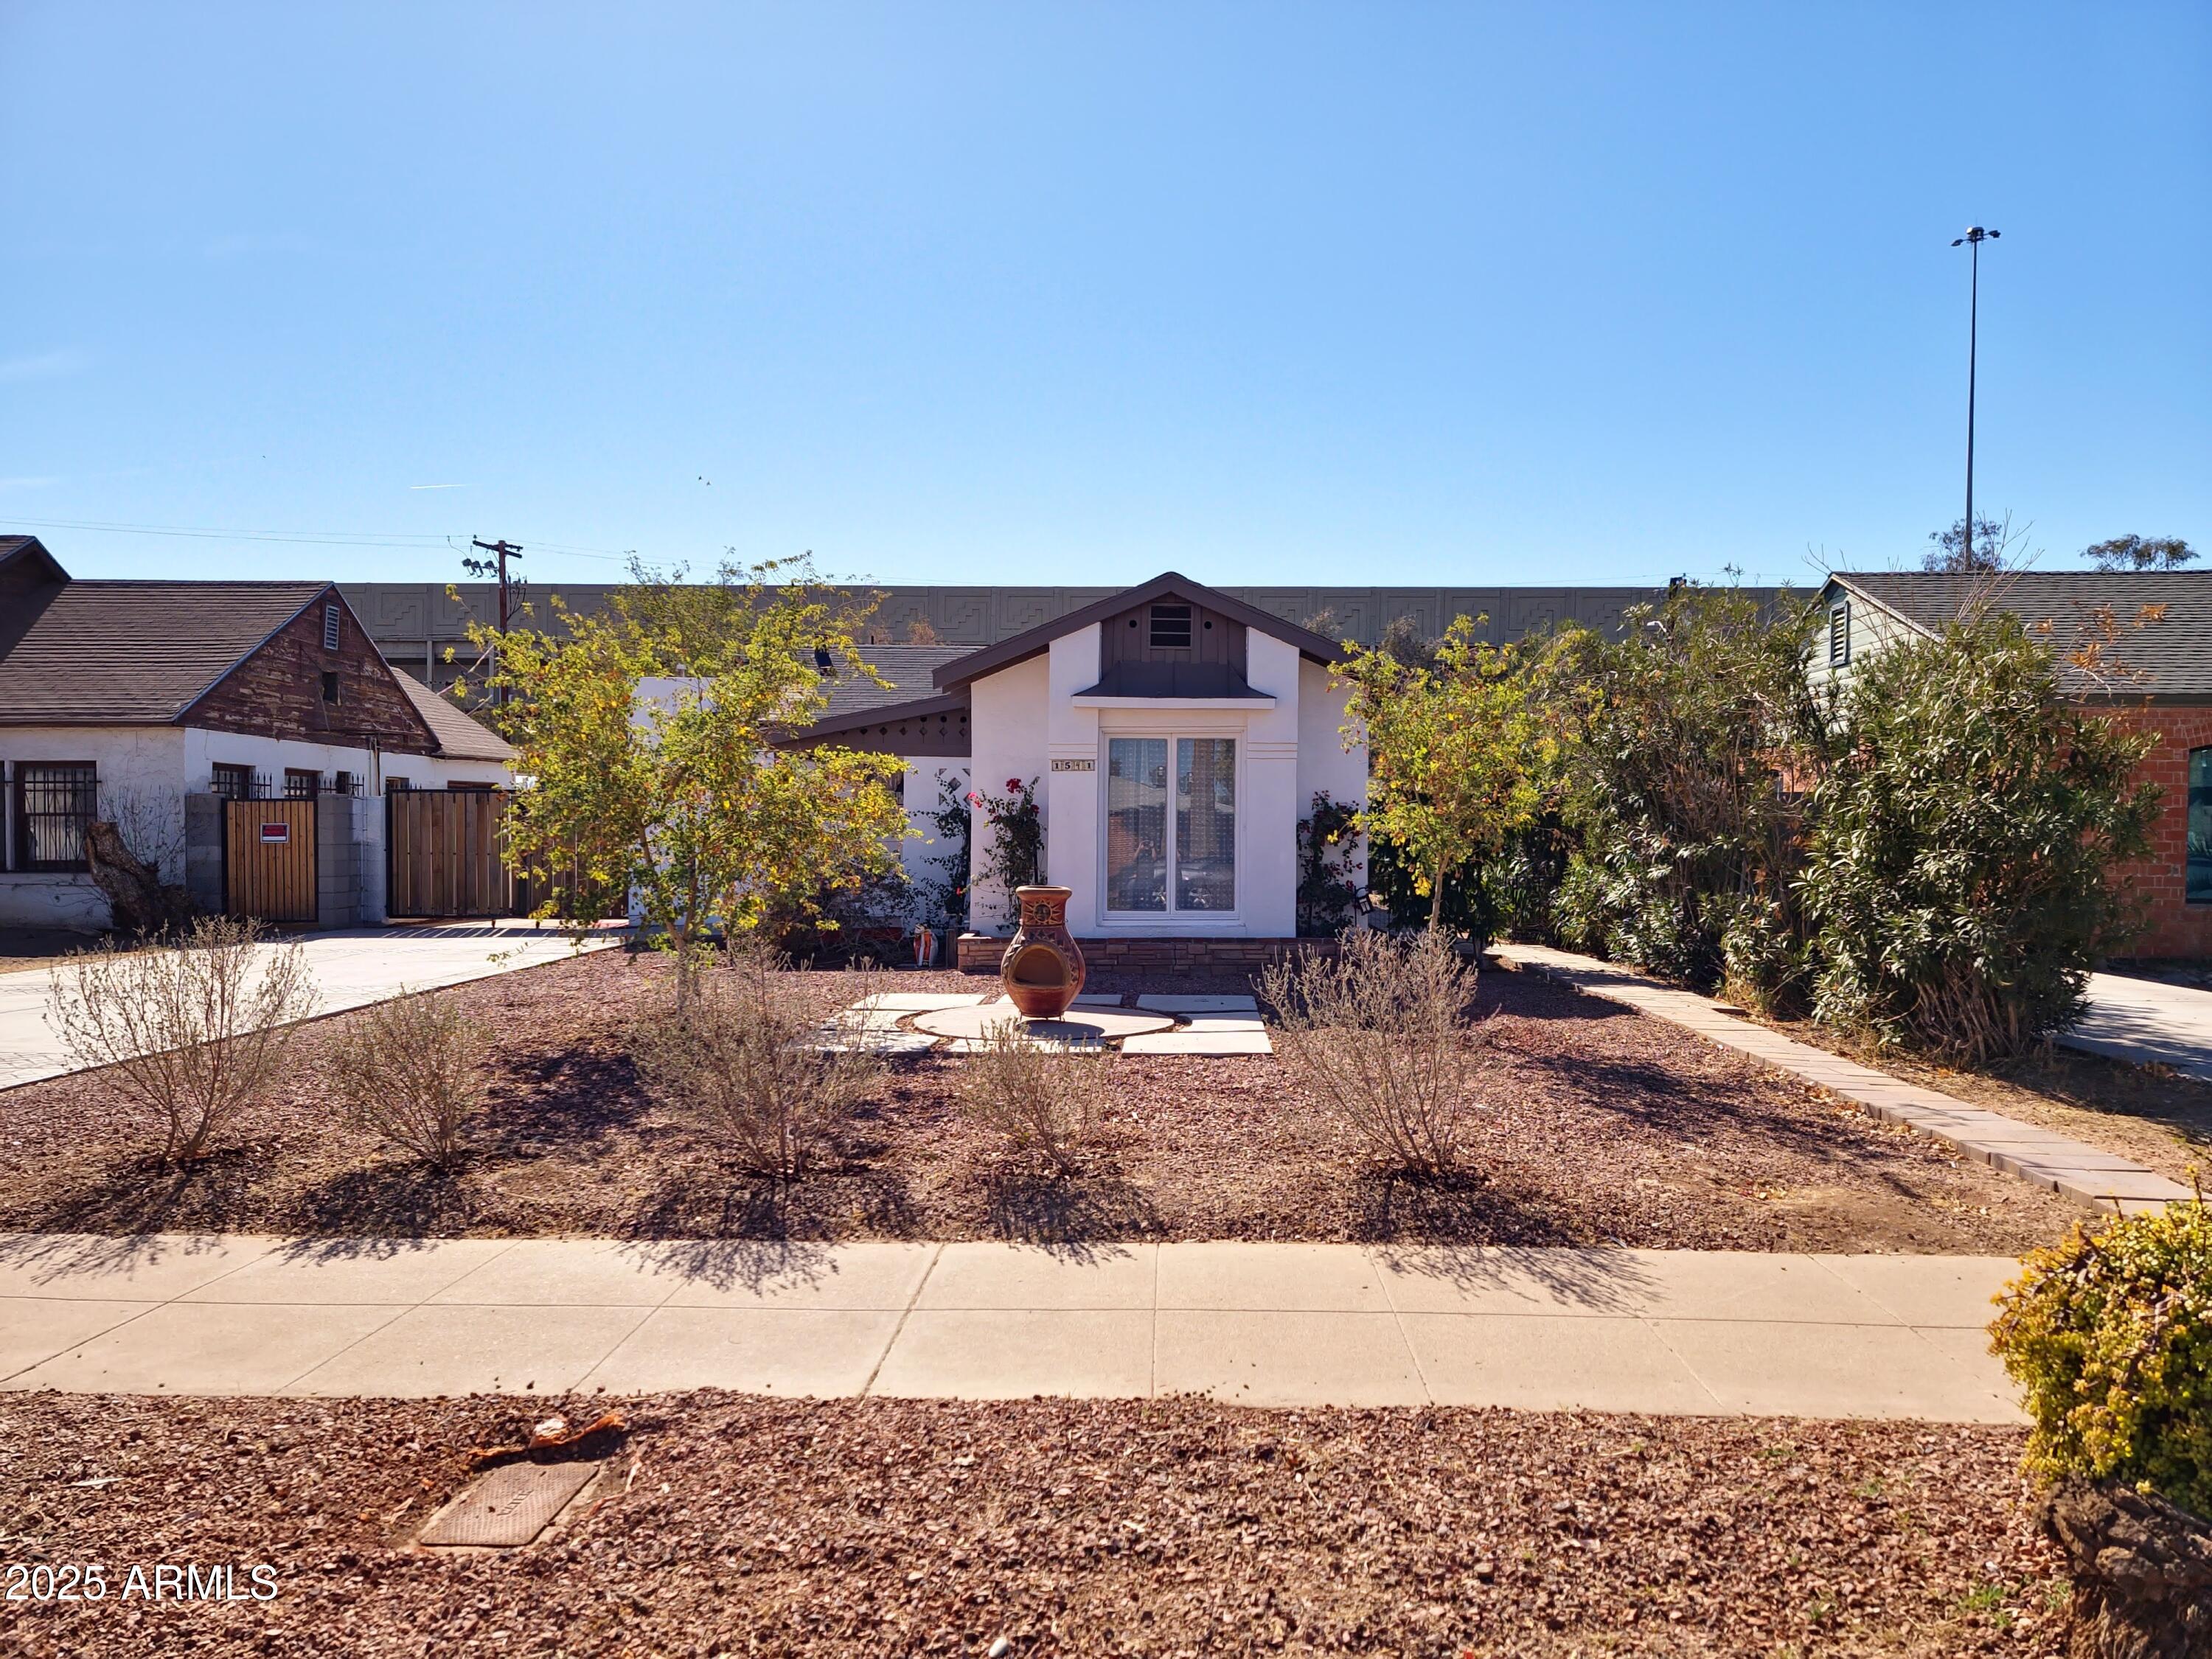
Active
$649,000
3
bds
|
2
ba
|
1,603
sqft
|
built
1936
1541 W Culver St, Phoenix, AZ 85007
$-1,747
Cash flow
-14.0%
Cash-on-Cash Return
3.1%
Cap rate
0.4%
Rent to Value Ratio
Active
$775,000
3
bds
|
3
ba
|
1,529
sqft
|
built
1936
1546 W Culver St, Phoenix, AZ 85007
$-2,178
Cash flow
-14.7%
Cash-on-Cash Return
2.9%
Cap rate
0.4%
Rent to Value Ratio
Active
$299,900
2
bds
|
2
ba
|
1,285
sqft
|
built
1931
1522 W Fillmore St, Phoenix, AZ 85007
$-745
Cash flow
-13.0%
Cash-on-Cash Return
3.3%
Cap rate
0.5%
Rent to Value Ratio

Active
$439,900
2
bds
|
1
ba
|
917
sqft
|
built
1941
1622 N 17th Ave, Phoenix, AZ 85007
$-893
Cash flow
-10.6%
Cash-on-Cash Return
3.9%
Cap rate
0.5%
Rent to Value Ratio

Active
$455,000
2
bds
|
1
ba
|
904
sqft
|
built
1939
2041 N 16th Ave, Phoenix, AZ 85007
$-936
Cash flow
-10.7%
Cash-on-Cash Return
3.8%
Cap rate
0.5%
Rent to Value Ratio
Active
$3,275,000
4
bds
|
3
ba
|
4,425
sqft
|
built
1934
1015 W Encanto Blvd, Phoenix, AZ 85007
$-14,145
Cash flow
-22.5%
Cash-on-Cash Return
1.1%
Cap rate
0.2%
Rent to Value Ratio
Active
$800,000
bds
|
0
ba
|
0
sqft
|
built
1937
311 N Laurel Ave, Phoenix, AZ 85007
$-2,610
Cash flow
-17.0%
Cash-on-Cash Return
2.4%
Cap rate
0.3%
Rent to Value Ratio
Active
$1,194,000
3
bds
|
3
ba
|
2,361
sqft
|
built
1925
901 W Culver St, Phoenix, AZ 85007
$-2,699
Cash flow
-11.8%
Cash-on-Cash Return
3.6%
Cap rate
0.5%
Rent to Value Ratio
Active
$375,000
2
bds
|
2
ba
|
1,001
sqft
|
built
1950
925 W Mc Dowell Rd, Phoenix, AZ 85007
$-1,087
Cash flow
-15.1%
Cash-on-Cash Return
2.8%
Cap rate
0.5%
Rent to Value Ratio
Active
$725,000
5
bds
|
5
ba
|
2,682
sqft
|
built
1946
1520 W Encanto Blvd, Phoenix, AZ 85007
$-2,084
Cash flow
-15.0%
Cash-on-Cash Return
2.9%
Cap rate
0.4%
Rent to Value Ratio
Active
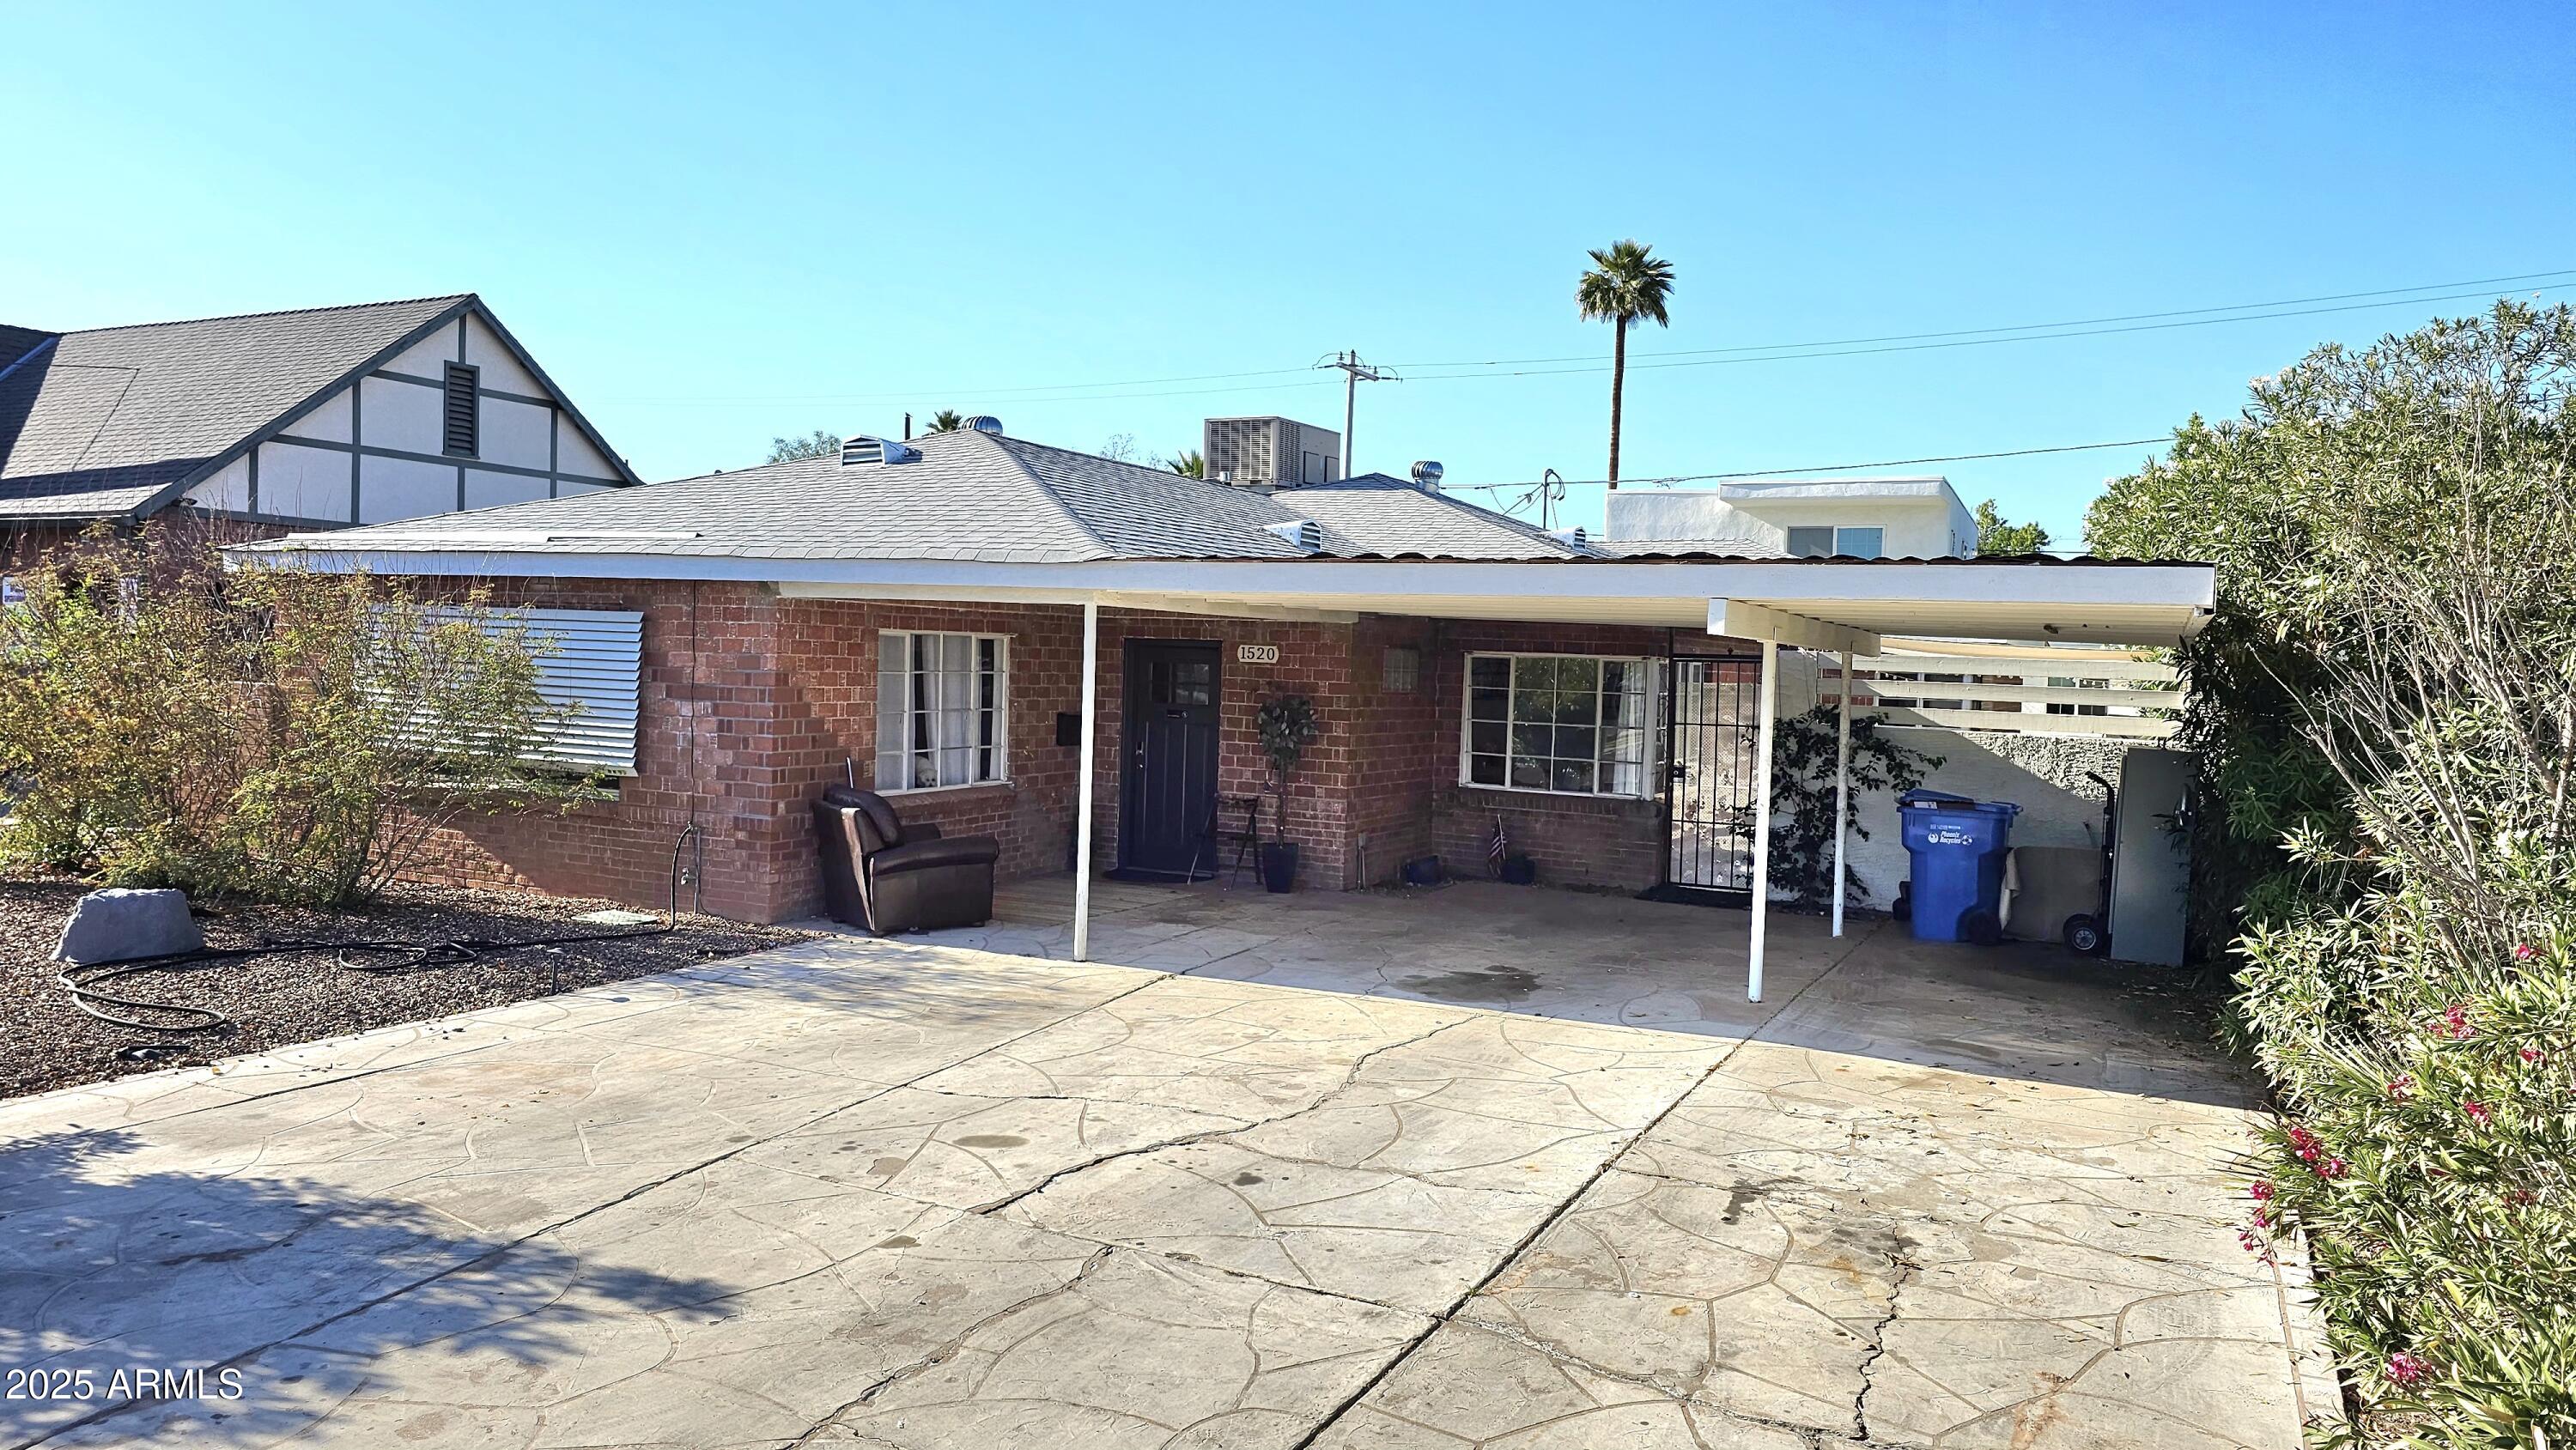
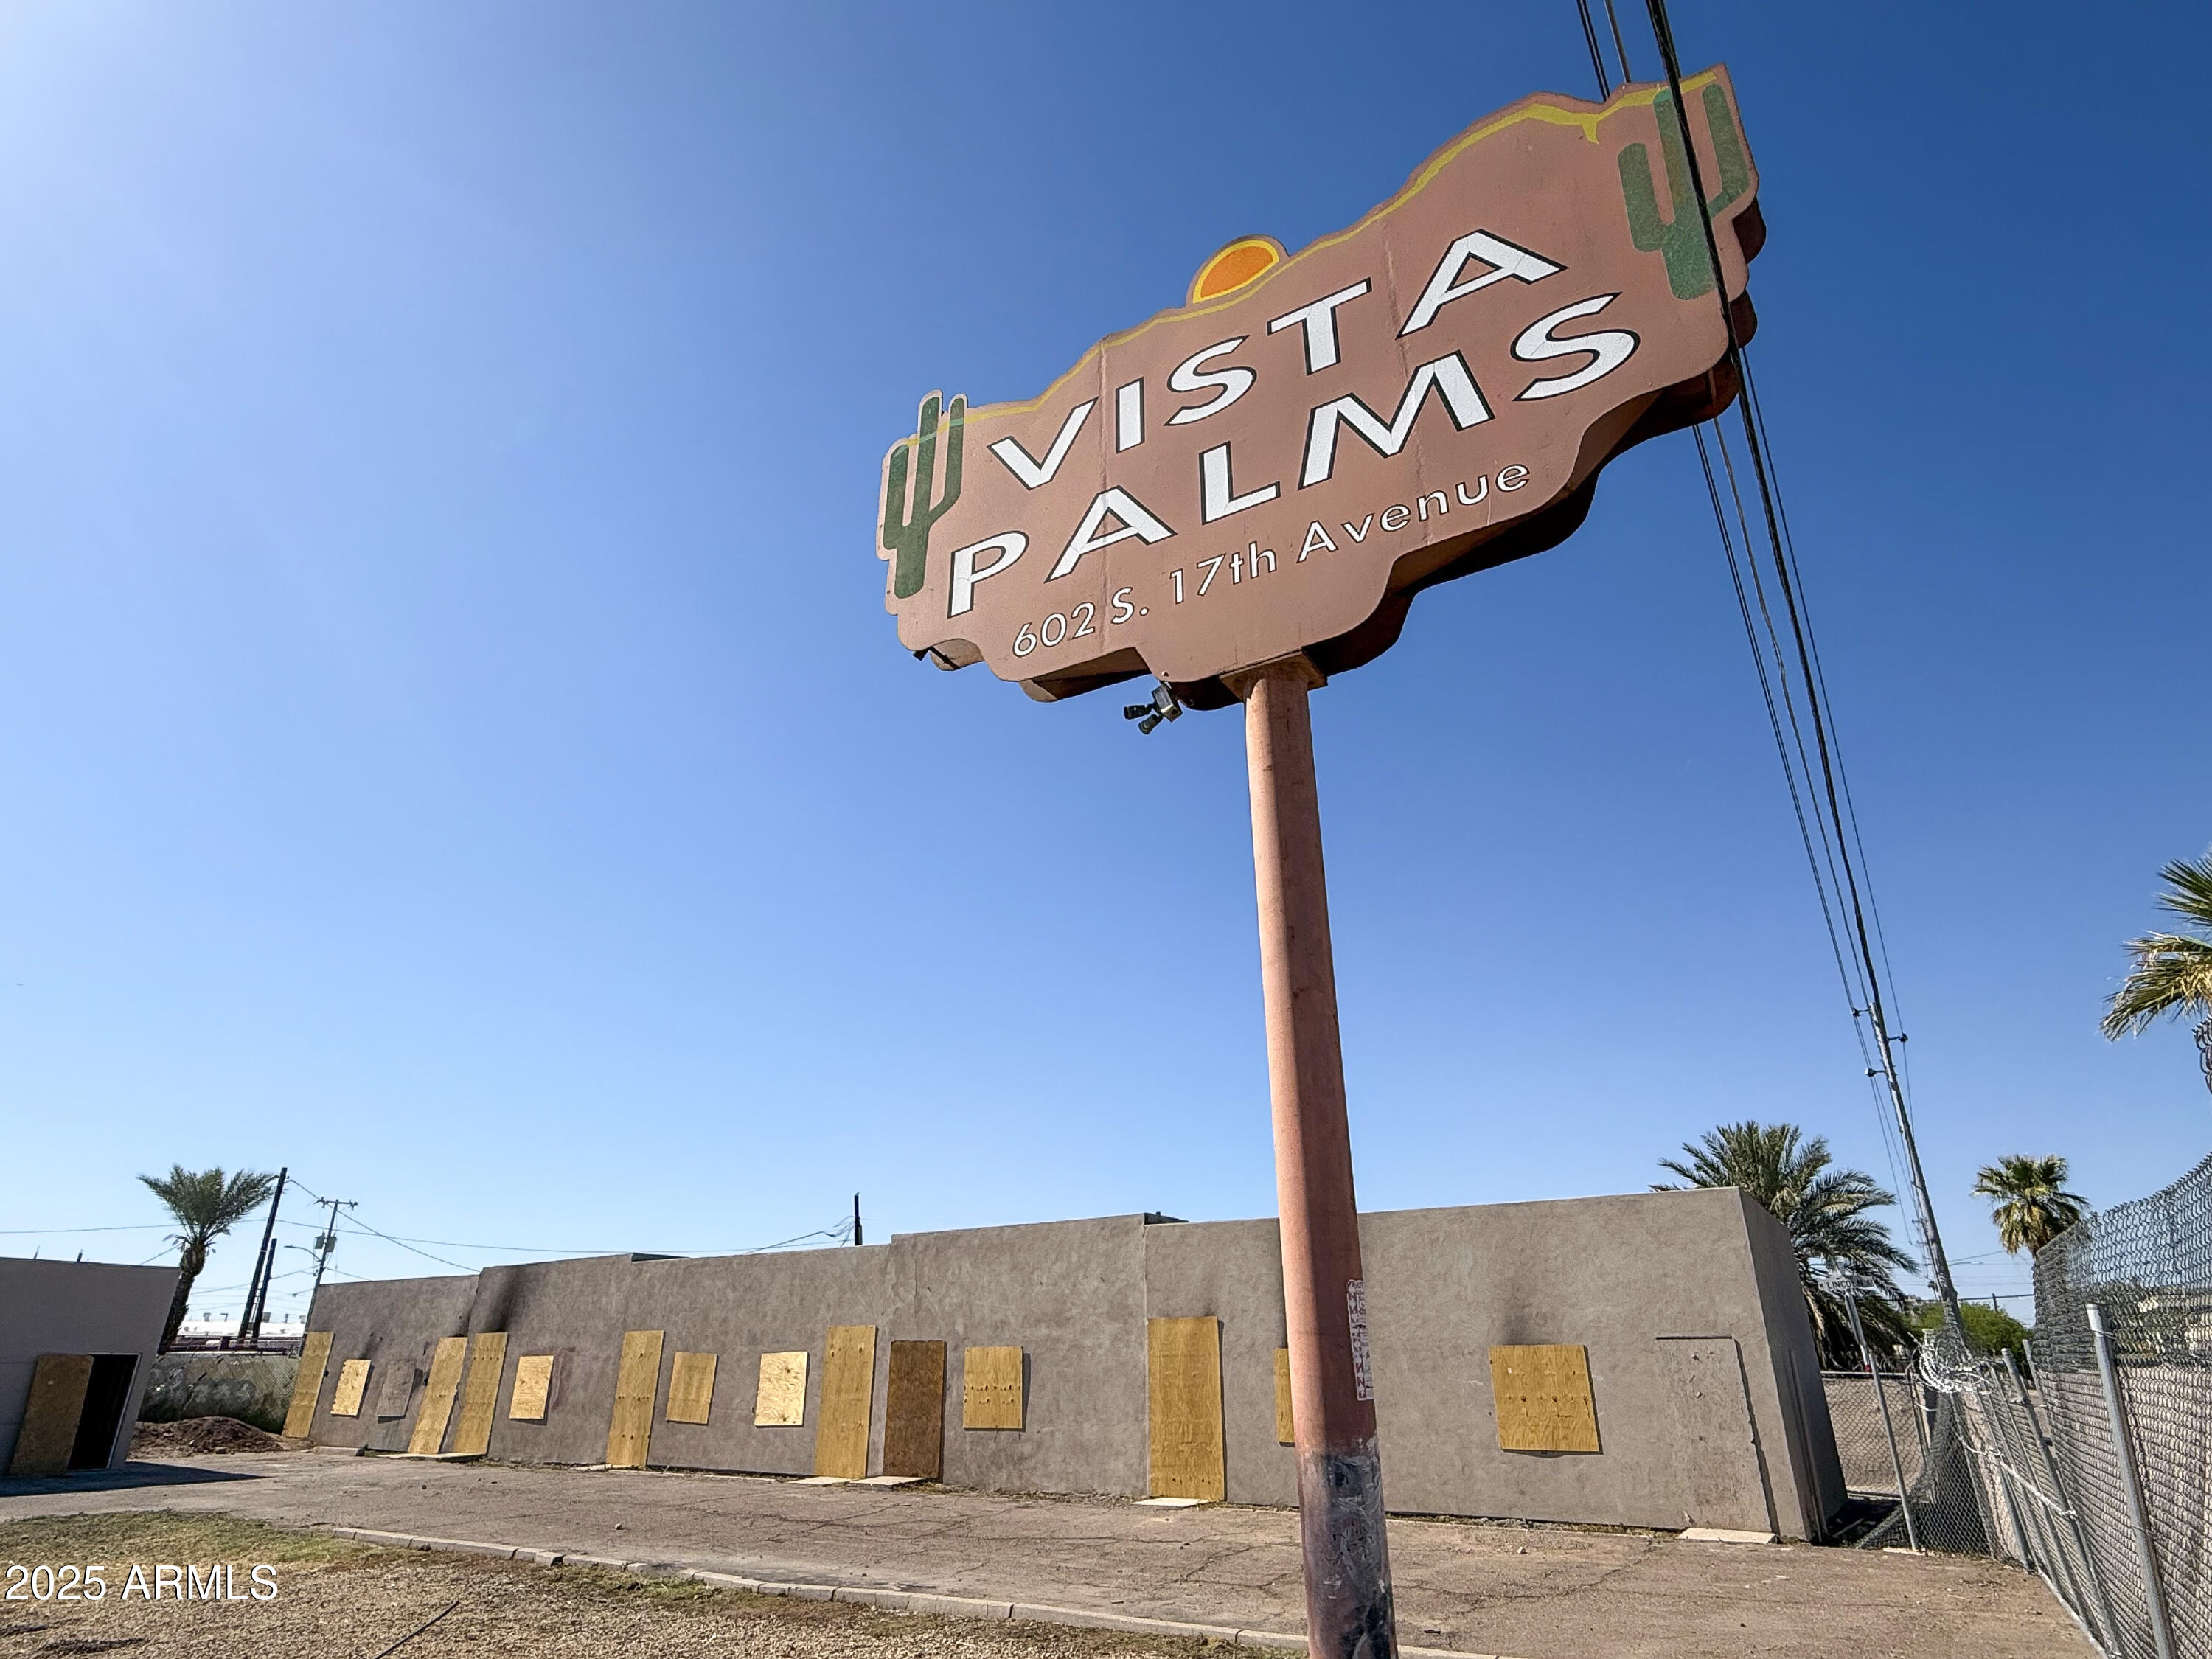
$850,000
bds
|
0
ba
|
0
sqft
|
built
1947
602 S 17th Ave, Phoenix, AZ 85007
$-3,970
Cash flow
-24.4%
Cash-on-Cash Return
0.7%
Cap rate
0.1%
Rent to Value Ratio
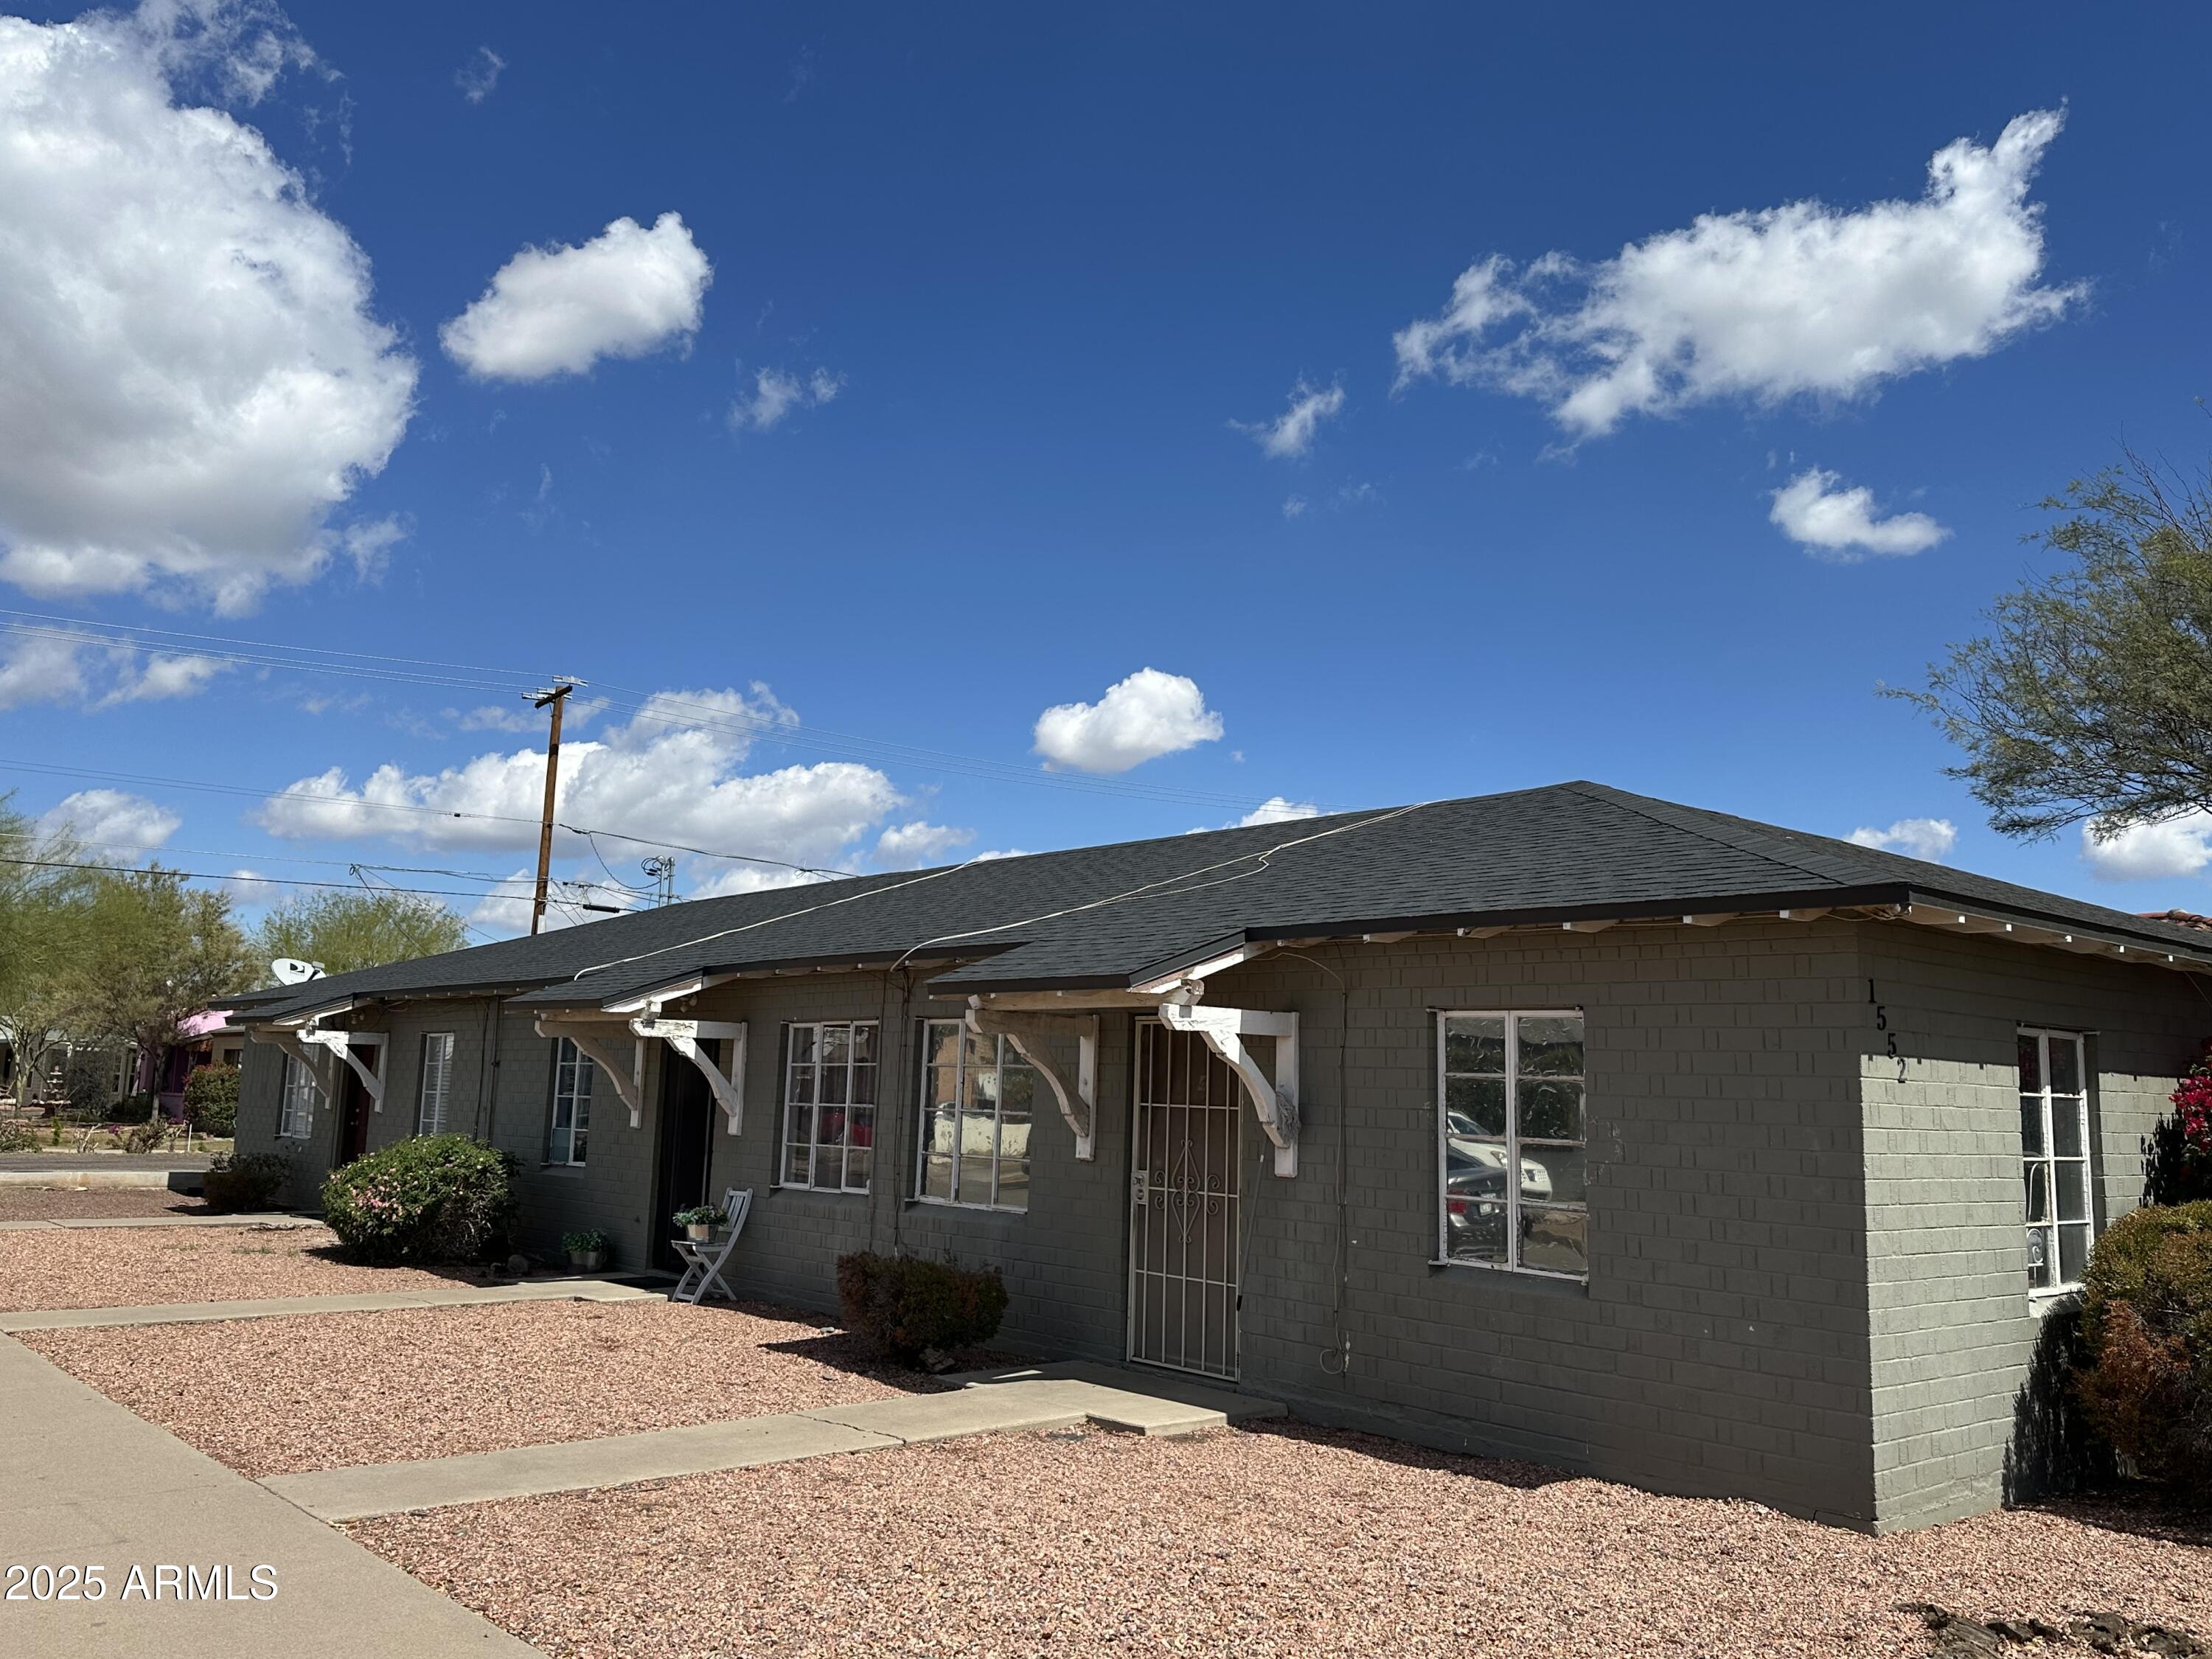
Active
$815,000
bds
|
0
ba
|
0
sqft
|
built
1946
1552 W Mc Dowell Rd, Phoenix, AZ 85007
$-3,028
Cash flow
-19.4%
Cash-on-Cash Return
1.9%
Cap rate
0.2%
Rent to Value Ratio
Active
$425,000
3
bds
|
2
ba
|
1,563
sqft
|
built
2022
1217 S 12th Ave, Phoenix, AZ 85007
$-799
Cash flow
-9.8%
Cash-on-Cash Return
4.1%
Cap rate
0.5%
Rent to Value Ratio
Active
$655,000
3
bds
|
2
ba
|
1,304
sqft
|
built
1934
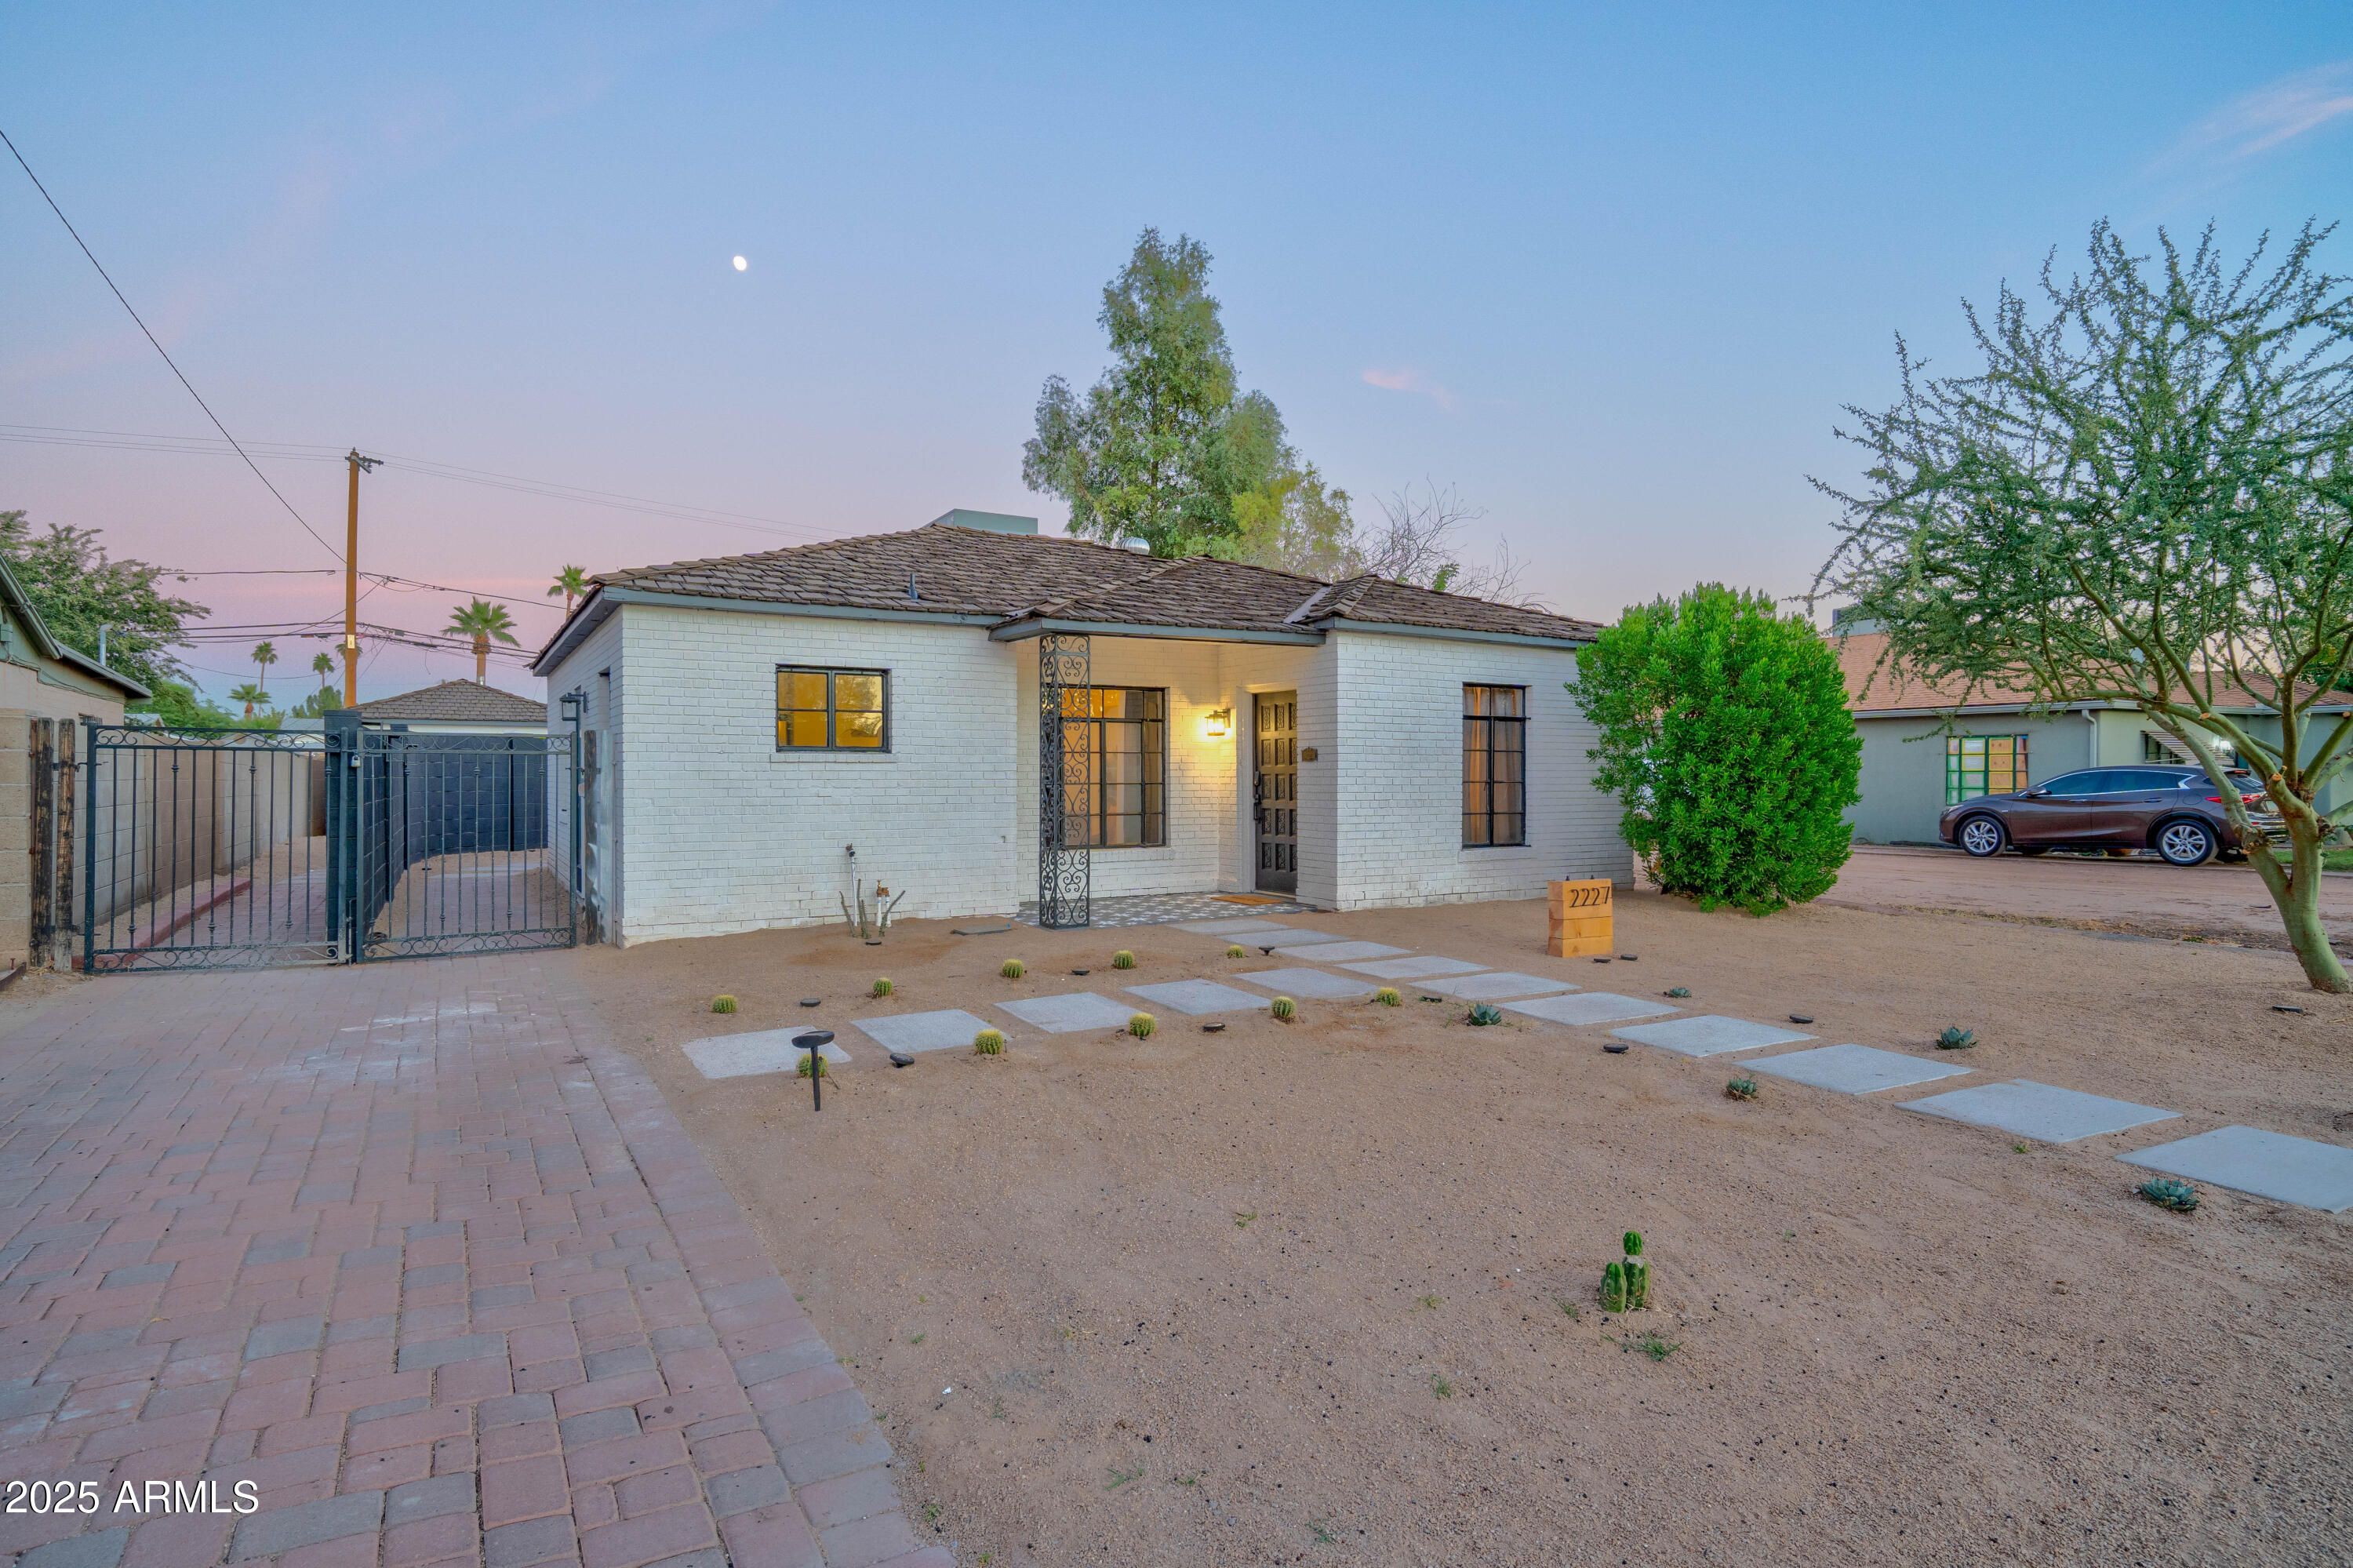
2227 N 16th Ave, Phoenix, AZ 85007
$-2,406
Cash flow
-19.2%
Cash-on-Cash Return
1.9%
Cap rate
0.2%
Rent to Value Ratio

Active
$410,000
2
bds
|
2
ba
|
1,144
sqft
|
built
1950
925 W Mc Dowell Rd, Phoenix, AZ 85007
$-1,256
Cash flow
-16.0%
Cash-on-Cash Return
2.6%
Cap rate
0.5%
Rent to Value Ratio

Active
$899,000
3
bds
|
2
ba
|
2,510
sqft
|
built
1943
1820 N 7th Ave, Phoenix, AZ 85007
$-2,529
Cash flow
-14.7%
Cash-on-Cash Return
2.9%
Cap rate
0.4%
Rent to Value Ratio
Active
$564,000
2
bds
|
2
ba
|
1,567
sqft
|
built
1948
701 W Wilshire Dr, Phoenix, AZ 85007
$-1,168
Cash flow
-10.8%
Cash-on-Cash Return
3.8%
Cap rate
0.5%
Rent to Value Ratio
Active
$649,000
3
bds
|
3
ba
|
2,049
sqft
|
built
1950
2807 N 8th Ave, Phoenix, AZ 85007
$-1,787
Cash flow
-14.4%
Cash-on-Cash Return
3.0%
Cap rate
0.4%
Rent to Value Ratio

Active
$2,495,000
5
bds
|
4
ba
|
5,696
sqft
|
built
1935
2233 N 9th Ave, Phoenix, AZ 85007
$-7,462
Cash flow
-15.6%
Cash-on-Cash Return
2.7%
Cap rate
0.4%
Rent to Value Ratio
Active
$315,000
1
bds
|
1
ba
|
719
sqft
|
built
1926
809 N 11th Ave, Phoenix, AZ 85007
$-524
Cash flow
-8.7%
Cash-on-Cash Return
4.3%
Cap rate
0.6%
Rent to Value Ratio
Active
$369,000
3
bds
|
2
ba
|
1,529
sqft
|
built
1936
2230 N Laurel Ave, Phoenix, AZ 85007
$-635
Cash flow
-9.0%
Cash-on-Cash Return
4.3%
Cap rate
0.5%
Rent to Value Ratio