85014 Investment Properties for Sale
Browse homes for sale and investment properties in 85014. Refine your search by price, property type, or more.
Best cash flowing properties in 85014
Active
$289,000
2
bds
|
2
ba
|
1,030
sqft
|
built
1997
5303 N 7th St, Phoenix, AZ 85014
$398
Cash flow
7.2%
Cash-on-Cash Return
7.3%
Cap rate
1.1%
Rent to Value Ratio
Active
$140,000
1
bds
|
1
ba
|
563
sqft
|
built
2007
4401 N 12th St, Phoenix, AZ 85014
$-179
Cash flow
-6.7%
Cash-on-Cash Return
4.1%
Cap rate
0.8%
Rent to Value Ratio
63 out of 75 properties for sale in 85014
Limited Results Shown
Create a free account, or log in to reveal all property listings and enjoy the complete experience.
Active
$550,000
3
bds
|
2
ba
|
1,610
sqft
|
built
1951
6750 N 11th Pl, Phoenix, AZ 85014
$-1,084
Cash flow
-10.3%
Cash-on-Cash Return
3.3%
Cap rate
0.5%
Rent to Value Ratio
Active
$272,000
2
bds
|
1
ba
|
780
sqft
|
built
1960
1219 E Colter St, Phoenix, AZ 85014
$-529
Cash flow
-10.1%
Cash-on-Cash Return
3.3%
Cap rate
0.6%
Rent to Value Ratio
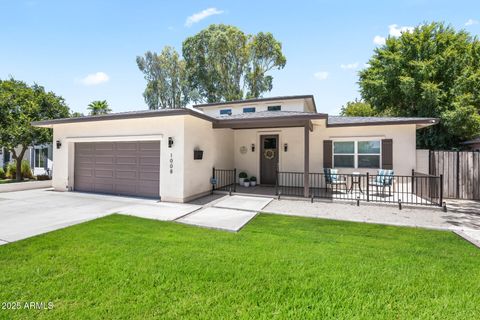
Active
$945,000
3
bds
|
3
ba
|
2,440
sqft
|
built
2015
1008 E Medlock Dr, Phoenix, AZ 85014
$-2,395
Cash flow
-13.2%
Cash-on-Cash Return
2.6%
Cap rate
0.4%
Rent to Value Ratio

Active
$849,900
4
bds
|
3
ba
|
2,200
sqft
|
built
1954
6842 N 14th St, Phoenix, AZ 85014
$-2,132
Cash flow
-13.1%
Cash-on-Cash Return
2.7%
Cap rate
0.4%
Rent to Value Ratio
Active
$445,000
1
bds
|
2
ba
|
1,308
sqft
|
built
2001
914 E Osborn Rd, Phoenix, AZ 85014
$-1,188
Cash flow
-13.9%
Cash-on-Cash Return
2.5%
Cap rate
0.6%
Rent to Value Ratio
Active
$639,000
3
bds
|
2
ba
|
1,820
sqft
|
built
1972
710 E Tuckey Ln, Phoenix, AZ 85014
$-1,779
Cash flow
-14.5%
Cash-on-Cash Return
2.3%
Cap rate
0.4%
Rent to Value Ratio
Active
$724,900
3
bds
|
2
ba
|
1,814
sqft
|
built
1950
826 E Lamar Rd, Phoenix, AZ 85014
$-934
Cash flow
-6.7%
Cash-on-Cash Return
4.1%
Cap rate
0.5%
Rent to Value Ratio
Active
$389,900
4
bds
|
1
ba
|
1,395
sqft
|
built
1946
1300 E Meadowbrook Ave, Phoenix, AZ 85014
$-563
Cash flow
-7.5%
Cash-on-Cash Return
3.9%
Cap rate
0.5%
Rent to Value Ratio
Active
$674,900
3
bds
|
2
ba
|
1,674
sqft
|
built
1955
6121 N 11th St, Phoenix, AZ 85014
$-1,706
Cash flow
-13.2%
Cash-on-Cash Return
2.6%
Cap rate
0.4%
Rent to Value Ratio
Active
$999,995
3
bds
|
3
ba
|
2,414
sqft
|
built
1950
1208 E Tuckey Ln, Phoenix, AZ 85014
$-2,602
Cash flow
-13.6%
Cash-on-Cash Return
2.6%
Cap rate
0.4%
Rent to Value Ratio
Active
$255,000
2
bds
|
2
ba
|
953
sqft
|
built
1984
5035 N 10th Pl, Phoenix, AZ 85014
$-534
Cash flow
-10.9%
Cash-on-Cash Return
3.2%
Cap rate
0.6%
Rent to Value Ratio

Active
$899,999
3
bds
|
2
ba
|
2,032
sqft
|
built
1950
1029 E Palo Verde Dr, Phoenix, AZ 85014
$-1,914
Cash flow
-11.1%
Cash-on-Cash Return
3.1%
Cap rate
0.4%
Rent to Value Ratio
Active
$1,350,000
5
bds
|
4
ba
|
2,940
sqft
|
built
2023
707 E Ocotillo Rd, Phoenix, AZ 85014
$-1,480
Cash flow
-5.7%
Cash-on-Cash Return
4.4%
Cap rate
0.6%
Rent to Value Ratio
Active
$375,000
2
bds
|
1
ba
|
1,240
sqft
|
built
1965
713 E Amelia Ave, Phoenix, AZ 85014
$-611
Cash flow
-8.5%
Cash-on-Cash Return
3.7%
Cap rate
0.5%
Rent to Value Ratio
Active
$699,000
2
bds
|
2
ba
|
2,676
sqft
|
built
2001
914 E Osborn Rd, Phoenix, AZ 85014
$-849
Cash flow
-6.3%
Cash-on-Cash Return
4.2%
Cap rate
0.8%
Rent to Value Ratio
Active
$1,140,000
bds
|
0
ba
|
0
sqft
|
built
1983
3422 N 12th Pl, Phoenix, AZ 85014
$-4,263
Cash flow
-19.5%
Cash-on-Cash Return
1.2%
Cap rate
0.2%
Rent to Value Ratio
Active
$263,000
2
bds
|
1
ba
|
780
sqft
|
built
2007
1219 E Colter St, Phoenix, AZ 85014
$-494
Cash flow
-9.8%
Cash-on-Cash Return
3.4%
Cap rate
0.6%
Rent to Value Ratio

Active
$980,000
bds
|
0
ba
|
0
sqft
|
built
1955
1023 E Amelia Ave, Phoenix, AZ 85014
$-3,693
Cash flow
-19.7%
Cash-on-Cash Return
1.2%
Cap rate
0.2%
Rent to Value Ratio
Active
$304,900
2
bds
|
2
ba
|
1,178
sqft
|
built
1999
3302 N 7th St, Phoenix, AZ 85014
$-736
Cash flow
-12.6%
Cash-on-Cash Return
2.8%
Cap rate
0.6%
Rent to Value Ratio
Active
$940,000
2
bds
|
3
ba
|
2,409
sqft
|
built
1990
1040 E Osborn Rd, Phoenix, AZ 85014
$-2,517
Cash flow
-14.0%
Cash-on-Cash Return
2.5%
Cap rate
0.6%
Rent to Value Ratio
Active
$825,000
3
bds
|
2
ba
|
1,702
sqft
|
built
1951
5739 N 11th St, Phoenix, AZ 85014
$-2,154
Cash flow
-13.6%
Cash-on-Cash Return
2.5%
Cap rate
0.4%
Rent to Value Ratio
Active
$875,000
4
bds
|
2
ba
|
2,378
sqft
|
built
1953
1316 E Vermont Ave, Phoenix, AZ 85014
$-474
Cash flow
-2.8%
Cash-on-Cash Return
5.0%
Cap rate
0.7%
Rent to Value Ratio
Active
$369,000
3
bds
|
2
ba
|
1,275
sqft
|
built
1963
6767 N 7th St, Phoenix, AZ 85014
$-851
Cash flow
-12.0%
Cash-on-Cash Return
2.9%
Cap rate
0.5%
Rent to Value Ratio
Active
$249,500
2
bds
|
2
ba
|
1,089
sqft
|
built
1984
5035 N 10th Pl, Phoenix, AZ 85014
$-428
Cash flow
-9.0%
Cash-on-Cash Return
3.6%
Cap rate
0.7%
Rent to Value Ratio
Active
$285,000
2
bds
|
2
ba
|
840
sqft
|
built
1971
749 E Montebello Ave, Phoenix, AZ 85014
$-734
Cash flow
-13.4%
Cash-on-Cash Return
2.6%
Cap rate
0.5%
Rent to Value Ratio
Active
$269,000
2
bds
|
2
ba
|
860
sqft
|
built
1985
4410 N Longview Ave, Phoenix, AZ 85014
$-482
Cash flow
-9.3%
Cash-on-Cash Return
3.5%
Cap rate
0.6%
Rent to Value Ratio
Active
$240,000
2
bds
|
2
ba
|
1,009
sqft
|
built
1969
1006 E Osborn Rd, Phoenix, AZ 85014
$-600
Cash flow
-13.0%
Cash-on-Cash Return
2.7%
Cap rate
0.8%
Rent to Value Ratio
Active
$875,000
bds
|
0
ba
|
0
sqft
|
built
1962
805 E Turney Ave, Phoenix, AZ 85014
$-2,894
Cash flow
-17.3%
Cash-on-Cash Return
1.7%
Cap rate
0.2%
Rent to Value Ratio
Active
$269,900
1
bds
|
1
ba
|
826
sqft
|
built
1997
5303 N 7th St, Phoenix, AZ 85014
$-700
Cash flow
-13.5%
Cash-on-Cash Return
2.6%
Cap rate
0.6%
Rent to Value Ratio

Active
$379,998
2
bds
|
2
ba
|
1,364
sqft
|
built
1963
6767 N 7th St, Phoenix, AZ 85014
$-679
Cash flow
-9.3%
Cash-on-Cash Return
3.5%
Cap rate
0.5%
Rent to Value Ratio

Active
$285,000
2
bds
|
2
ba
|
1,120
sqft
|
built
1960
6530 N 12th St, Phoenix, AZ 85014
$-318
Cash flow
-5.8%
Cash-on-Cash Return
4.3%
Cap rate
0.7%
Rent to Value Ratio
Active
$1,100,000
bds
|
0
ba
|
0
sqft
|
built
1958
4323 N 13th Pl, Phoenix, AZ 85014
$-4,240
Cash flow
-20.1%
Cash-on-Cash Return
1.1%
Cap rate
0.1%
Rent to Value Ratio

Active
$970,000
4
bds
|
3
ba
|
2,611
sqft
|
built
2018
1010 E Pierson St, Phoenix, AZ 85014
$-1,441
Cash flow
-7.8%
Cash-on-Cash Return
3.9%
Cap rate
0.5%
Rent to Value Ratio

Active
$560,000
3
bds
|
2
ba
|
1,852
sqft
|
built
1973
6518 N 12th Pl, Phoenix, AZ 85014
$-591
Cash flow
-5.5%
Cash-on-Cash Return
4.4%
Cap rate
0.6%
Rent to Value Ratio

Active
$470,000
2
bds
|
3
ba
|
1,688
sqft
|
built
1986
6223 N 12th St, Phoenix, AZ 85014
$-1,179
Cash flow
-13.1%
Cash-on-Cash Return
2.7%
Cap rate
0.5%
Rent to Value Ratio
Active
$355,000
2
bds
|
1
ba
|
936
sqft
|
built
1950
3973 N 14th Pl, Phoenix, AZ 85014
$-504
Cash flow
-7.4%
Cash-on-Cash Return
4.0%
Cap rate
0.5%
Rent to Value Ratio

Active
$319,900
2
bds
|
2
ba
|
1,087
sqft
|
built
1974
2946 N 14th St, Phoenix, AZ 85014
$-681
Cash flow
-11.1%
Cash-on-Cash Return
3.1%
Cap rate
0.6%
Rent to Value Ratio

Active
$340,000
2
bds
|
2
ba
|
1,558
sqft
|
built
1963
6767 N 7th St, Phoenix, AZ 85014
$-652
Cash flow
-10.0%
Cash-on-Cash Return
3.4%
Cap rate
0.6%
Rent to Value Ratio