85015 Investment Properties for Sale
Browse homes for sale and investment properties in 85015. Refine your search by price, property type, or more.
Best cash flowing properties in 85015

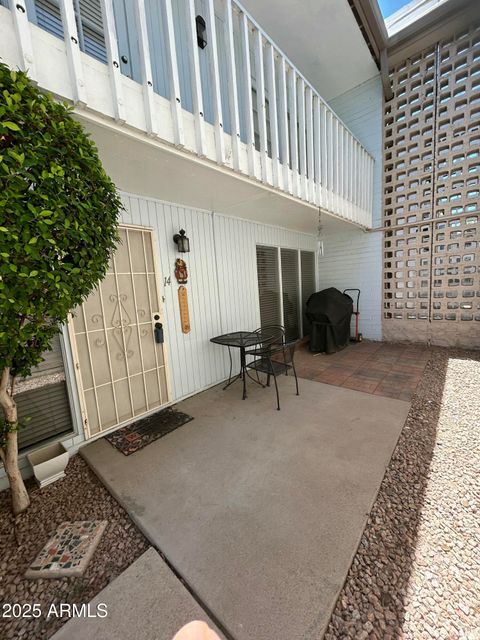
Active
$165,000
2
bds
|
2
ba
|
900
sqft
|
built
1984
4331 N 21st Dr, Phoenix, AZ 85015
$-72
Cash flow
-2.3%
Cash-on-Cash Return
5.2%
Cap rate
0.8%
Rent to Value Ratio
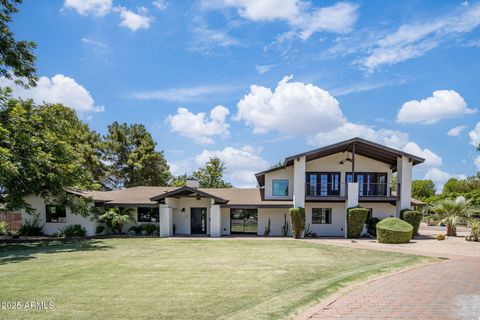
Active
$220,000
2
bds
|
2
ba
|
1,080
sqft
|
built
1964
1734 W Tuckey Ln, Phoenix, AZ 85015
$-149
Cash flow
-3.5%
Cash-on-Cash Return
4.9%
Cap rate
0.7%
Rent to Value Ratio
74 out of 84 properties for sale in 85015
Limited Results Shown
Create a free account, or log in to reveal all property listings and enjoy the complete experience.

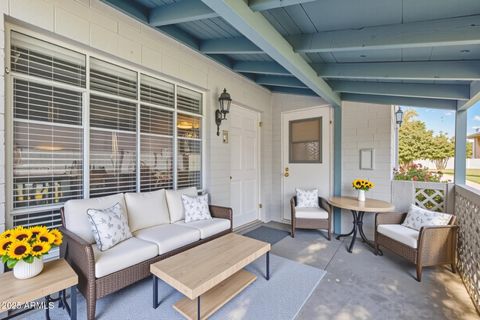
Active
$325,000
3
bds
|
3
ba
|
1,608
sqft
|
built
1967
4606 N 19th Ave, Phoenix, AZ 85015
$-581
Cash flow
-9.3%
Cash-on-Cash Return
3.5%
Cap rate
0.6%
Rent to Value Ratio
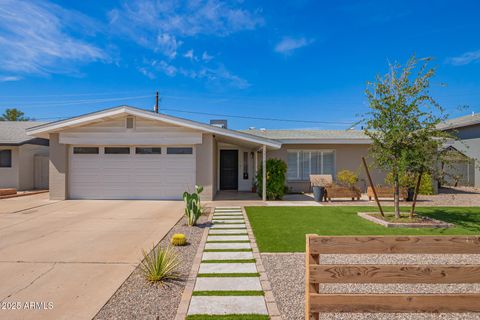
Active
$1,700,000
5
bds
|
4
ba
|
4,500
sqft
|
built
1953
6210 N 15th Ave, Phoenix, AZ 85015
$-5,581
Cash flow
-17.1%
Cash-on-Cash Return
1.7%
Cap rate
0.3%
Rent to Value Ratio
Active
$238,000
2
bds
|
1
ba
|
864
sqft
|
built
1954
2917 N 19th Ave, Phoenix, AZ 85015
$-254
Cash flow
-5.6%
Cash-on-Cash Return
4.4%
Cap rate
0.7%
Rent to Value Ratio
Active
$549,000
3
bds
|
2
ba
|
1,924
sqft
|
built
1967
2040 W Hazelwood St, Phoenix, AZ 85015
$-789
Cash flow
-7.5%
Cash-on-Cash Return
4.0%
Cap rate
0.5%
Rent to Value Ratio
Active
$447,990
3
bds
|
2
ba
|
1,331
sqft
|
built
1946
2027 W Medlock Dr, Phoenix, AZ 85015
$-1,018
Cash flow
-11.9%
Cash-on-Cash Return
3.0%
Cap rate
0.4%
Rent to Value Ratio
Active
$405,000
2
bds
|
1
ba
|
900
sqft
|
built
1948
1704 W Roma Ave, Phoenix, AZ 85015
$-587
Cash flow
-7.6%
Cash-on-Cash Return
3.9%
Cap rate
0.5%
Rent to Value Ratio

Active
$355,000
3
bds
|
2
ba
|
1,560
sqft
|
built
1970
1822 W Marlette Ave, Phoenix, AZ 85015
$-600
Cash flow
-8.8%
Cash-on-Cash Return
3.7%
Cap rate
0.6%
Rent to Value Ratio
Active
$900,000
6
bds
|
3
ba
|
2,396
sqft
|
built
1953
1611 W Osborn Rd, Phoenix, AZ 85015
$-2,448
Cash flow
-14.2%
Cash-on-Cash Return
2.4%
Cap rate
0.3%
Rent to Value Ratio
Active
$900,000
6
bds
|
3
ba
|
2,396
sqft
|
built
1953
1605 W Osborn Rd, Phoenix, AZ 85015
$-2,452
Cash flow
-14.2%
Cash-on-Cash Return
2.4%
Cap rate
0.3%
Rent to Value Ratio
Active
$624,999
3
bds
|
2
ba
|
2,160
sqft
|
built
1950
1639 W Indianola Ave, Phoenix, AZ 85015
$-706
Cash flow
-5.9%
Cash-on-Cash Return
4.3%
Cap rate
0.6%
Rent to Value Ratio
Active
$489,000
4
bds
|
3
ba
|
1,606
sqft
|
built
1954
1930 W Missouri Ave, Phoenix, AZ 85015
$-1,313
Cash flow
-14.0%
Cash-on-Cash Return
2.5%
Cap rate
0.3%
Rent to Value Ratio
Active
$650,000
4
bds
|
3
ba
|
2,387
sqft
|
built
1940
1720 W Elm St, Phoenix, AZ 85015
$-1,623
Cash flow
-13.0%
Cash-on-Cash Return
2.7%
Cap rate
0.4%
Rent to Value Ratio
Active
$340,000
2
bds
|
2
ba
|
1,371
sqft
|
built
1970
1726 W Claremont St, Phoenix, AZ 85015
$-659
Cash flow
-10.1%
Cash-on-Cash Return
3.4%
Cap rate
0.5%
Rent to Value Ratio
Active
$515,000
3
bds
|
2
ba
|
1,550
sqft
|
built
2022
3806 N 23rd Ave, Phoenix, AZ 85015
$-524
Cash flow
-5.3%
Cash-on-Cash Return
4.5%
Cap rate
0.6%
Rent to Value Ratio
Active
$534,900
4
bds
|
4
ba
|
1,884
sqft
|
built
1949
1644 W Roma Ave, Phoenix, AZ 85015
$-1,334
Cash flow
-13.0%
Cash-on-Cash Return
2.7%
Cap rate
0.4%
Rent to Value Ratio
Active
$314,500
2
bds
|
2
ba
|
1,251
sqft
|
built
1974
6207 N 21st Dr, Phoenix, AZ 85015
$-625
Cash flow
-10.4%
Cash-on-Cash Return
3.3%
Cap rate
0.6%
Rent to Value Ratio
Active
$719,900
bds
|
0
ba
|
0
sqft
|
built
1985
4701 N 23rd Dr, Phoenix, AZ 85015
$-2,240
Cash flow
-16.2%
Cash-on-Cash Return
1.9%
Cap rate
0.3%
Rent to Value Ratio
Active
$900,000
4
bds
|
4
ba
|
2,653
sqft
|
built
1950
3413 N 16th Dr, Phoenix, AZ 85015
$-1,763
Cash flow
-10.2%
Cash-on-Cash Return
3.3%
Cap rate
0.4%
Rent to Value Ratio
Active
$750,000
4
bds
|
2
ba
|
1,976
sqft
|
built
1941
2926 N 16th Ave, Phoenix, AZ 85015
$-2,258
Cash flow
-15.7%
Cash-on-Cash Return
2.1%
Cap rate
0.3%
Rent to Value Ratio

Active
$740,000
7
bds
|
6
ba
|
3,071
sqft
|
built
2019
5338 N 21st Ave, Phoenix, AZ 85015
$-824
Cash flow
-5.8%
Cash-on-Cash Return
4.3%
Cap rate
0.6%
Rent to Value Ratio
Active
$785,000
4
bds
|
4
ba
|
2,715
sqft
|
built
1952
4536 N 18th Dr, Phoenix, AZ 85015
$-1,782
Cash flow
-11.8%
Cash-on-Cash Return
3.0%
Cap rate
0.4%
Rent to Value Ratio
Active
$365,000
3
bds
|
2
ba
|
1,283
sqft
|
built
1979
2207 W Marlette Ave, Phoenix, AZ 85015
$-814
Cash flow
-11.6%
Cash-on-Cash Return
3.0%
Cap rate
0.5%
Rent to Value Ratio

Active
$310,000
3
bds
|
3
ba
|
1,450
sqft
|
built
2004
1718 W Colter St, Phoenix, AZ 85015
$-464
Cash flow
-7.8%
Cash-on-Cash Return
3.9%
Cap rate
0.6%
Rent to Value Ratio
Active
$488,000
bds
|
0
ba
|
0
sqft
|
built
1957
2039 W Pasadena Ave, Phoenix, AZ 85015
$-1,424
Cash flow
-15.2%
Cash-on-Cash Return
2.2%
Cap rate
0.3%
Rent to Value Ratio
Active
$700,000
bds
|
0
ba
|
0
sqft
|
built
2009
2107 W Glenrosa Ave, Phoenix, AZ 85015
$-2,294
Cash flow
-17.1%
Cash-on-Cash Return
1.7%
Cap rate
0.2%
Rent to Value Ratio
Active
$590,000
3
bds
|
3
ba
|
2,171
sqft
|
built
1951
2938 N 18th Ave, Phoenix, AZ 85015
$-1,109
Cash flow
-9.8%
Cash-on-Cash Return
3.4%
Cap rate
0.5%
Rent to Value Ratio
Active
$1,200,000
bds
|
0
ba
|
0
sqft
|
built
1966
3630 N 15th Ave, Phoenix, AZ 85015
$-4,055
Cash flow
-17.6%
Cash-on-Cash Return
1.6%
Cap rate
0.2%
Rent to Value Ratio
Active
$179,990
2
bds
|
1
ba
|
863
sqft
|
built
1985
1702 W Tuckey Ln, Phoenix, AZ 85015
$-353
Cash flow
-10.2%
Cash-on-Cash Return
3.3%
Cap rate
0.7%
Rent to Value Ratio
Active
$239,900
3
bds
|
2
ba
|
1,408
sqft
|
built
1965
1673 W Hazelwood St, Phoenix, AZ 85015
$-218
Cash flow
-4.7%
Cash-on-Cash Return
4.6%
Cap rate
0.7%
Rent to Value Ratio
Active
$347,400
3
bds
|
2
ba
|
1,583
sqft
|
built
1950
1934 W Colter St, Phoenix, AZ 85015
$-482
Cash flow
-7.2%
Cash-on-Cash Return
4.0%
Cap rate
0.5%
Rent to Value Ratio
Active
$299,900
2
bds
|
2
ba
|
1,195
sqft
|
built
1979
5217 N 18th Dr, Phoenix, AZ 85015
$-402
Cash flow
-7.0%
Cash-on-Cash Return
4.1%
Cap rate
0.6%
Rent to Value Ratio
Active
$499,000
3
bds
|
2
ba
|
1,472
sqft
|
built
1950
2139 W Whitton Ave, Phoenix, AZ 85015
$-1,086
Cash flow
-11.4%
Cash-on-Cash Return
3.1%
Cap rate
0.4%
Rent to Value Ratio
Active
$370,000
3
bds
|
2
ba
|
988
sqft
|
built
1954
4714 N 23rd Ave, Phoenix, AZ 85015
$-683
Cash flow
-9.6%
Cash-on-Cash Return
3.5%
Cap rate
0.4%
Rent to Value Ratio
Active
$499,000
4
bds
|
3
ba
|
2,140
sqft
|
built
1949
1749 W Monterosa St, Phoenix, AZ 85015
$-294
Cash flow
-3.1%
Cash-on-Cash Return
5.0%
Cap rate
0.6%
Rent to Value Ratio
Active
$1,200,000
bds
|
0
ba
|
0
sqft
|
built
1947
1734 W Glenrosa Ave, Phoenix, AZ 85015
$-4,931
Cash flow
-21.4%
Cash-on-Cash Return
0.7%
Cap rate
0.1%
Rent to Value Ratio
Active
$725,000
bds
|
0
ba
|
0
sqft
|
built
1957
2019 W Turney Ave, Phoenix, AZ 85015
$-2,179
Cash flow
-15.7%
Cash-on-Cash Return
2.1%
Cap rate
0.3%
Rent to Value Ratio

Active
$410,000
2
bds
|
1
ba
|
936
sqft
|
built
1950
2221 W Mitchell Dr, Phoenix, AZ 85015
$-813
Cash flow
-10.3%
Cash-on-Cash Return
3.3%
Cap rate
0.4%
Rent to Value Ratio
Active
$299,900
4
bds
|
3
ba
|
1,584
sqft
|
built
1965
1552 W Campbell Ave, Phoenix, AZ 85015
$-335
Cash flow
-5.8%
Cash-on-Cash Return
4.3%
Cap rate
0.7%
Rent to Value Ratio