85016 Investment Properties for Sale
Browse homes for sale and investment properties in 85016. Refine your search by price, property type, or more.
Best cash flowing properties in 85016
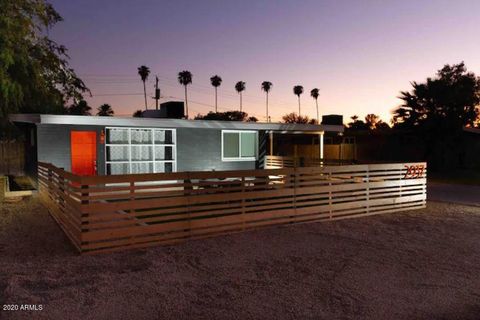
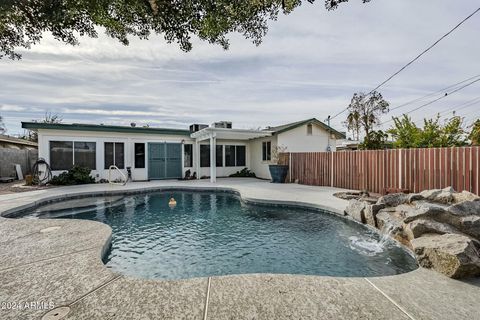
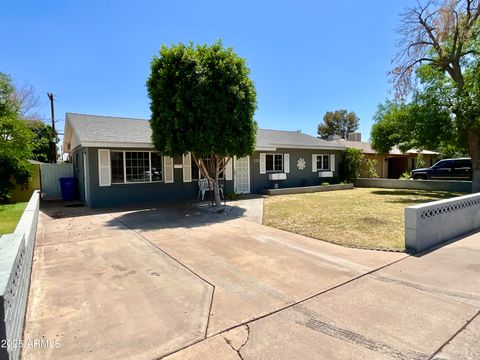
Closed
$409,900
3
bds
|
3
ba
|
1,564
sqft
|
built
1953
2937 E Osborn Rd, Phoenix, AZ 85016
$-185
Cash flow
-2.4%
Cash-on-Cash Return
5.7%
Cap rate
0.8%
Rent to Value Ratio
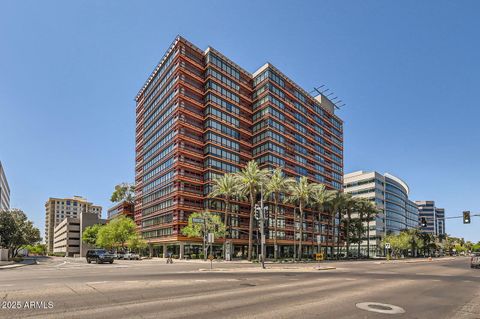
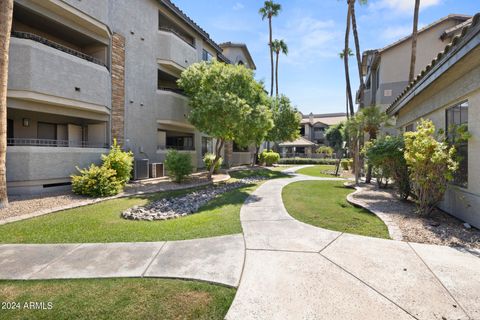
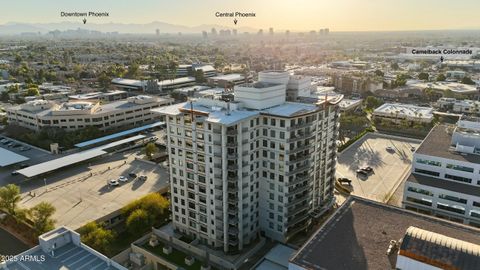
Active
$724,900
2
bds
|
2
ba
|
1,356
sqft
|
built
2006
4808 N 24th St, Phoenix, AZ 85016
$-364
Cash flow
-2.6%
Cash-on-Cash Return
5.7%
Cap rate
1.0%
Rent to Value Ratio
194 out of 208 properties for sale in 85016
Limited Results Shown
Create a free account, or log in to reveal all property listings and enjoy the complete experience.

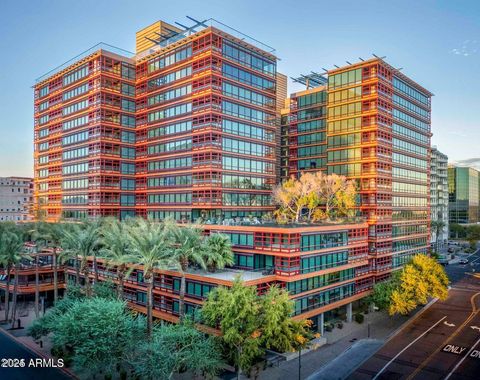
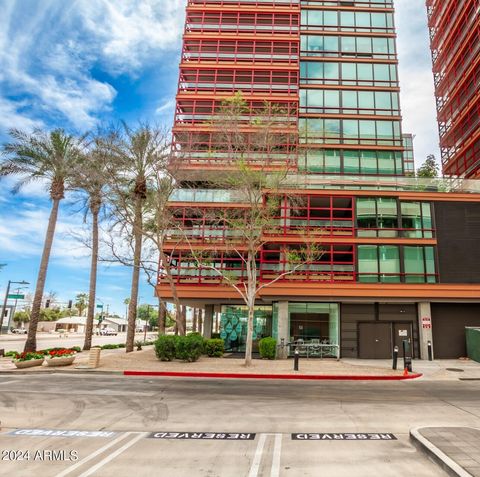
Active
$535,000
3
bds
|
2
ba
|
1,212
sqft
|
built
1948
2336 E Flower St, Phoenix, AZ 85016
$-912
Cash flow
-8.9%
Cash-on-Cash Return
4.2%
Cap rate
0.5%
Rent to Value Ratio
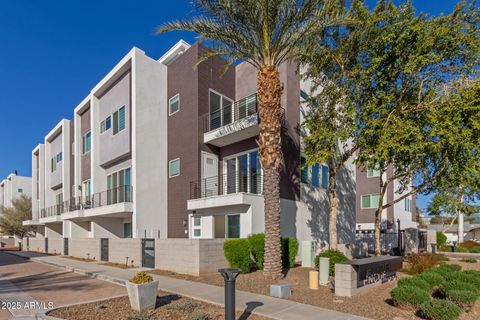
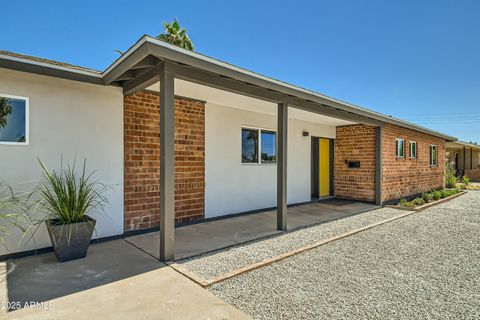
Active
$499,000
2
bds
|
2
ba
|
1,211
sqft
|
built
2006
4808 N 24th St, Phoenix, AZ 85016
$-1,513
Cash flow
-15.8%
Cash-on-Cash Return
2.6%
Cap rate
0.6%
Rent to Value Ratio
Active
$615,000
2
bds
|
3
ba
|
1,673
sqft
|
built
2019
4444 N 25th St, Phoenix, AZ 85016
$-1,383
Cash flow
-11.7%
Cash-on-Cash Return
3.6%
Cap rate
0.6%
Rent to Value Ratio

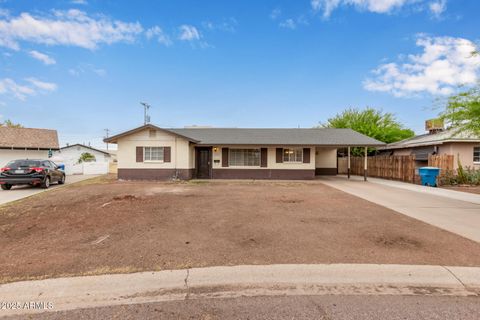
Active
$350,000
3
bds
|
2
ba
|
1,408
sqft
|
built
1966
3828 N 30th St, Phoenix, AZ 85016
$-919
Cash flow
-13.7%
Cash-on-Cash Return
3.1%
Cap rate
0.6%
Rent to Value Ratio

Active
$950,000
2
bds
|
3
ba
|
1,835
sqft
|
built
1981
5122 N 31st Way, Phoenix, AZ 85016
$-3,362
Cash flow
-18.5%
Cash-on-Cash Return
2.0%
Cap rate
0.5%
Rent to Value Ratio
Active
$599,000
3
bds
|
2
ba
|
2,084
sqft
|
built
1953
2124 E Osborn Rd, Phoenix, AZ 85016
$-1,156
Cash flow
-10.1%
Cash-on-Cash Return
3.9%
Cap rate
0.5%
Rent to Value Ratio
Closed
$409,900
3
bds
|
3
ba
|
1,564
sqft
|
built
1953
2937 E Osborn Rd, Phoenix, AZ 85016
$-185
Cash flow
-2.4%
Cash-on-Cash Return
5.7%
Cap rate
0.8%
Rent to Value Ratio
Active
$220,000
1
bds
|
1
ba
|
665
sqft
|
built
1989
2025 E Campbell Ave, Phoenix, AZ 85016
$-473
Cash flow
-11.2%
Cash-on-Cash Return
3.7%
Cap rate
0.6%
Rent to Value Ratio
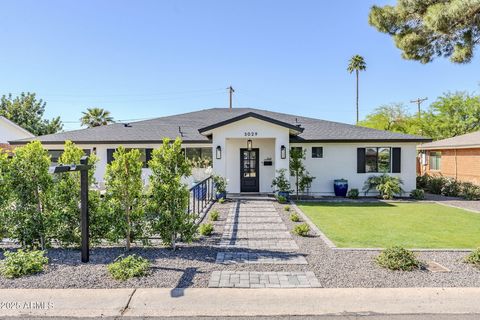
Active
$1,325,000
4
bds
|
4
ba
|
2,778
sqft
|
built
1954
3029 E Elm St, Phoenix, AZ 85016
$-1,805
Cash flow
-7.1%
Cash-on-Cash Return
4.6%
Cap rate
0.6%
Rent to Value Ratio

Active
$1,175,000
2
bds
|
3
ba
|
2,150
sqft
|
built
2022
1740 E Ocotillo Rd, Phoenix, AZ 85016
$-3,820
Cash flow
-17.0%
Cash-on-Cash Return
2.4%
Cap rate
0.4%
Rent to Value Ratio
Active
$455,000
3
bds
|
2
ba
|
1,556
sqft
|
built
1956
2022 E Mulberry Dr, Phoenix, AZ 85016
$-1,149
Cash flow
-13.2%
Cash-on-Cash Return
3.2%
Cap rate
0.5%
Rent to Value Ratio
Active
$310,000
1
bds
|
1
ba
|
850
sqft
|
built
1997
4644 N 22nd St, Phoenix, AZ 85016
$-857
Cash flow
-14.4%
Cash-on-Cash Return
2.9%
Cap rate
0.5%
Rent to Value Ratio
Active
$464,000
2
bds
|
2
ba
|
1,063
sqft
|
built
2013
5550 N 16th St, Phoenix, AZ 85016
$-1,361
Cash flow
-15.3%
Cash-on-Cash Return
2.7%
Cap rate
0.5%
Rent to Value Ratio
Active
$724,900
2
bds
|
2
ba
|
1,356
sqft
|
built
2006
4808 N 24th St, Phoenix, AZ 85016
$-364
Cash flow
-2.6%
Cash-on-Cash Return
5.7%
Cap rate
1.0%
Rent to Value Ratio
Active
$1,895,000
2
bds
|
3
ba
|
3,000
sqft
|
built
2006
2211 E Camelback Rd, Phoenix, AZ 85016
$-9,160
Cash flow
-25.2%
Cash-on-Cash Return
0.5%
Cap rate
0.3%
Rent to Value Ratio

Active
$3,895,000
4
bds
|
4
ba
|
5,208
sqft
|
built
1995
6602 N Arizona Biltmore Cir, Phoenix, AZ 85016
$-16,151
Cash flow
-21.6%
Cash-on-Cash Return
1.3%
Cap rate
0.2%
Rent to Value Ratio
Active
$275,000
1
bds
|
1
ba
|
680
sqft
|
built
1964
4419 N 27th St, Phoenix, AZ 85016
$-803
Cash flow
-15.2%
Cash-on-Cash Return
2.8%
Cap rate
0.6%
Rent to Value Ratio
Active
$530,000
4
bds
|
2
ba
|
1,565
sqft
|
built
1955
2537 E Hazelwood St, Phoenix, AZ 85016
$-1,264
Cash flow
-12.4%
Cash-on-Cash Return
3.4%
Cap rate
0.5%
Rent to Value Ratio
Active
$999,450
2
bds
|
2
ba
|
2,074
sqft
|
built
2006
2211 E Camelback Rd, Phoenix, AZ 85016
$-2,666
Cash flow
-13.9%
Cash-on-Cash Return
3.1%
Cap rate
0.7%
Rent to Value Ratio
Active
$548,500
2
bds
|
2
ba
|
1,361
sqft
|
built
2006
4808 N 24th St, Phoenix, AZ 85016
$-2,039
Cash flow
-19.4%
Cash-on-Cash Return
1.8%
Cap rate
0.5%
Rent to Value Ratio
Active
$1,000,000
4
bds
|
3
ba
|
1,924
sqft
|
built
1953
1930 E Missouri Ave, Phoenix, AZ 85016
$-2,719
Cash flow
-14.2%
Cash-on-Cash Return
3.0%
Cap rate
0.4%
Rent to Value Ratio
Active
$1,495,000
3
bds
|
3
ba
|
2,419
sqft
|
built
2016
4519 N 29th Way, Phoenix, AZ 85016
$-5,456
Cash flow
-19.0%
Cash-on-Cash Return
1.9%
Cap rate
0.3%
Rent to Value Ratio

Active
$875,000
4
bds
|
3
ba
|
2,425
sqft
|
built
1967
2234 E Lawrence Rd, Phoenix, AZ 85016
$-2,498
Cash flow
-14.9%
Cash-on-Cash Return
2.8%
Cap rate
0.4%
Rent to Value Ratio
Active
$350,000
1
bds
|
1
ba
|
871
sqft
|
built
2006
4808 N 24th St, Phoenix, AZ 85016
$-1,585
Cash flow
-23.6%
Cash-on-Cash Return
0.8%
Cap rate
0.5%
Rent to Value Ratio
Active
$868,250
3
bds
|
3
ba
|
1,620
sqft
|
built
1954
2509 E Meadowbrook Ave, Phoenix, AZ 85016
$-3,060
Cash flow
-18.4%
Cash-on-Cash Return
2.0%
Cap rate
0.3%
Rent to Value Ratio

Active
$775,000
3
bds
|
2
ba
|
1,908
sqft
|
built
1973
4400 N 20th St, Phoenix, AZ 85016
$-2,876
Cash flow
-19.4%
Cash-on-Cash Return
1.8%
Cap rate
0.3%
Rent to Value Ratio

Active
$389,000
3
bds
|
2
ba
|
1,835
sqft
|
built
1981
5132 N 31st Way, Phoenix, AZ 85016
$-1,338
Cash flow
-17.9%
Cash-on-Cash Return
2.1%
Cap rate
0.8%
Rent to Value Ratio
Active
$600,000
2
bds
|
2
ba
|
1,450
sqft
|
built
2006
4808 N 24th St, Phoenix, AZ 85016
$-2,665
Cash flow
-23.2%
Cash-on-Cash Return
0.9%
Cap rate
0.4%
Rent to Value Ratio
Active
$335,000
2
bds
|
2
ba
|
1,224
sqft
|
built
1981
5102 N 31st Pl, Phoenix, AZ 85016
$-1,280
Cash flow
-19.9%
Cash-on-Cash Return
1.7%
Cap rate
0.6%
Rent to Value Ratio
Active
$1,175,000
3
bds
|
3
ba
|
2,256
sqft
|
built
2022
1740 E Ocotillo Rd, Phoenix, AZ 85016
$-3,665
Cash flow
-16.3%
Cash-on-Cash Return
2.5%
Cap rate
0.4%
Rent to Value Ratio
Active under contract
$399,900
2
bds
|
2
ba
|
1,089
sqft
|
built
2006
4808 N 24th St, Phoenix, AZ 85016
$-1,061
Cash flow
-13.8%
Cash-on-Cash Return
3.1%
Cap rate
0.7%
Rent to Value Ratio
Closed
$973,999
4
bds
|
2
ba
|
2,351
sqft
|
built
1961
6127 N 16th Pl, Phoenix, AZ 85016
$-1,875
Cash flow
-10.0%
Cash-on-Cash Return
4.0%
Cap rate
0.5%
Rent to Value Ratio

Active
$425,000
3
bds
|
3
ba
|
1,702
sqft
|
built
2006
2241 E Pinchot Ave, Phoenix, AZ 85016
$-1,249
Cash flow
-15.3%
Cash-on-Cash Return
2.7%
Cap rate
0.5%
Rent to Value Ratio
Active
$499,000
4
bds
|
2
ba
|
1,423
sqft
|
built
1950
2913 E Earll Dr, Phoenix, AZ 85016
$-1,273
Cash flow
-13.3%
Cash-on-Cash Return
3.2%
Cap rate
0.4%
Rent to Value Ratio
Active
$285,000
2
bds
|
2
ba
|
790
sqft
|
built
2003
1701 E Colter St, Phoenix, AZ 85016
$-728
Cash flow
-13.3%
Cash-on-Cash Return
3.2%
Cap rate
0.6%
Rent to Value Ratio
Active
$399,950
3
bds
|
2
ba
|
1,134
sqft
|
built
1948
1840 E Clarendon Ave, Phoenix, AZ 85016
$-501
Cash flow
-6.5%
Cash-on-Cash Return
4.8%
Cap rate
0.6%
Rent to Value Ratio

Active
$660,000
4
bds
|
3
ba
|
2,132
sqft
|
built
1954
1807 E Medlock Dr, Phoenix, AZ 85016
$-1,327
Cash flow
-10.5%
Cash-on-Cash Return
3.9%
Cap rate
0.5%
Rent to Value Ratio
Active
$925,000
4
bds
|
2
ba
|
2,348
sqft
|
built
1955
3034 E Turney Ave, Phoenix, AZ 85016
$-2,697
Cash flow
-15.2%
Cash-on-Cash Return
2.8%
Cap rate
0.4%
Rent to Value Ratio
Active under contract
$305,000
2
bds
|
2
ba
|
935
sqft
|
built
2003
1701 E Colter St, Phoenix, AZ 85016
$-595
Cash flow
-10.2%
Cash-on-Cash Return
3.9%
Cap rate
0.7%
Rent to Value Ratio
Active
$575,000
4
bds
|
2
ba
|
2,103
sqft
|
built
1947
4216 N 20th St, Phoenix, AZ 85016
$-496
Cash flow
-4.5%
Cash-on-Cash Return
5.2%
Cap rate
0.7%
Rent to Value Ratio