85016 Investment Properties for Sale
Browse homes for sale and investment properties in 85016. Refine your search by price, property type, or more.
Best cash flowing properties in 85016
Active
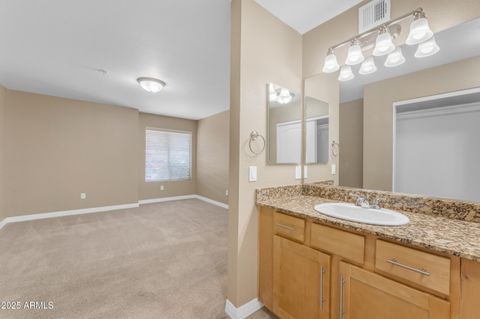
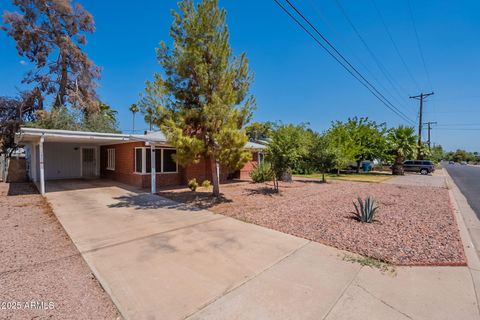
$289,500
2
bds
|
2
ba
|
1,006
sqft
|
built
1989
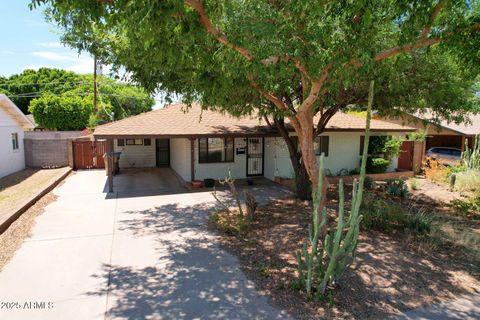
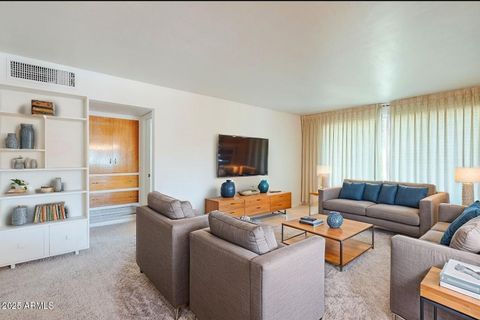
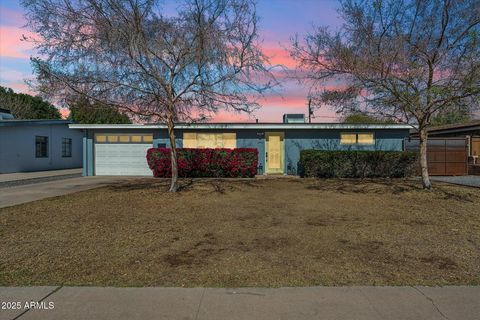
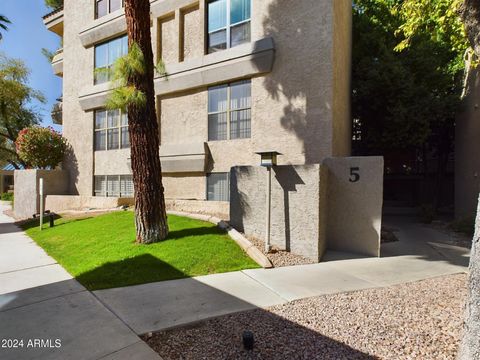
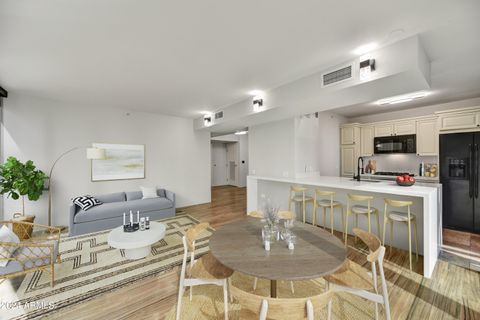
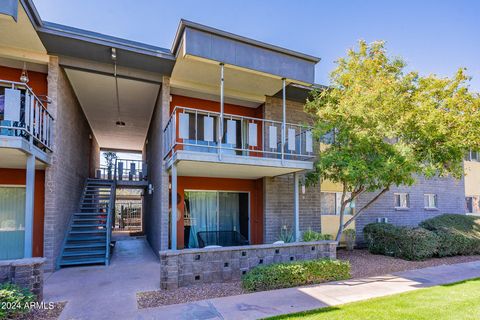
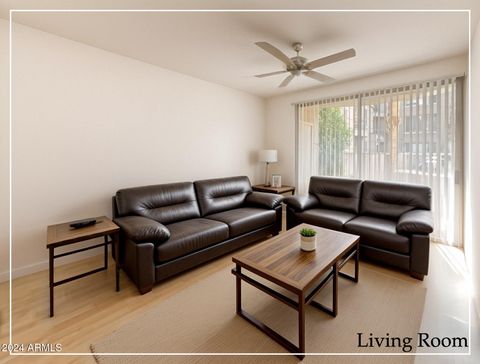
2025 E Campbell Ave, Phoenix, AZ 85016
$-318
Cash flow
-5.7%
Cash-on-Cash Return
4.4%
Cap rate
0.7%
Rent to Value Ratio

Active
$299,000
1
bds
|
1
ba
|
801
sqft
|
built
2003
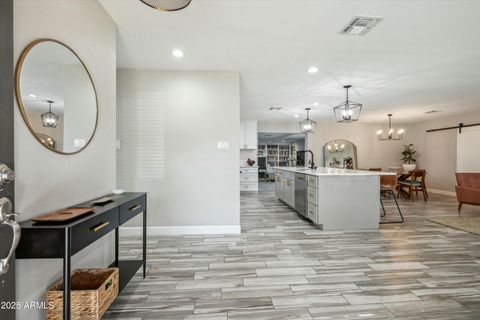
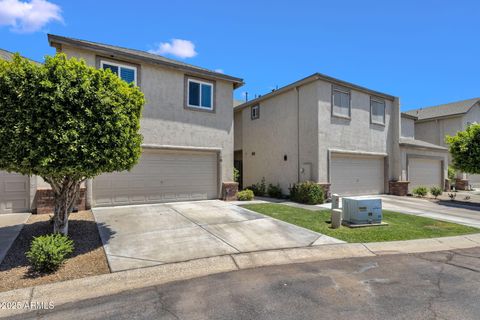
1701 E Colter St, Phoenix, AZ 85016
$-554
Cash flow
-9.7%
Cash-on-Cash Return
3.5%
Cap rate
0.6%
Rent to Value Ratio
120 out of 135 properties for sale in 85016
Limited Results Shown
Create a free account, or log in to reveal all property listings and enjoy the complete experience.
Active
$525,000
2
bds
|
3
ba
|
1,374
sqft
|
built
1986
4225 N 21st St, Phoenix, AZ 85016
$-1,089
Cash flow
-10.8%
Cash-on-Cash Return
3.2%
Cap rate
0.5%
Rent to Value Ratio

Active
$389,000
1
bds
|
1
ba
|
1,008
sqft
|
built
2006
4808 N 24th St, Phoenix, AZ 85016
$-903
Cash flow
-12.1%
Cash-on-Cash Return
2.9%
Cap rate
0.7%
Rent to Value Ratio
Active
$314,000
2
bds
|
1
ba
|
910
sqft
|
built
1964
4419 N 27th St, Phoenix, AZ 85016
$-592
Cash flow
-9.8%
Cash-on-Cash Return
3.4%
Cap rate
0.6%
Rent to Value Ratio
Active
$650,000
4
bds
|
2
ba
|
2,273
sqft
|
built
1949
1725 E Catalina Dr, Phoenix, AZ 85016
$-1,118
Cash flow
-9.0%
Cash-on-Cash Return
3.6%
Cap rate
0.5%
Rent to Value Ratio
Active
$735,000
3
bds
|
3
ba
|
1,808
sqft
|
built
1949
4210 N 20th St, Phoenix, AZ 85016
$-1,487
Cash flow
-10.6%
Cash-on-Cash Return
3.3%
Cap rate
0.4%
Rent to Value Ratio
Active
$699,900
3
bds
|
2
ba
|
2,295
sqft
|
built
1956
2623 E Pierson St, Phoenix, AZ 85016
$-1,583
Cash flow
-11.8%
Cash-on-Cash Return
3.0%
Cap rate
0.4%
Rent to Value Ratio
Active
$505,000
2
bds
|
2
ba
|
1,089
sqft
|
built
2006
4808 N 24th St, Phoenix, AZ 85016
$-1,514
Cash flow
-15.6%
Cash-on-Cash Return
2.1%
Cap rate
0.6%
Rent to Value Ratio
Active
$500,000
3
bds
|
2
ba
|
1,110
sqft
|
built
1954
2531 E Indianola Ave, Phoenix, AZ 85016
$-671
Cash flow
-7.0%
Cash-on-Cash Return
4.1%
Cap rate
0.5%
Rent to Value Ratio
Active
$269,000
2
bds
|
1
ba
|
783
sqft
|
built
1975
6739 N 16th St, Phoenix, AZ 85016
$-555
Cash flow
-10.8%
Cash-on-Cash Return
3.2%
Cap rate
0.5%
Rent to Value Ratio
Active
$617,500
3
bds
|
2
ba
|
1,884
sqft
|
built
1947
3018 E Mulberry Dr, Phoenix, AZ 85016
$-1,180
Cash flow
-10.0%
Cash-on-Cash Return
3.4%
Cap rate
0.5%
Rent to Value Ratio
Active
$734,000
3
bds
|
2
ba
|
1,847
sqft
|
built
1949
2518 E Flower St, Phoenix, AZ 85016
$-1,270
Cash flow
-9.0%
Cash-on-Cash Return
3.6%
Cap rate
0.5%
Rent to Value Ratio
Active
$479,900
2
bds
|
1
ba
|
875
sqft
|
built
1953
2223 E Roma Ave, Phoenix, AZ 85016
$-1,177
Cash flow
-12.8%
Cash-on-Cash Return
2.7%
Cap rate
0.4%
Rent to Value Ratio
Active
$3,150,000
3
bds
|
4
ba
|
3,196
sqft
|
built
1986
3186 E Stella Ln, Phoenix, AZ 85016
$-13,200
Cash flow
-21.9%
Cash-on-Cash Return
0.7%
Cap rate
0.1%
Rent to Value Ratio

Active
$744,900
2
bds
|
2
ba
|
1,407
sqft
|
built
1981
2413 E Rancho Dr, Phoenix, AZ 85016
$-2,414
Cash flow
-16.9%
Cash-on-Cash Return
1.8%
Cap rate
0.4%
Rent to Value Ratio
Active
$530,000
4
bds
|
3
ba
|
2,303
sqft
|
built
1950
3115 N 26th St, Phoenix, AZ 85016
$-931
Cash flow
-9.2%
Cash-on-Cash Return
3.6%
Cap rate
0.5%
Rent to Value Ratio
Active
$325,000
2
bds
|
1
ba
|
797
sqft
|
built
1970
1850 E Maryland Ave, Phoenix, AZ 85016
$-785
Cash flow
-12.6%
Cash-on-Cash Return
2.8%
Cap rate
0.6%
Rent to Value Ratio
Active
$6,700,000
6
bds
|
9
ba
|
7,403
sqft
|
built
1970
2311 E Colter St, Phoenix, AZ 85016
$-28,367
Cash flow
-22.1%
Cash-on-Cash Return
0.6%
Cap rate
0.1%
Rent to Value Ratio
Active
$4,200,000
4
bds
|
6
ba
|
6,538
sqft
|
built
2000
6621 N Arizona Biltmore Cir, Phoenix, AZ 85016
$-17,890
Cash flow
-22.2%
Cash-on-Cash Return
0.6%
Cap rate
0.2%
Rent to Value Ratio
Active
$675,000
3
bds
|
2
ba
|
1,677
sqft
|
built
1952
1945 E Solano Dr, Phoenix, AZ 85016
$-1,586
Cash flow
-12.3%
Cash-on-Cash Return
2.9%
Cap rate
0.4%
Rent to Value Ratio
Active
$3,175,000
3
bds
|
4
ba
|
4,000
sqft
|
built
2006
2211 E Camelback Rd, Phoenix, AZ 85016
$-13,227
Cash flow
-21.7%
Cash-on-Cash Return
0.7%
Cap rate
0.3%
Rent to Value Ratio
Active
$495,000
3
bds
|
1
ba
|
1,325
sqft
|
built
1953
2213 E Campbell Ave, Phoenix, AZ 85016
$-1,067
Cash flow
-11.2%
Cash-on-Cash Return
3.1%
Cap rate
0.4%
Rent to Value Ratio

Active
$560,000
3
bds
|
3
ba
|
1,717
sqft
|
built
1948
2511 E Pinchot Ave, Phoenix, AZ 85016
$-1,222
Cash flow
-11.4%
Cash-on-Cash Return
3.1%
Cap rate
0.4%
Rent to Value Ratio
Active
$1,600,000
2
bds
|
2
ba
|
2,077
sqft
|
built
2006
2211 E Camelback Rd, Phoenix, AZ 85016
$-6,204
Cash flow
-20.2%
Cash-on-Cash Return
1.0%
Cap rate
0.4%
Rent to Value Ratio

Active
$663,000
4
bds
|
3
ba
|
2,062
sqft
|
built
1947
2202 E Osborn Rd, Phoenix, AZ 85016
$-1,926
Cash flow
-15.2%
Cash-on-Cash Return
2.2%
Cap rate
0.3%
Rent to Value Ratio
Active
$425,000
2
bds
|
1
ba
|
1,192
sqft
|
built
1950
2540 E Amelia Ave, Phoenix, AZ 85016
$-622
Cash flow
-7.6%
Cash-on-Cash Return
3.9%
Cap rate
0.5%
Rent to Value Ratio
Active
$699,900
3
bds
|
2
ba
|
2,187
sqft
|
built
1956
1632 E Maryland Ave, Phoenix, AZ 85016
$-814
Cash flow
-6.1%
Cash-on-Cash Return
4.3%
Cap rate
0.6%
Rent to Value Ratio
Active
$1,379,000
3
bds
|
3
ba
|
3,000
sqft
|
built
2006
2211 E Camelback Rd, Phoenix, AZ 85016
$-5,366
Cash flow
-20.3%
Cash-on-Cash Return
1.0%
Cap rate
0.5%
Rent to Value Ratio
Active
$6,850,000
7
bds
|
10
ba
|
13,366
sqft
|
built
1997
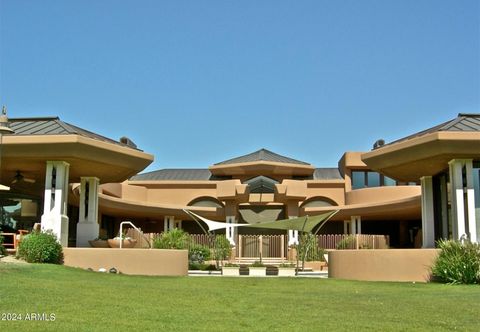
15 Biltmore Est, Phoenix, AZ 85016
$-29,713
Cash flow
-22.6%
Cash-on-Cash Return
0.5%
Cap rate
0.2%
Rent to Value Ratio
Active
$349,950
2
bds
|
2
ba
|
1,224
sqft
|
built
1981
5124 N 31st Pl, Phoenix, AZ 85016
$-830
Cash flow
-12.4%
Cash-on-Cash Return
2.8%
Cap rate
0.7%
Rent to Value Ratio

Active
$1,150,000
3
bds
|
4
ba
|
2,679
sqft
|
built
2006
4808 N 24th St, Phoenix, AZ 85016
$-3,905
Cash flow
-17.7%
Cash-on-Cash Return
1.6%
Cap rate
0.6%
Rent to Value Ratio
Active
$419,000
1
bds
|
1
ba
|
898
sqft
|
built
2006
4808 N 24th St, Phoenix, AZ 85016
$-919
Cash flow
-11.4%
Cash-on-Cash Return
3.0%
Cap rate
0.6%
Rent to Value Ratio

Active
$580,000
3
bds
|
3
ba
|
2,157
sqft
|
built
1964
2518 E Osborn Rd, Phoenix, AZ 85016
$-1,232
Cash flow
-11.1%
Cash-on-Cash Return
3.1%
Cap rate
0.5%
Rent to Value Ratio

Active
$305,000
2
bds
|
2
ba
|
997
sqft
|
built
1975
3807 N 30th St, Phoenix, AZ 85016
$-667
Cash flow
-11.4%
Cash-on-Cash Return
3.1%
Cap rate
0.6%
Rent to Value Ratio
Active
$497,500
3
bds
|
3
ba
|
1,735
sqft
|
built
2001
4301 N 21st St, Phoenix, AZ 85016
$-1,400
Cash flow
-14.7%
Cash-on-Cash Return
2.3%
Cap rate
0.5%
Rent to Value Ratio
Active
$529,000
3
bds
|
2
ba
|
1,187
sqft
|
built
1947
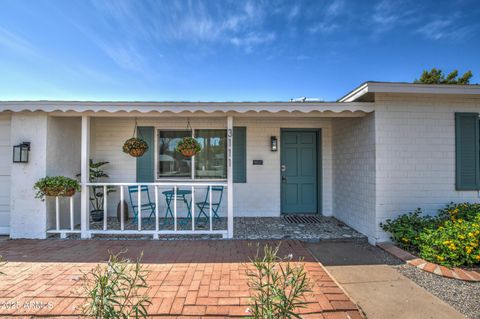
3111 E Mulberry Dr, Phoenix, AZ 85016
$-1,107
Cash flow
-10.9%
Cash-on-Cash Return
3.2%
Cap rate
0.4%
Rent to Value Ratio
Active
$319,990
2
bds
|
2
ba
|
1,167
sqft
|
built
1964
1630 E Georgia Ave, Phoenix, AZ 85016
$-708
Cash flow
-11.5%
Cash-on-Cash Return
3.0%
Cap rate
0.6%
Rent to Value Ratio
Active
$410,000
2
bds
|
2
ba
|
999
sqft
|
built
2003
1701 E Colter St, Phoenix, AZ 85016
$-844
Cash flow
-10.7%
Cash-on-Cash Return
3.2%
Cap rate
0.5%
Rent to Value Ratio
Active
$799,995
3
bds
|
4
ba
|
2,438
sqft
|
built
1963
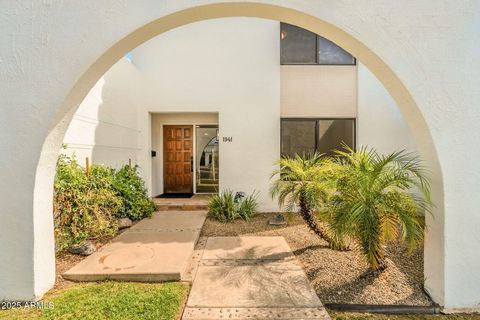
1941 E Medlock Dr, Phoenix, AZ 85016
$-1,940
Cash flow
-12.7%
Cash-on-Cash Return
2.8%
Cap rate
0.5%
Rent to Value Ratio