85016 Investment Properties for Sale
Browse homes for sale and investment properties in 85016. Refine your search by price, property type, or more.
Best cash flowing properties in 85016

Active
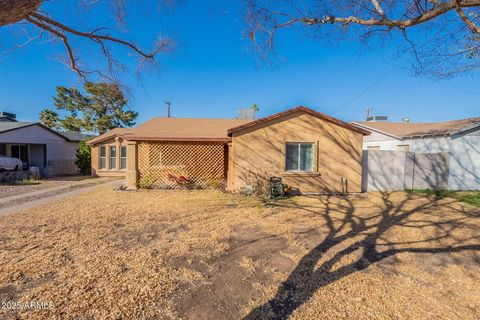
$250,000
2
bds
|
1
ba
|
951
sqft
|
built
1989
2025 E Campbell Ave, Phoenix, AZ 85016
$-233
Cash flow
-4.9%
Cash-on-Cash Return
5.1%
Cap rate
0.8%
Rent to Value Ratio
Active
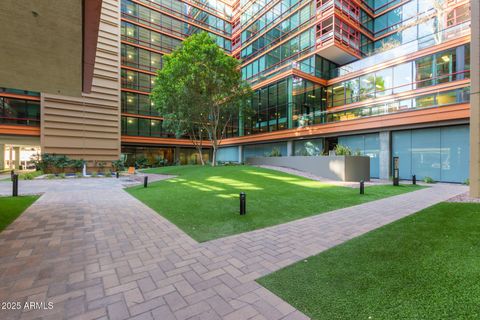
$199,000
1
bds
|
1
ba
|
847
sqft
|
built
1984
4141 N 31st St, Phoenix, AZ 85016
$-367
Cash flow
-9.6%
Cash-on-Cash Return
4.1%
Cap rate
0.8%
Rent to Value Ratio
194 out of 208 properties for sale in 85016
Limited Results Shown
Create a free account, or log in to reveal all property listings and enjoy the complete experience.
Active
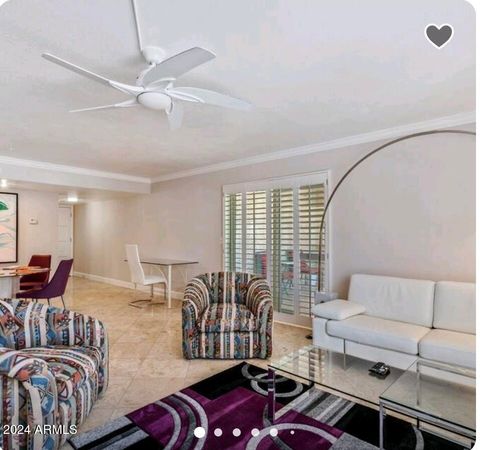
$839,000
4
bds
|
2
ba
|
2,148
sqft
|
built
1957
1744 E Luke Ave, Phoenix, AZ 85016
$-1,886
Cash flow
-11.7%
Cash-on-Cash Return
3.6%
Cap rate
0.5%
Rent to Value Ratio
Active
$199,000
1
bds
|
1
ba
|
847
sqft
|
built
1984
4141 N 31st St, Phoenix, AZ 85016
$-367
Cash flow
-9.6%
Cash-on-Cash Return
4.1%
Cap rate
0.8%
Rent to Value Ratio
Active
$1,550,000
3
bds
|
3
ba
|
2,653
sqft
|
built
1995
3120 E Piestewa Peak Cir, Phoenix, AZ 85016
$-5,972
Cash flow
-20.1%
Cash-on-Cash Return
1.6%
Cap rate
0.3%
Rent to Value Ratio

Active
$3,125,000
3
bds
|
3
ba
|
3,350
sqft
|
built
2002
2402 E Esplanade Ln, Phoenix, AZ 85016
$-14,500
Cash flow
-24.2%
Cash-on-Cash Return
0.7%
Cap rate
0.3%
Rent to Value Ratio
Active
$1,499,000
4
bds
|
5
ba
|
3,208
sqft
|
built
2015
2926 E Minnezona Ave, Phoenix, AZ 85016
$-5,314
Cash flow
-18.5%
Cash-on-Cash Return
2.0%
Cap rate
0.3%
Rent to Value Ratio
Active
$290,000
1
bds
|
1
ba
|
735
sqft
|
built
1998
4343 N 21st St, Phoenix, AZ 85016
$-964
Cash flow
-17.3%
Cash-on-Cash Return
2.3%
Cap rate
0.5%
Rent to Value Ratio
Active
$525,000
1
bds
|
2
ba
|
1,008
sqft
|
built
2017
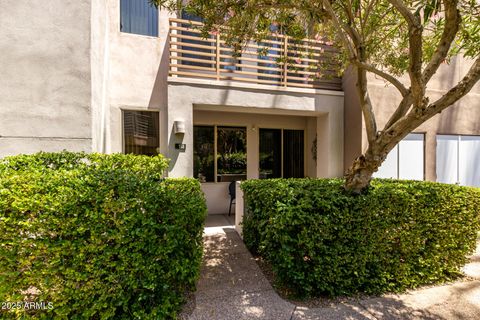
2300 E Campbell Ave, Phoenix, AZ 85016
$-1,258
Cash flow
-12.5%
Cash-on-Cash Return
3.4%
Cap rate
0.6%
Rent to Value Ratio
Active
$2,150,000
5
bds
|
5
ba
|
4,469
sqft
|
built
1980
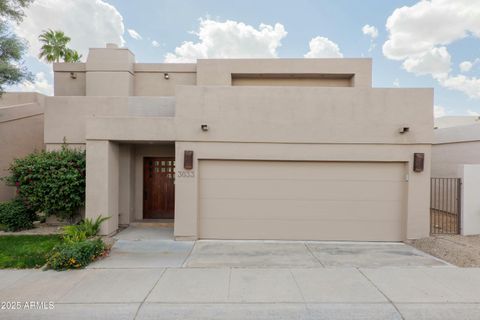
3033 E Claremont Ave, Phoenix, AZ 85016
$-8,557
Cash flow
-20.8%
Cash-on-Cash Return
1.5%
Cap rate
0.3%
Rent to Value Ratio
Active
$830,000
4
bds
|
2
ba
|
2,220
sqft
|
built
1958
2301 E Osborn Rd, Phoenix, AZ 85016
$-944
Cash flow
-5.9%
Cash-on-Cash Return
4.9%
Cap rate
0.6%
Rent to Value Ratio
Active
$489,000
2
bds
|
3
ba
|
1,605
sqft
|
built
1985
2142 E Turney Ave, Phoenix, AZ 85016
$-1,232
Cash flow
-13.1%
Cash-on-Cash Return
3.2%
Cap rate
0.5%
Rent to Value Ratio
Active
$1,295,000
3
bds
|
4
ba
|
4,039
sqft
|
built
1973
2108 E Pasadena Ave, Phoenix, AZ 85016
$-2,113
Cash flow
-8.5%
Cash-on-Cash Return
4.3%
Cap rate
0.6%
Rent to Value Ratio
Active
$329,000
1
bds
|
1
ba
|
850
sqft
|
built
1997
4644 N 22nd St, Phoenix, AZ 85016
$-998
Cash flow
-15.8%
Cash-on-Cash Return
2.6%
Cap rate
0.5%
Rent to Value Ratio
Active
$550,000
2
bds
|
2
ba
|
1,474
sqft
|
built
2006
4808 N 24th St, Phoenix, AZ 85016
$-1,601
Cash flow
-15.2%
Cash-on-Cash Return
2.8%
Cap rate
0.6%
Rent to Value Ratio
Active
$1,175,000
3
bds
|
3
ba
|
2,256
sqft
|
built
2022
1740 E Ocotillo Rd, Phoenix, AZ 85016
$-2,818
Cash flow
-12.5%
Cash-on-Cash Return
3.4%
Cap rate
0.5%
Rent to Value Ratio

Active
$399,999
2
bds
|
2
ba
|
1,268
sqft
|
built
2001
4525 N 22nd St, Phoenix, AZ 85016
$-1,115
Cash flow
-14.5%
Cash-on-Cash Return
2.9%
Cap rate
0.6%
Rent to Value Ratio

Active
$225,888
bds
|
1
ba
|
569
sqft
|
built
2003
1701 E Colter St, Phoenix, AZ 85016
$-522
Cash flow
-12.1%
Cash-on-Cash Return
3.5%
Cap rate
0.6%
Rent to Value Ratio
Active
$443,700
2
bds
|
2
ba
|
1,121
sqft
|
built
2006
4808 N 24th St, Phoenix, AZ 85016
$-1,532
Cash flow
-18.0%
Cash-on-Cash Return
2.1%
Cap rate
0.6%
Rent to Value Ratio
Active
$585,000
3
bds
|
4
ba
|
1,816
sqft
|
built
2018
4236 N 27th St, Phoenix, AZ 85016
$-1,690
Cash flow
-15.1%
Cash-on-Cash Return
2.8%
Cap rate
0.5%
Rent to Value Ratio
Active
$385,000
3
bds
|
3
ba
|
1,496
sqft
|
built
1966
2812 E Clarendon Ave, Phoenix, AZ 85016
$-966
Cash flow
-13.1%
Cash-on-Cash Return
3.3%
Cap rate
0.6%
Rent to Value Ratio
Active
$287,500
2
bds
|
1
ba
|
783
sqft
|
built
1975
6729 N 16th St, Phoenix, AZ 85016
$-671
Cash flow
-12.2%
Cash-on-Cash Return
3.5%
Cap rate
0.6%
Rent to Value Ratio
Pending
$445,000
3
bds
|
2
ba
|
1,340
sqft
|
built
1951
3041 E Osborn Rd, Phoenix, AZ 85016
$-1,082
Cash flow
-12.7%
Cash-on-Cash Return
3.3%
Cap rate
0.4%
Rent to Value Ratio
Active
$1,275,000
4
bds
|
4
ba
|
2,770
sqft
|
built
2018
1807 E Campbell Ave, Phoenix, AZ 85016
$-908
Cash flow
-3.7%
Cash-on-Cash Return
5.4%
Cap rate
0.7%
Rent to Value Ratio
Active
$250,000
2
bds
|
1
ba
|
951
sqft
|
built
1989
2025 E Campbell Ave, Phoenix, AZ 85016
$-233
Cash flow
-4.9%
Cash-on-Cash Return
5.1%
Cap rate
0.8%
Rent to Value Ratio
Active
$440,000
3
bds
|
2
ba
|
1,326
sqft
|
built
1952
1818 E Monterey Way, Phoenix, AZ 85016
$-651
Cash flow
-7.7%
Cash-on-Cash Return
4.5%
Cap rate
0.6%
Rent to Value Ratio

Active
$739,999
4
bds
|
3
ba
|
1,677
sqft
|
built
1953
5812 N 18th Pl, Phoenix, AZ 85016
$-1,482
Cash flow
-10.4%
Cash-on-Cash Return
3.9%
Cap rate
0.5%
Rent to Value Ratio
Active
$585,000
4
bds
|
2
ba
|
1,712
sqft
|
built
1948
2318 E Flower St, Phoenix, AZ 85016
$-1,459
Cash flow
-13.0%
Cash-on-Cash Return
3.3%
Cap rate
0.4%
Rent to Value Ratio
Active
$454,999
2
bds
|
2
ba
|
1,121
sqft
|
built
2006
4808 N 24th St, Phoenix, AZ 85016
$-1,614
Cash flow
-18.5%
Cash-on-Cash Return
2.0%
Cap rate
0.6%
Rent to Value Ratio
Active
$365,000
2
bds
|
1
ba
|
1,231
sqft
|
built
1981
5132 N 31st Way, Phoenix, AZ 85016
$-1,258
Cash flow
-18.0%
Cash-on-Cash Return
2.1%
Cap rate
0.6%
Rent to Value Ratio

Active
$330,000
2
bds
|
2
ba
|
1,076
sqft
|
built
1989
2025 E Campbell Ave, Phoenix, AZ 85016
$-818
Cash flow
-12.9%
Cash-on-Cash Return
3.3%
Cap rate
0.5%
Rent to Value Ratio

Pending
$649,000
3
bds
|
3
ba
|
1,369
sqft
|
built
2017
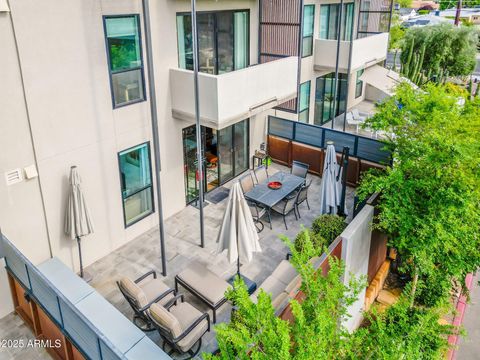
2300 E Campbell Ave, Phoenix, AZ 85016
$-2,627
Cash flow
-21.1%
Cash-on-Cash Return
1.4%
Cap rate
0.4%
Rent to Value Ratio

Active
$800,000
bds
|
0
ba
|
0
sqft
|
built
1959
2731 E Montecito Ave, Phoenix, AZ 85016
$-2,420
Cash flow
-15.8%
Cash-on-Cash Return
2.6%
Cap rate
0.4%
Rent to Value Ratio

Active
$374,999
4
bds
|
3
ba
|
1,632
sqft
|
built
1966
2818 E Clarendon Ave, Phoenix, AZ 85016
$-722
Cash flow
-10.0%
Cash-on-Cash Return
4.0%
Cap rate
0.6%
Rent to Value Ratio

Active
$1,020,000
6
bds
|
4
ba
|
3,561
sqft
|
built
1955
1801 E Berridge Ln, Phoenix, AZ 85016
$-1,943
Cash flow
-9.9%
Cash-on-Cash Return
4.0%
Cap rate
0.6%
Rent to Value Ratio

Active
$544,000
4
bds
|
2
ba
|
1,672
sqft
|
built
1930
1642 E Turney Ave, Phoenix, AZ 85016
$-1,476
Cash flow
-14.2%
Cash-on-Cash Return
3.0%
Cap rate
0.4%
Rent to Value Ratio