85016 Investment Properties for Sale
Browse homes for sale and investment properties in 85016. Refine your search by price, property type, or more.
Best cash flowing properties in 85016
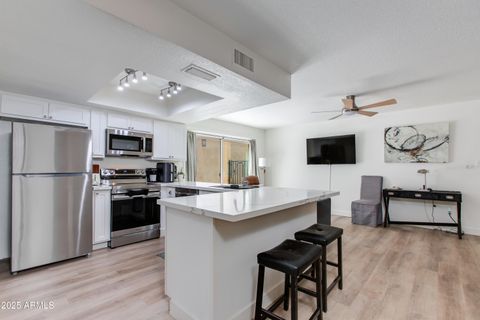
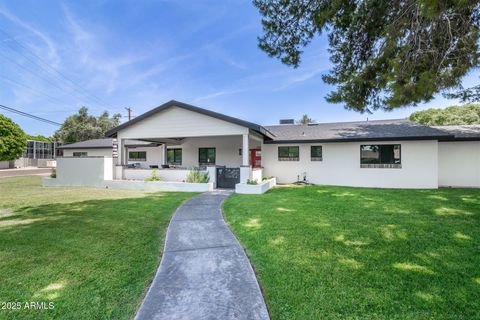
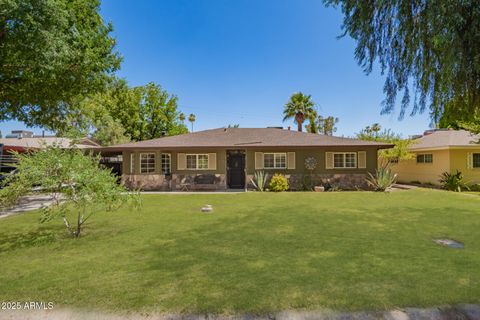
Active
$275,000
2
bds
|
2
ba
|
1,134
sqft
|
built
1981
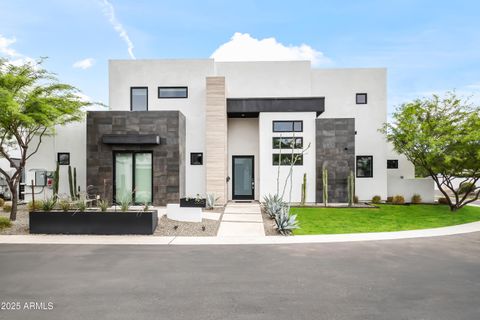
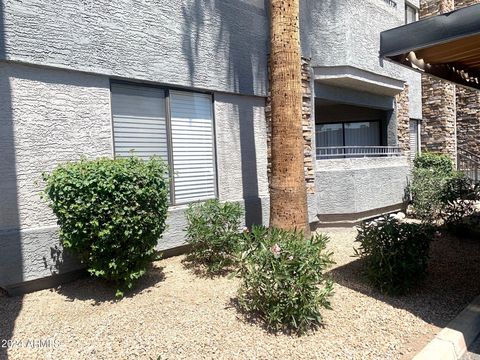
2021 E Osborn Rd, Phoenix, AZ 85016
$-269
Cash flow
-5.1%
Cash-on-Cash Return
4.5%
Cap rate
0.6%
Rent to Value Ratio
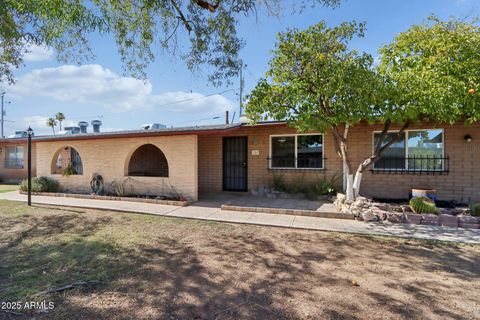
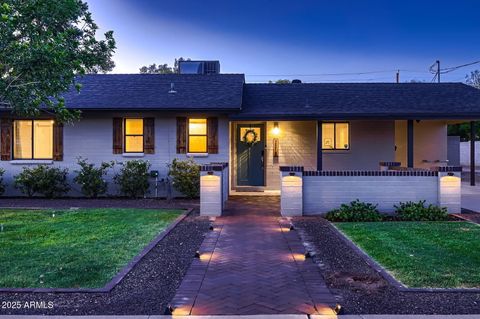
Active
$280,000
2
bds
|
1
ba
|
783
sqft
|
built
1975
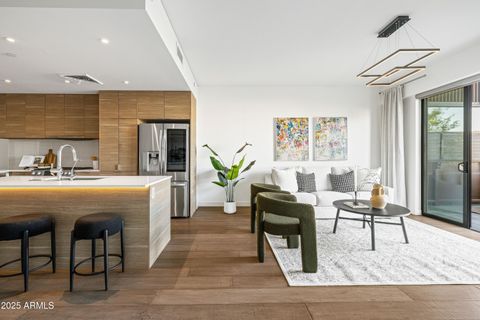
6739 N 16th St, Phoenix, AZ 85016
$-607
Cash flow
-11.3%
Cash-on-Cash Return
3.1%
Cap rate
0.5%
Rent to Value Ratio
210 out of 225 properties for sale in 85016
Limited Results Shown
Create a free account, or log in to reveal all property listings and enjoy the complete experience.
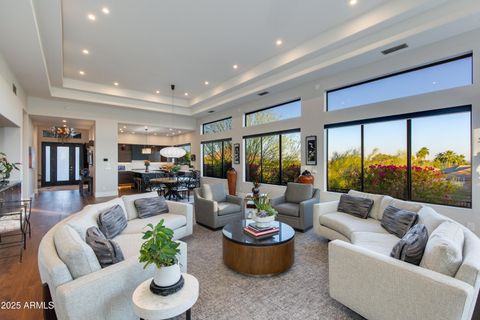
Active
$2,750,000
3
bds
|
4
ba
|
3,224
sqft
|
built
1996
6512 N 31st Way, Phoenix, AZ 85016
$-10,566
Cash flow
-20.0%
Cash-on-Cash Return
1.1%
Cap rate
0.2%
Rent to Value Ratio
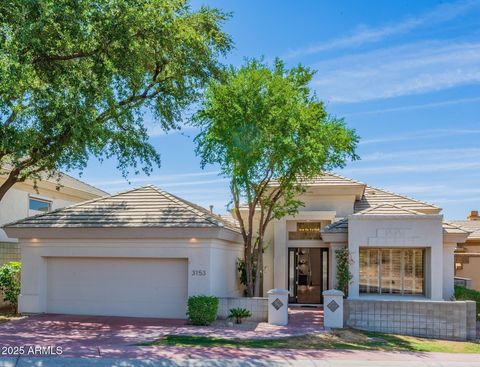
Active
$2,395,000
3
bds
|
4
ba
|
3,091
sqft
|
built
1996
3153 E Sierra Vista Dr, Phoenix, AZ 85016
$-8,161
Cash flow
-17.8%
Cash-on-Cash Return
1.6%
Cap rate
0.3%
Rent to Value Ratio
Active
$1,550,000
4
bds
|
4
ba
|
3,421
sqft
|
built
1955
3102 E Mariposa St, Phoenix, AZ 85016
$-4,775
Cash flow
-16.1%
Cash-on-Cash Return
2.0%
Cap rate
0.3%
Rent to Value Ratio
Active
$280,000
2
bds
|
1
ba
|
783
sqft
|
built
1975
6739 N 16th St, Phoenix, AZ 85016
$-607
Cash flow
-11.3%
Cash-on-Cash Return
3.1%
Cap rate
0.5%
Rent to Value Ratio
Active
$275,000
2
bds
|
2
ba
|
1,134
sqft
|
built
1981
2021 E Osborn Rd, Phoenix, AZ 85016
$-269
Cash flow
-5.1%
Cash-on-Cash Return
4.5%
Cap rate
0.6%
Rent to Value Ratio

Active
$649,000
3
bds
|
2
ba
|
1,884
sqft
|
built
1947
3018 E Mulberry Dr, Phoenix, AZ 85016
$-1,329
Cash flow
-10.7%
Cash-on-Cash Return
3.2%
Cap rate
0.4%
Rent to Value Ratio
Active
$734,000
3
bds
|
2
ba
|
1,847
sqft
|
built
1949
2518 E Flower St, Phoenix, AZ 85016
$-1,270
Cash flow
-9.0%
Cash-on-Cash Return
3.6%
Cap rate
0.5%
Rent to Value Ratio

Active
$550,000
2
bds
|
2
ba
|
1,360
sqft
|
built
1971
6629 N Majorca Way E, Phoenix, AZ 85016
$-1,671
Cash flow
-15.9%
Cash-on-Cash Return
2.6%
Cap rate
0.4%
Rent to Value Ratio

Active
$2,100,000
4
bds
|
3
ba
|
2,928
sqft
|
built
1987
3109 E Sierra Madre Way, Phoenix, AZ 85016
$-8,408
Cash flow
-20.9%
Cash-on-Cash Return
1.5%
Cap rate
0.3%
Rent to Value Ratio

Active
$489,900
2
bds
|
1
ba
|
875
sqft
|
built
1953
2223 E Roma Ave, Phoenix, AZ 85016
$-1,464
Cash flow
-15.6%
Cash-on-Cash Return
2.7%
Cap rate
0.4%
Rent to Value Ratio
Active
$3,150,000
3
bds
|
4
ba
|
3,196
sqft
|
built
1986
3186 E Stella Ln, Phoenix, AZ 85016
$-14,738
Cash flow
-24.4%
Cash-on-Cash Return
0.7%
Cap rate
0.1%
Rent to Value Ratio

Active
$5,500,000
4
bds
|
4
ba
|
4,817
sqft
|
built
2008
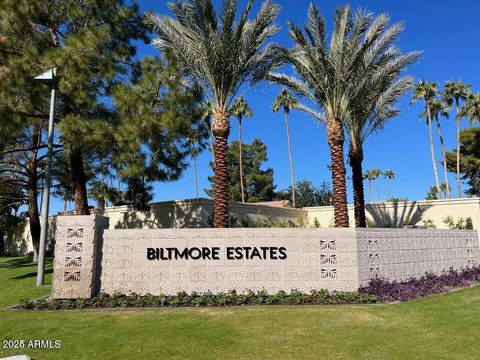
2 Biltmore Est, Phoenix, AZ 85016
$-26,657
Cash flow
-25.3%
Cash-on-Cash Return
0.4%
Cap rate
0.2%
Rent to Value Ratio

Active
$749,900
2
bds
|
2
ba
|
1,407
sqft
|
built
1981
2413 E Rancho Dr, Phoenix, AZ 85016
$-2,804
Cash flow
-19.5%
Cash-on-Cash Return
1.8%
Cap rate
0.4%
Rent to Value Ratio

Active
$620,000
4
bds
|
3
ba
|
2,303
sqft
|
built
1950
3115 N 26th St, Phoenix, AZ 85016
$-1,660
Cash flow
-14.0%
Cash-on-Cash Return
3.1%
Cap rate
0.4%
Rent to Value Ratio

Active
$358,000
1
bds
|
2
ba
|
856
sqft
|
built
1979
5203 N 24th St, Phoenix, AZ 85016
$-1,323
Cash flow
-19.3%
Cash-on-Cash Return
1.8%
Cap rate
0.4%
Rent to Value Ratio

Active
$520,000
2
bds
|
3
ba
|
1,374
sqft
|
built
1986
4225 N 21st St, Phoenix, AZ 85016
$-1,320
Cash flow
-13.2%
Cash-on-Cash Return
3.2%
Cap rate
0.5%
Rent to Value Ratio
Active
$4,890,000
3
bds
|
4
ba
|
3,931
sqft
|
built
2017
2 Biltmore Est, Phoenix, AZ 85016
$-25,884
Cash flow
-27.6%
Cash-on-Cash Return
-0.1%
Cap rate
0.1%
Rent to Value Ratio
Active
$325,000
2
bds
|
1
ba
|
797
sqft
|
built
1970
1850 E Maryland Ave, Phoenix, AZ 85016
$-944
Cash flow
-15.2%
Cash-on-Cash Return
2.8%
Cap rate
0.6%
Rent to Value Ratio

Active
$427,000
3
bds
|
1
ba
|
1,100
sqft
|
built
1954
3031 E Avalon Dr, Phoenix, AZ 85016
$-825
Cash flow
-10.1%
Cash-on-Cash Return
3.9%
Cap rate
0.5%
Rent to Value Ratio
Active
$6,800,000
6
bds
|
9
ba
|
7,403
sqft
|
built
1970
2311 E Colter St, Phoenix, AZ 85016
$-32,162
Cash flow
-24.7%
Cash-on-Cash Return
0.6%
Cap rate
0.1%
Rent to Value Ratio
Active
$4,200,000
4
bds
|
6
ba
|
6,538
sqft
|
built
2000
6621 N Arizona Biltmore Cir, Phoenix, AZ 85016
$-19,941
Cash flow
-24.8%
Cash-on-Cash Return
0.6%
Cap rate
0.2%
Rent to Value Ratio

Active
$699,900
3
bds
|
2
ba
|
1,677
sqft
|
built
1952
1945 E Solano Dr, Phoenix, AZ 85016
$-2,046
Cash flow
-15.3%
Cash-on-Cash Return
2.8%
Cap rate
0.4%
Rent to Value Ratio
Active
$625,000
4
bds
|
2
ba
|
2,031
sqft
|
built
1950
2501 E Campbell Ave, Phoenix, AZ 85016
$-1,361
Cash flow
-11.4%
Cash-on-Cash Return
3.7%
Cap rate
0.5%
Rent to Value Ratio
Active
$1,450,000
4
bds
|
3
ba
|
2,951
sqft
|
built
2021
3615 N Nicosia Cir, Phoenix, AZ 85016
$-5,526
Cash flow
-19.9%
Cash-on-Cash Return
1.7%
Cap rate
0.3%
Rent to Value Ratio
Active
$499,000
1
bds
|
2
ba
|
1,008
sqft
|
built
2017
2300 E Campbell Ave, Phoenix, AZ 85016
$-2,122
Cash flow
-22.2%
Cash-on-Cash Return
1.2%
Cap rate
0.4%
Rent to Value Ratio
Active
$3,175,000
3
bds
|
4
ba
|
4,000
sqft
|
built
2006
2211 E Camelback Rd, Phoenix, AZ 85016
$-14,778
Cash flow
-24.3%
Cash-on-Cash Return
0.7%
Cap rate
0.3%
Rent to Value Ratio
Active
$495,000
3
bds
|
1
ba
|
1,325
sqft
|
built
1953
2213 E Campbell Ave, Phoenix, AZ 85016
$-1,309
Cash flow
-13.8%
Cash-on-Cash Return
3.1%
Cap rate
0.4%
Rent to Value Ratio
Active
$680,000
3
bds
|
2
ba
|
1,843
sqft
|
built
1954
1825 E Medlock Dr, Phoenix, AZ 85016
$-1,552
Cash flow
-11.9%
Cash-on-Cash Return
2.9%
Cap rate
0.4%
Rent to Value Ratio
Active
$1,299,000
2
bds
|
3
ba
|
1,871
sqft
|
built
1964
1621 E Maryland Ave, Phoenix, AZ 85016
$-5,552
Cash flow
-22.3%
Cash-on-Cash Return
1.1%
Cap rate
0.2%
Rent to Value Ratio
Active
$599,999
3
bds
|
2
ba
|
1,692
sqft
|
built
1956
3202 N 21st St, Phoenix, AZ 85016
$-1,321
Cash flow
-11.5%
Cash-on-Cash Return
3.6%
Cap rate
0.5%
Rent to Value Ratio
Active
$799,000
4
bds
|
2
ba
|
1,994
sqft
|
built
1947
4205 N 19th Pl, Phoenix, AZ 85016
$-3,087
Cash flow
-20.2%
Cash-on-Cash Return
1.6%
Cap rate
0.3%
Rent to Value Ratio

Active
$574,999
3
bds
|
3
ba
|
1,717
sqft
|
built
1948
2511 E Pinchot Ave, Phoenix, AZ 85016
$-1,574
Cash flow
-14.3%
Cash-on-Cash Return
3.0%
Cap rate
0.4%
Rent to Value Ratio
Active
$274,900
2
bds
|
1
ba
|
951
sqft
|
built
1989
2025 E Campbell Ave, Phoenix, AZ 85016
$-652
Cash flow
-12.4%
Cash-on-Cash Return
3.4%
Cap rate
0.6%
Rent to Value Ratio
Active
$1,399,999
4
bds
|
4
ba
|
2,659
sqft
|
built
2022
3010 E Glenrosa Ave, Phoenix, AZ 85016
$-4,297
Cash flow
-16.0%
Cash-on-Cash Return
2.6%
Cap rate
0.4%
Rent to Value Ratio

Active
$550,000
4
bds
|
2
ba
|
1,228
sqft
|
built
1950
2921 E Cheery Lynn Rd, Phoenix, AZ 85016
$-1,479
Cash flow
-14.0%
Cash-on-Cash Return
3.0%
Cap rate
0.4%
Rent to Value Ratio
Active
$405,000
1
bds
|
1
ba
|
862
sqft
|
built
2006
4808 N 24th St, Phoenix, AZ 85016
$-884
Cash flow
-11.4%
Cash-on-Cash Return
3.6%
Cap rate
0.7%
Rent to Value Ratio
Active
$695,000
4
bds
|
3
ba
|
2,192
sqft
|
built
1947
2726 E Fairmount Ave, Phoenix, AZ 85016
$-2,058
Cash flow
-15.4%
Cash-on-Cash Return
2.7%
Cap rate
0.4%
Rent to Value Ratio
Active
$323,000
1
bds
|
2
ba
|
1,224
sqft
|
built
1981
5124 N 31st Pl, Phoenix, AZ 85016
$-1,077
Cash flow
-17.4%
Cash-on-Cash Return
2.3%
Cap rate
0.7%
Rent to Value Ratio
Active
$237,000
2
bds
|
2
ba
|
874
sqft
|
built
1982
2625 E Indian School Rd, Phoenix, AZ 85016
$-672
Cash flow
-14.8%
Cash-on-Cash Return
2.9%
Cap rate
0.6%
Rent to Value Ratio
Active
$330,000
2
bds
|
2
ba
|
1,319
sqft
|
built
1981
5132 N 31st Way, Phoenix, AZ 85016
$-999
Cash flow
-15.8%
Cash-on-Cash Return
2.6%
Cap rate
0.8%
Rent to Value Ratio