85023 Investment Properties for Sale
Browse homes for sale and investment properties in 85023. Refine your search by price, property type, or more.
Best cash flowing properties in 85023
Active
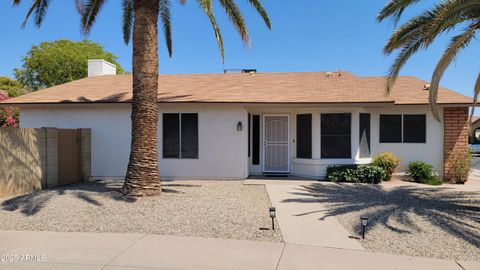
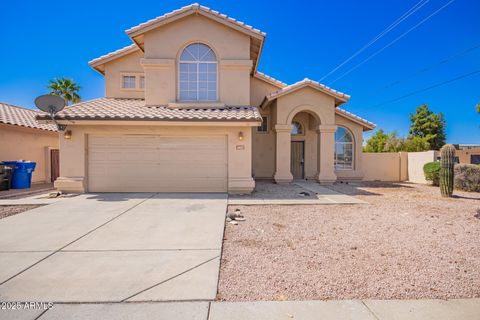
$345,000
3
bds
|
1
ba
|
1,546
sqft
|
built
1982
2317 W Danbury Rd, Phoenix, AZ 85023
$18
Cash flow
0.3%
Cash-on-Cash Return
5.7%
Cap rate
0.7%
Rent to Value Ratio

Active
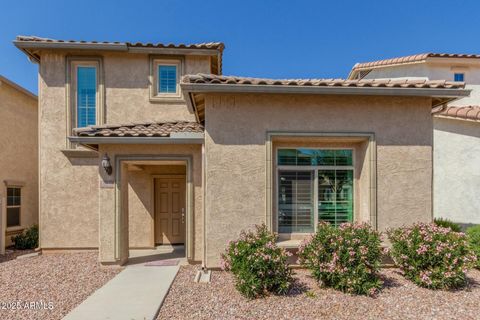
$184,947
1
bds
|
1
ba
|
672
sqft
|
built
1981
17242 N 16th Dr, Phoenix, AZ 85023
$-262
Cash flow
-7.4%
Cash-on-Cash Return
4.0%
Cap rate
0.7%
Rent to Value Ratio
53 out of 58 properties for sale in 85023
Limited Results Shown
Create a free account, or log in to reveal all property listings and enjoy the complete experience.
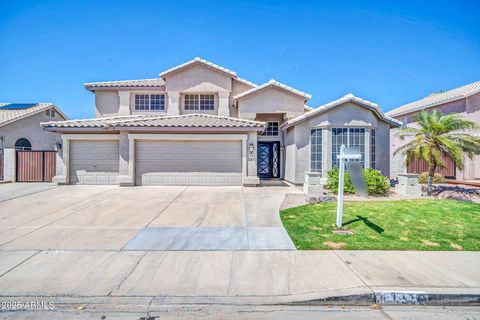
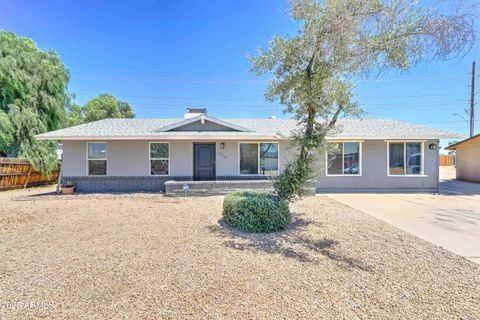
Active
$390,000
3
bds
|
2
ba
|
1,639
sqft
|
built
1974
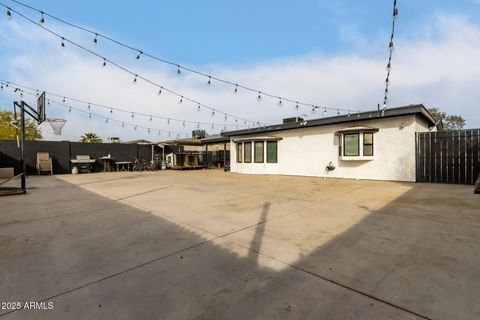
2415 W Villa Rita Dr, Phoenix, AZ 85023
$-414
Cash flow
-5.5%
Cash-on-Cash Return
4.4%
Cap rate
0.6%
Rent to Value Ratio

Active
$525,000
4
bds
|
3
ba
|
2,270
sqft
|
built
2000
16036 N 11th Ave, Phoenix, AZ 85023
$-1,397
Cash flow
-13.9%
Cash-on-Cash Return
2.5%
Cap rate
0.4%
Rent to Value Ratio
Active
$720,000
4
bds
|
3
ba
|
3,018
sqft
|
built
1994
1330 W Beck Ln, Phoenix, AZ 85023
$-1,542
Cash flow
-11.2%
Cash-on-Cash Return
3.1%
Cap rate
0.4%
Rent to Value Ratio
Active
$659,899
8
bds
|
3
ba
|
2,346
sqft
|
built
1976
17627 N 14th Ave, Phoenix, AZ 85023
$-885
Cash flow
-7.0%
Cash-on-Cash Return
4.1%
Cap rate
0.5%
Rent to Value Ratio
Active
$550,000
4
bds
|
2
ba
|
1,866
sqft
|
built
1974
2338 W Mandalay Ln, Phoenix, AZ 85023
$-827
Cash flow
-7.8%
Cash-on-Cash Return
3.9%
Cap rate
0.5%
Rent to Value Ratio
Active
$675,000
4
bds
|
2
ba
|
2,197
sqft
|
built
1977
15427 N 2nd Ave, Phoenix, AZ 85023
$-1,228
Cash flow
-9.5%
Cash-on-Cash Return
3.5%
Cap rate
0.5%
Rent to Value Ratio

Active
$1,595,000
4
bds
|
6
ba
|
4,347
sqft
|
built
2011
321 W Tam Oshanter Dr, Phoenix, AZ 85023
$-5,363
Cash flow
-17.5%
Cash-on-Cash Return
1.6%
Cap rate
0.3%
Rent to Value Ratio

Active
$415,000
3
bds
|
2
ba
|
1,539
sqft
|
built
1973
1634 W Villa Rita Dr, Phoenix, AZ 85023
$-540
Cash flow
-6.8%
Cash-on-Cash Return
4.1%
Cap rate
0.5%
Rent to Value Ratio
Active
$320,000
3
bds
|
3
ba
|
1,522
sqft
|
built
1975
2416 W Caribbean Ln, Phoenix, AZ 85023
$-349
Cash flow
-5.7%
Cash-on-Cash Return
4.4%
Cap rate
0.6%
Rent to Value Ratio

Active
$494,500
4
bds
|
2
ba
|
2,176
sqft
|
built
1972
18045 N 20th Ln, Phoenix, AZ 85023
$-1,085
Cash flow
-11.4%
Cash-on-Cash Return
3.0%
Cap rate
0.4%
Rent to Value Ratio
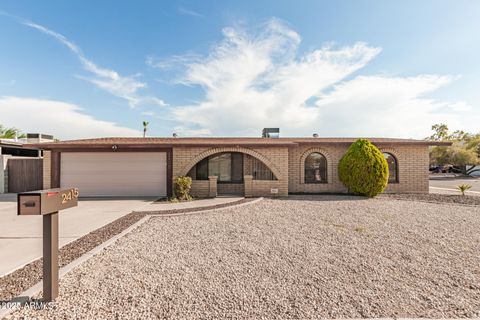
Active
$724,500
3
bds
|
3
ba
|
1,985
sqft
|
built
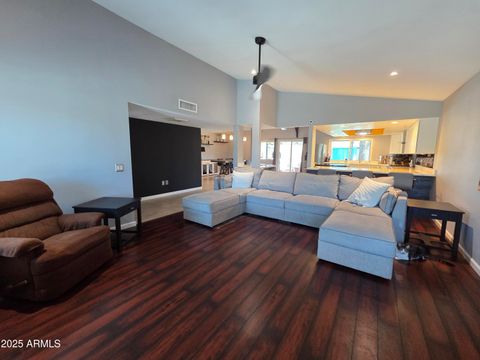
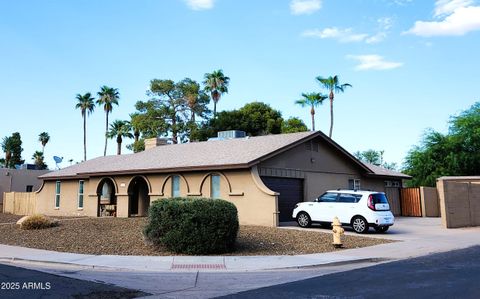
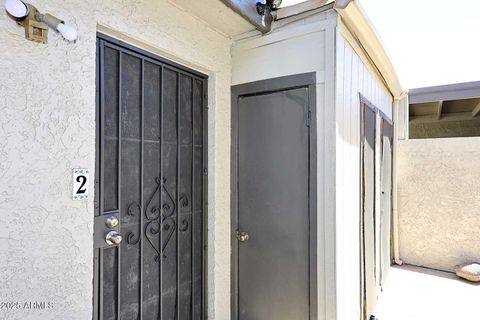
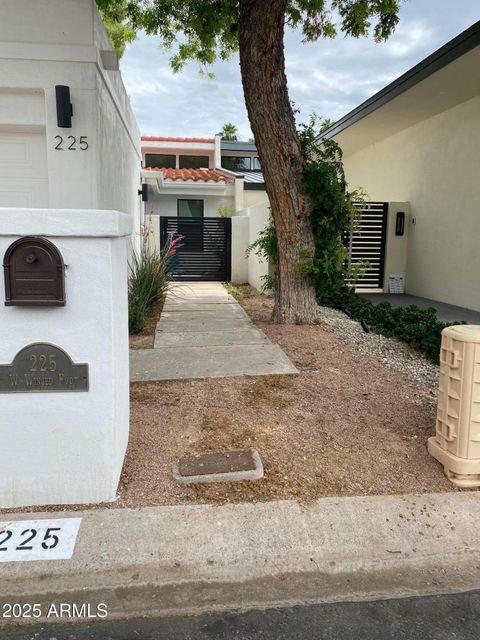
1974
225 W Winged Foot Rd, Phoenix, AZ 85023
$-2,145
Cash flow
-15.4%
Cash-on-Cash Return
2.1%
Cap rate
0.3%
Rent to Value Ratio

Active
$3,500,000
7
bds
|
10
ba
|
9,094
sqft
|
built
2007
15217 N 15th Dr, Phoenix, AZ 85023
$-10,332
Cash flow
-15.4%
Cash-on-Cash Return
2.1%
Cap rate
0.3%
Rent to Value Ratio

Active
$440,000
3
bds
|
3
ba
|
1,794
sqft
|
built
1998
15646 N 20th Ave, Phoenix, AZ 85023
$-788
Cash flow
-9.3%
Cash-on-Cash Return
3.5%
Cap rate
0.5%
Rent to Value Ratio
Active
$1,795,000
5
bds
|
5
ba
|
7,710
sqft
|
built
1992
1044 W Indian Hills Pl, Phoenix, AZ 85023
$-3,605
Cash flow
-10.5%
Cash-on-Cash Return
3.3%
Cap rate
0.5%
Rent to Value Ratio
Active
$649,900
7
bds
|
3
ba
|
2,498
sqft
|
built
1971
1501 W Grovers Ave, Phoenix, AZ 85023
$-1,014
Cash flow
-8.1%
Cash-on-Cash Return
3.8%
Cap rate
0.5%
Rent to Value Ratio
Active
$499,000
3
bds
|
2
ba
|
1,553
sqft
|
built
1988
402 W Grandview Rd, Phoenix, AZ 85023
$-901
Cash flow
-9.4%
Cash-on-Cash Return
3.5%
Cap rate
0.5%
Rent to Value Ratio
Active
$445,000
3
bds
|
2
ba
|
1,567
sqft
|
built
1991
330 W Le Marche Ave, Phoenix, AZ 85023
$-847
Cash flow
-9.9%
Cash-on-Cash Return
3.4%
Cap rate
0.5%
Rent to Value Ratio

Active
$359,000
3
bds
|
2
ba
|
1,010
sqft
|
built
1977
1018 W Helena Dr, Phoenix, AZ 85023
$-523
Cash flow
-7.6%
Cash-on-Cash Return
3.9%
Cap rate
0.5%
Rent to Value Ratio

Active
$675,000
4
bds
|
3
ba
|
3,231
sqft
|
built
1979
18049 N 13th Ave, Phoenix, AZ 85023
$-1,481
Cash flow
-11.4%
Cash-on-Cash Return
3.0%
Cap rate
0.4%
Rent to Value Ratio

Active
$475,000
3
bds
|
2
ba
|
1,688
sqft
|
built
1980
2432 W Evans Dr, Phoenix, AZ 85023
$-659
Cash flow
-7.2%
Cash-on-Cash Return
4.0%
Cap rate
0.5%
Rent to Value Ratio
Active
$465,000
2
bds
|
3
ba
|
1,324
sqft
|
built
1989
15818 N 6th Ave, Phoenix, AZ 85023
$-818
Cash flow
-9.2%
Cash-on-Cash Return
3.6%
Cap rate
0.5%
Rent to Value Ratio
Active
$1,175,000
4
bds
|
4
ba
|
4,160
sqft
|
built
1962
330 W Tam Oshanter Dr, Phoenix, AZ 85023
$-3,341
Cash flow
-14.8%
Cash-on-Cash Return
2.3%
Cap rate
0.3%
Rent to Value Ratio
Active
$425,000
3
bds
|
2
ba
|
1,342
sqft
|
built
1977
926 W Angela Dr, Phoenix, AZ 85023
$-783
Cash flow
-9.6%
Cash-on-Cash Return
3.5%
Cap rate
0.4%
Rent to Value Ratio
Active
$369,900
4
bds
|
2
ba
|
1,360
sqft
|
built
1971
2331 W Hartford Ave, Phoenix, AZ 85023
$-596
Cash flow
-8.4%
Cash-on-Cash Return
3.7%
Cap rate
0.5%
Rent to Value Ratio
Active
$340,000
2
bds
|
2
ba
|
1,162
sqft
|
built
1981
2626 W Hearn Rd, Phoenix, AZ 85023
$-529
Cash flow
-8.1%
Cash-on-Cash Return
3.8%
Cap rate
0.5%
Rent to Value Ratio
Active
$320,000
3
bds
|
2
ba
|
1,205
sqft
|
built
1979
2506 W Caribbean Ln, Phoenix, AZ 85023
$-617
Cash flow
-10.1%
Cash-on-Cash Return
3.4%
Cap rate
0.5%
Rent to Value Ratio
Active
$219,999
2
bds
|
2
ba
|
914
sqft
|
built
1981
14203 N 19th Ave, Phoenix, AZ 85023
$-460
Cash flow
-10.9%
Cash-on-Cash Return
3.2%
Cap rate
0.6%
Rent to Value Ratio
Active
$399,900
3
bds
|
3
ba
|
1,454
sqft
|
built
2012
1926 W Busoni Pl, Phoenix, AZ 85023
$-695
Cash flow
-9.1%
Cash-on-Cash Return
3.6%
Cap rate
0.6%
Rent to Value Ratio

Active
$785,000
4
bds
|
2
ba
|
2,478
sqft
|
built
1978
852 W Caribbean Ln, Phoenix, AZ 85023
$-1,899
Cash flow
-12.6%
Cash-on-Cash Return
2.8%
Cap rate
0.4%
Rent to Value Ratio

Active
$350,000
2
bds
|
1
ba
|
1,097
sqft
|
built
1983
124 W Bluefield Ave, Phoenix, AZ 85023
$-494
Cash flow
-7.4%
Cash-on-Cash Return
4.0%
Cap rate
0.5%
Rent to Value Ratio
Active
$495,000
4
bds
|
3
ba
|
1,997
sqft
|
built
1994
1417 W Wagoner Rd, Phoenix, AZ 85023
$-790
Cash flow
-8.3%
Cash-on-Cash Return
3.8%
Cap rate
0.5%
Rent to Value Ratio

Active
$359,999
2
bds
|
3
ba
|
1,310
sqft
|
built
2007
16017 N 19th Dr, Phoenix, AZ 85023
$-430
Cash flow
-6.2%
Cash-on-Cash Return
4.2%
Cap rate
0.6%
Rent to Value Ratio

Active
$190,000
1
bds
|
1
ba
|
579
sqft
|
built
1981
14203 N 19th Ave, Phoenix, AZ 85023
$-291
Cash flow
-8.0%
Cash-on-Cash Return
3.8%
Cap rate
0.6%
Rent to Value Ratio

Active
$390,000
3
bds
|
2
ba
|
1,339
sqft
|
built
1978
911 W Campo Bello Dr, Phoenix, AZ 85023
$-396
Cash flow
-5.3%
Cash-on-Cash Return
4.5%
Cap rate
0.6%
Rent to Value Ratio

Active
$219,900
2
bds
|
2
ba
|
968
sqft
|
built
1975
1916 W Morningside Dr, Phoenix, AZ 85023
$-385
Cash flow
-9.1%
Cash-on-Cash Return
3.6%
Cap rate
0.6%
Rent to Value Ratio
Active
$489,900
3
bds
|
3
ba
|
2,446
sqft
|
built
2006
2050 W Davis Rd, Phoenix, AZ 85023
$-918
Cash flow
-9.8%
Cash-on-Cash Return
3.4%
Cap rate
0.5%
Rent to Value Ratio
Active
$419,000
3
bds
|
2
ba
|
1,458
sqft
|
built
1974
1716 W Villa Theresa Dr, Phoenix, AZ 85023
$-515
Cash flow
-6.4%
Cash-on-Cash Return
4.2%
Cap rate
0.5%
Rent to Value Ratio

Active
$464,900
4
bds
|
2
ba
|
1,702
sqft
|
built
1973
2339 W Ponderosa Ln, Phoenix, AZ 85023
$-836
Cash flow
-9.4%
Cash-on-Cash Return
3.5%
Cap rate
0.5%
Rent to Value Ratio