85024 Investment Properties for Sale
Browse homes for sale and investment properties in 85024. Refine your search by price, property type, or more.
Best cash flowing properties in 85024

Active
$509,777
3
bds
|
2
ba
|
1,215
sqft
|
built
1996
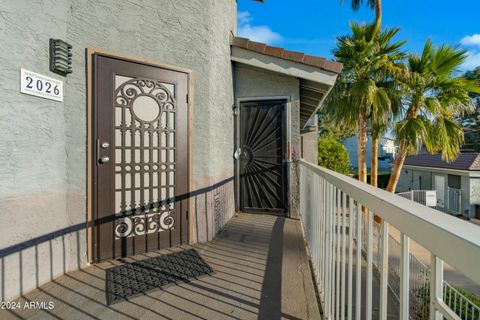
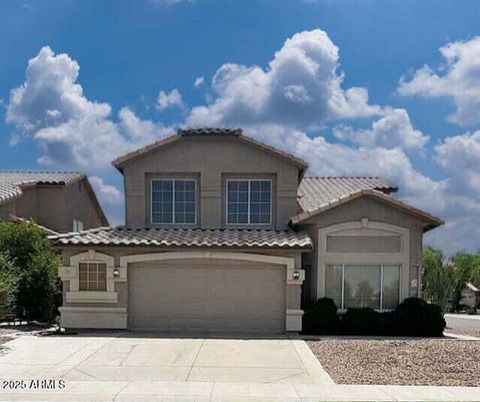
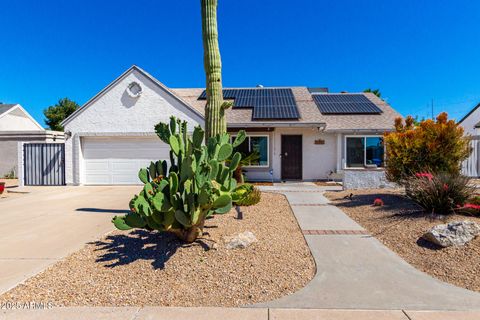
2110 E Williams Dr, Phoenix, AZ 85024
$205
Cash flow
2.1%
Cash-on-Cash Return
6.2%
Cap rate
0.8%
Rent to Value Ratio
Active
$209,500
1
bds
|
1
ba
|
856
sqft
|
built
1985
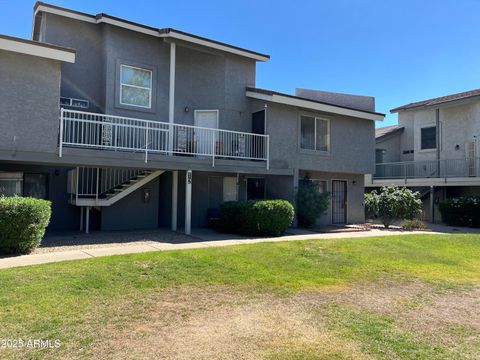
19601 N 7th St, Phoenix, AZ 85024
$-111
Cash flow
-2.8%
Cash-on-Cash Return
5.0%
Cap rate
0.8%
Rent to Value Ratio
47 out of 48 properties for sale in 85024
Limited Results Shown
Create a free account, or log in to reveal all property listings and enjoy the complete experience.
Active
$538,000
3
bds
|
2
ba
|
1,597
sqft
|
built
1981
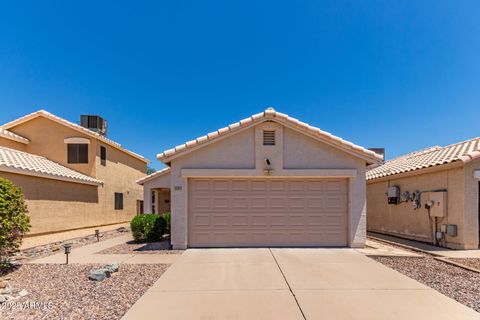
402 E Morrow Dr, Phoenix, AZ 85024
$-946
Cash flow
-9.2%
Cash-on-Cash Return
3.6%
Cap rate
0.5%
Rent to Value Ratio

Active
$640,000
3
bds
|
3
ba
|
2,057
sqft
|
built
2000
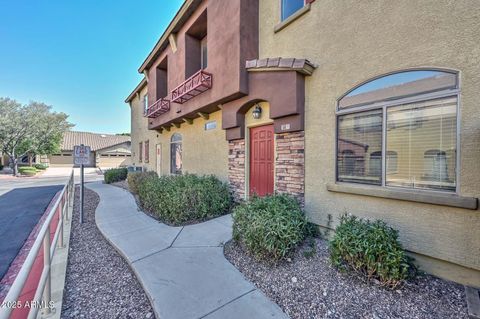
22424 N 19th Way, Phoenix, AZ 85024
$-1,339
Cash flow
-10.9%
Cash-on-Cash Return
3.2%
Cap rate
0.4%
Rent to Value Ratio
Active
$639,000
3
bds
|
3
ba
|
2,009
sqft
|
built
1999
23219 N 21st Pl, Phoenix, AZ 85024
$-1,346
Cash flow
-11.0%
Cash-on-Cash Return
3.2%
Cap rate
0.4%
Rent to Value Ratio
Active
$380,000
3
bds
|
2
ba
|
1,433
sqft
|
built
1984
1313 E Piute Ave, Phoenix, AZ 85024
$-501
Cash flow
-6.9%
Cash-on-Cash Return
4.1%
Cap rate
0.5%
Rent to Value Ratio
Active
$530,000
4
bds
|
2
ba
|
1,810
sqft
|
built
1999
2001 E Renee Dr, Phoenix, AZ 85024
$-995
Cash flow
-9.8%
Cash-on-Cash Return
3.4%
Cap rate
0.5%
Rent to Value Ratio
Active
$600,000
4
bds
|
4
ba
|
2,277
sqft
|
built
1985
1402 E Wescott Dr, Phoenix, AZ 85024
$-1,506
Cash flow
-13.1%
Cash-on-Cash Return
2.7%
Cap rate
0.4%
Rent to Value Ratio
Active
$699,000
4
bds
|
3
ba
|
2,248
sqft
|
built
1995
1723 E Pontiac Dr, Phoenix, AZ 85024
$-1,629
Cash flow
-12.2%
Cash-on-Cash Return
2.9%
Cap rate
0.4%
Rent to Value Ratio
Active
$379,999
2
bds
|
2
ba
|
1,209
sqft
|
built
2005
2250 E Deer Valley Rd, Phoenix, AZ 85024
$-735
Cash flow
-10.1%
Cash-on-Cash Return
3.4%
Cap rate
0.5%
Rent to Value Ratio
Active
$266,000
3
bds
|
2
ba
|
1,184
sqft
|
built
1985
19601 N 7th St, Phoenix, AZ 85024
$-336
Cash flow
-6.6%
Cash-on-Cash Return
4.2%
Cap rate
0.6%
Rent to Value Ratio

Active
$500,000
4
bds
|
2
ba
|
1,712
sqft
|
built
1983
538 E Rockwood Dr, Phoenix, AZ 85024
$-562
Cash flow
-5.9%
Cash-on-Cash Return
4.3%
Cap rate
0.6%
Rent to Value Ratio
Active
$440,000
3
bds
|
3
ba
|
1,336
sqft
|
built
2008
2725 E Mine Creek Rd, Phoenix, AZ 85024
$-931
Cash flow
-11.0%
Cash-on-Cash Return
3.1%
Cap rate
0.5%
Rent to Value Ratio
Active
$699,900
4
bds
|
3
ba
|
2,413
sqft
|
built
1995
1701 E Yukon Dr, Phoenix, AZ 85024
$-1,569
Cash flow
-11.7%
Cash-on-Cash Return
3.0%
Cap rate
0.4%
Rent to Value Ratio
Active
$349,000
2
bds
|
2
ba
|
884
sqft
|
built
1984
934 E Wahalla Ln, Phoenix, AZ 85024
$-482
Cash flow
-7.2%
Cash-on-Cash Return
4.0%
Cap rate
0.5%
Rent to Value Ratio
Active
$639,000
4
bds
|
3
ba
|
2,490
sqft
|
built
1998
2251 E Parkside Ln, Phoenix, AZ 85024
$-1,272
Cash flow
-10.4%
Cash-on-Cash Return
3.3%
Cap rate
0.5%
Rent to Value Ratio
Active
$389,950
3
bds
|
2
ba
|
1,353
sqft
|
built
1983
1034 E Sequoia Dr, Phoenix, AZ 85024
$-490
Cash flow
-6.6%
Cash-on-Cash Return
4.2%
Cap rate
0.5%
Rent to Value Ratio
Active
$614,900
5
bds
|
3
ba
|
2,953
sqft
|
built
1998
1705 E Rose Garden Ln, Phoenix, AZ 85024
$-1,514
Cash flow
-12.8%
Cash-on-Cash Return
2.7%
Cap rate
0.4%
Rent to Value Ratio
Active
$469,500
2
bds
|
2
ba
|
873
sqft
|
built
1996
2138 E Williams Dr, Phoenix, AZ 85024
$-850
Cash flow
-9.4%
Cash-on-Cash Return
3.5%
Cap rate
0.5%
Rent to Value Ratio

Active
$688,500
3
bds
|
3
ba
|
2,021
sqft
|
built
1998
2210 E Paraiso Dr, Phoenix, AZ 85024
$-1,720
Cash flow
-13.0%
Cash-on-Cash Return
2.7%
Cap rate
0.4%
Rent to Value Ratio
Active
$615,000
3
bds
|
2
ba
|
1,739
sqft
|
built
1997
19606 N 23rd Way, Phoenix, AZ 85024
$-860
Cash flow
-7.3%
Cash-on-Cash Return
4.0%
Cap rate
0.5%
Rent to Value Ratio
Active
$520,000
3
bds
|
2
ba
|
1,400
sqft
|
built
1998
23411 N 21st Way, Phoenix, AZ 85024
$-1,066
Cash flow
-10.7%
Cash-on-Cash Return
3.2%
Cap rate
0.4%
Rent to Value Ratio
Active
$449,900
3
bds
|
2
ba
|
1,298
sqft
|
built
1981
426 E Morrow Dr, Phoenix, AZ 85024
$-500
Cash flow
-5.8%
Cash-on-Cash Return
4.3%
Cap rate
0.6%
Rent to Value Ratio
Active
$829,949
5
bds
|
3
ba
|
3,308
sqft
|
built
1997
20809 N 17th St, Phoenix, AZ 85024
$-1,876
Cash flow
-11.8%
Cash-on-Cash Return
3.0%
Cap rate
0.4%
Rent to Value Ratio
Active
$390,000
3
bds
|
2
ba
|
1,006
sqft
|
built
1983
521 E Wickieup Ln, Phoenix, AZ 85024
$-678
Cash flow
-9.1%
Cash-on-Cash Return
3.6%
Cap rate
0.5%
Rent to Value Ratio
Active
$398,950
2
bds
|
1
ba
|
1,020
sqft
|
built
1983
19440 N 12th St, Phoenix, AZ 85024
$-589
Cash flow
-7.7%
Cash-on-Cash Return
3.9%
Cap rate
0.5%
Rent to Value Ratio
Active
$499,000
3
bds
|
2
ba
|
1,520
sqft
|
built
2000
1321 E Escuda Dr, Phoenix, AZ 85024
$-761
Cash flow
-8.0%
Cash-on-Cash Return
3.8%
Cap rate
0.5%
Rent to Value Ratio
Active
$1,195,000
4
bds
|
3
ba
|
2,865
sqft
|
built
2008
2308 E Dry Wood Rd, Phoenix, AZ 85024
$-2,179
Cash flow
-9.5%
Cash-on-Cash Return
3.5%
Cap rate
0.5%
Rent to Value Ratio
Active
$498,999
2
bds
|
2
ba
|
1,400
sqft
|
built
1983
1042 E Utopia Rd, Phoenix, AZ 85024
$-462
Cash flow
-4.8%
Cash-on-Cash Return
4.6%
Cap rate
0.6%
Rent to Value Ratio
Active
$1,250,000
5
bds
|
3
ba
|
2,779
sqft
|
built
2021
2028 E Chama Dr, Phoenix, AZ 85024
$-2,819
Cash flow
-11.8%
Cash-on-Cash Return
3.0%
Cap rate
0.4%
Rent to Value Ratio
Active
$435,000
3
bds
|
2
ba
|
1,052
sqft
|
built
1996
22407 N 20th Pl, Phoenix, AZ 85024
$-853
Cash flow
-10.2%
Cash-on-Cash Return
3.3%
Cap rate
0.5%
Rent to Value Ratio
Active
$425,000
3
bds
|
3
ba
|
1,467
sqft
|
built
2005
2250 E Deer Valley Rd, Phoenix, AZ 85024
$-821
Cash flow
-10.1%
Cash-on-Cash Return
3.4%
Cap rate
0.5%
Rent to Value Ratio
Active
$415,000
3
bds
|
2
ba
|
1,150
sqft
|
built
1986
19202 N 14th St, Phoenix, AZ 85024
$-527
Cash flow
-6.6%
Cash-on-Cash Return
4.2%
Cap rate
0.5%
Rent to Value Ratio
Active
$719,000
3
bds
|
3
ba
|
2,354
sqft
|
built
1996
1623 E Runion Dr, Phoenix, AZ 85024
$-1,570
Cash flow
-11.4%
Cash-on-Cash Return
3.1%
Cap rate
0.4%
Rent to Value Ratio
Active
$539,000
4
bds
|
2
ba
|
1,784
sqft
|
built
1995
20038 N 21st St, Phoenix, AZ 85024
$-792
Cash flow
-7.7%
Cash-on-Cash Return
3.9%
Cap rate
0.5%
Rent to Value Ratio
Active
$1,150,000
5
bds
|
4
ba
|
3,472
sqft
|
built
2019
24314 N 21st Pl, Phoenix, AZ 85024
$-3,427
Cash flow
-15.5%
Cash-on-Cash Return
2.1%
Cap rate
0.3%
Rent to Value Ratio
Active
$690,000
3
bds
|
2
ba
|
2,157
sqft
|
built
2007
2911 E Quiet Hollow Ln, Phoenix, AZ 85024
$-1,415
Cash flow
-10.7%
Cash-on-Cash Return
3.2%
Cap rate
0.4%
Rent to Value Ratio

Active
$699,000
4
bds
|
3
ba
|
2,649
sqft
|
built
2008
2838 E Shady Spring Trl, Phoenix, AZ 85024
$-1,180
Cash flow
-8.8%
Cash-on-Cash Return
3.7%
Cap rate
0.5%
Rent to Value Ratio
Active
$238,000
2
bds
|
2
ba
|
817
sqft
|
built
1985
19601 N 7th St, Phoenix, AZ 85024
$-407
Cash flow
-8.9%
Cash-on-Cash Return
3.6%
Cap rate
0.6%
Rent to Value Ratio
Active
$375,000
2
bds
|
2
ba
|
1,087
sqft
|
built
2008
2725 E Mine Creek Rd, Phoenix, AZ 85024
$-787
Cash flow
-10.9%
Cash-on-Cash Return
3.2%
Cap rate
0.5%
Rent to Value Ratio